Mini Case: 12 – 35
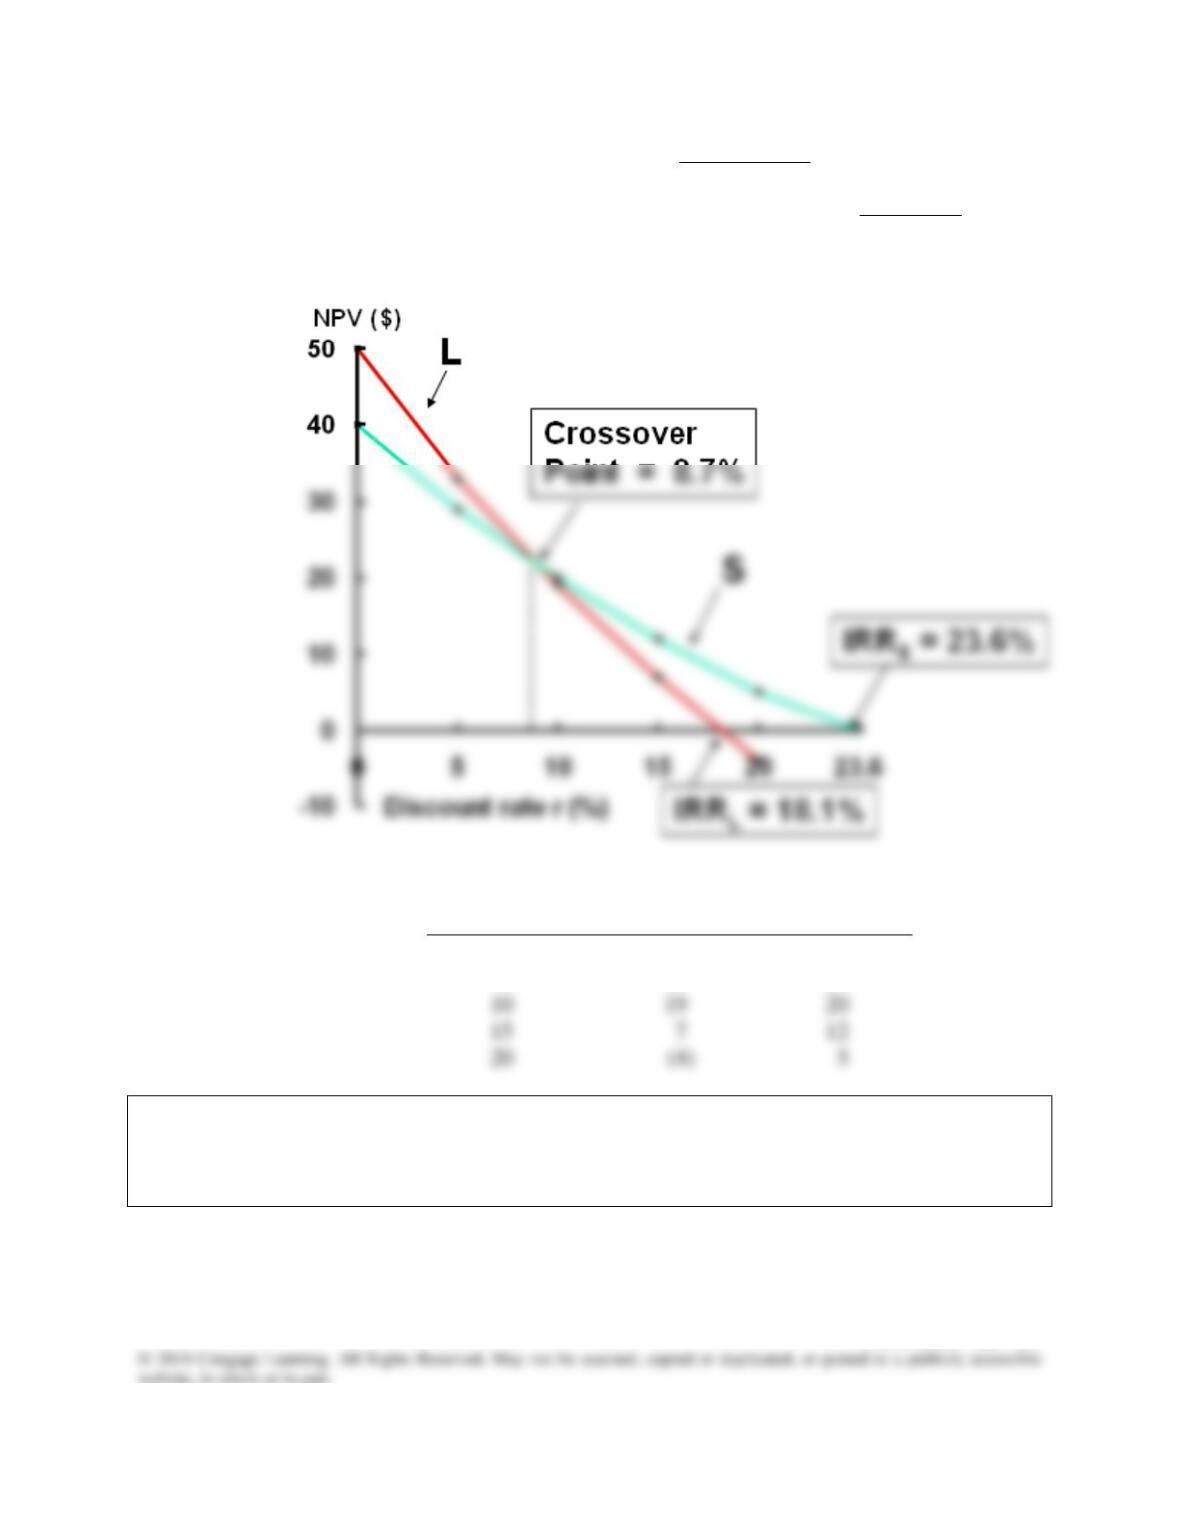
4. From the figure below, it appears that the crossover rate is between 8% and 9%.
The precise value is approximately 8.7%. One can calculate the crossover rate by
(1) going back to the data on the problem, finding the cash flow differences for each
year, (2) entering those differences into the cash flow register, and (3) pressing the
IRR button to get the crossover rate, 8.68% ≈ 8.7%.
r
NPVL
NPVS
0%
$50
$40
5
33
29
10
19
20
15
7
12
20
(4)
5
e. 2. Look at your NPV profile graph without referring to the actual NPVs and IRRs.
Which franchise or franchises should be accepted if they are independent?
Mutually exclusive? Explain. Are your answers correct at any cost of capital less
than 23.6%?
Mini Case: 12 – 36
Answer: The NPV profiles show that the IRR and NPV criteria lead to the same accept/reject
decision for any independent project. Consider Franchise L. It intersects the X-axis at
f. What is the underlying cause of ranking conflicts between NPV and IRR?
Answer: For normal projects’ NPV profiles to cross, one project must have both a higher vertical
axis intercept and a steeper slope than the other. A project’s vertical axis intercept
Mini Case: 12 – 37
g. Define the term modified IRR (MIRR). Find the MIRRs for Franchises L and S.
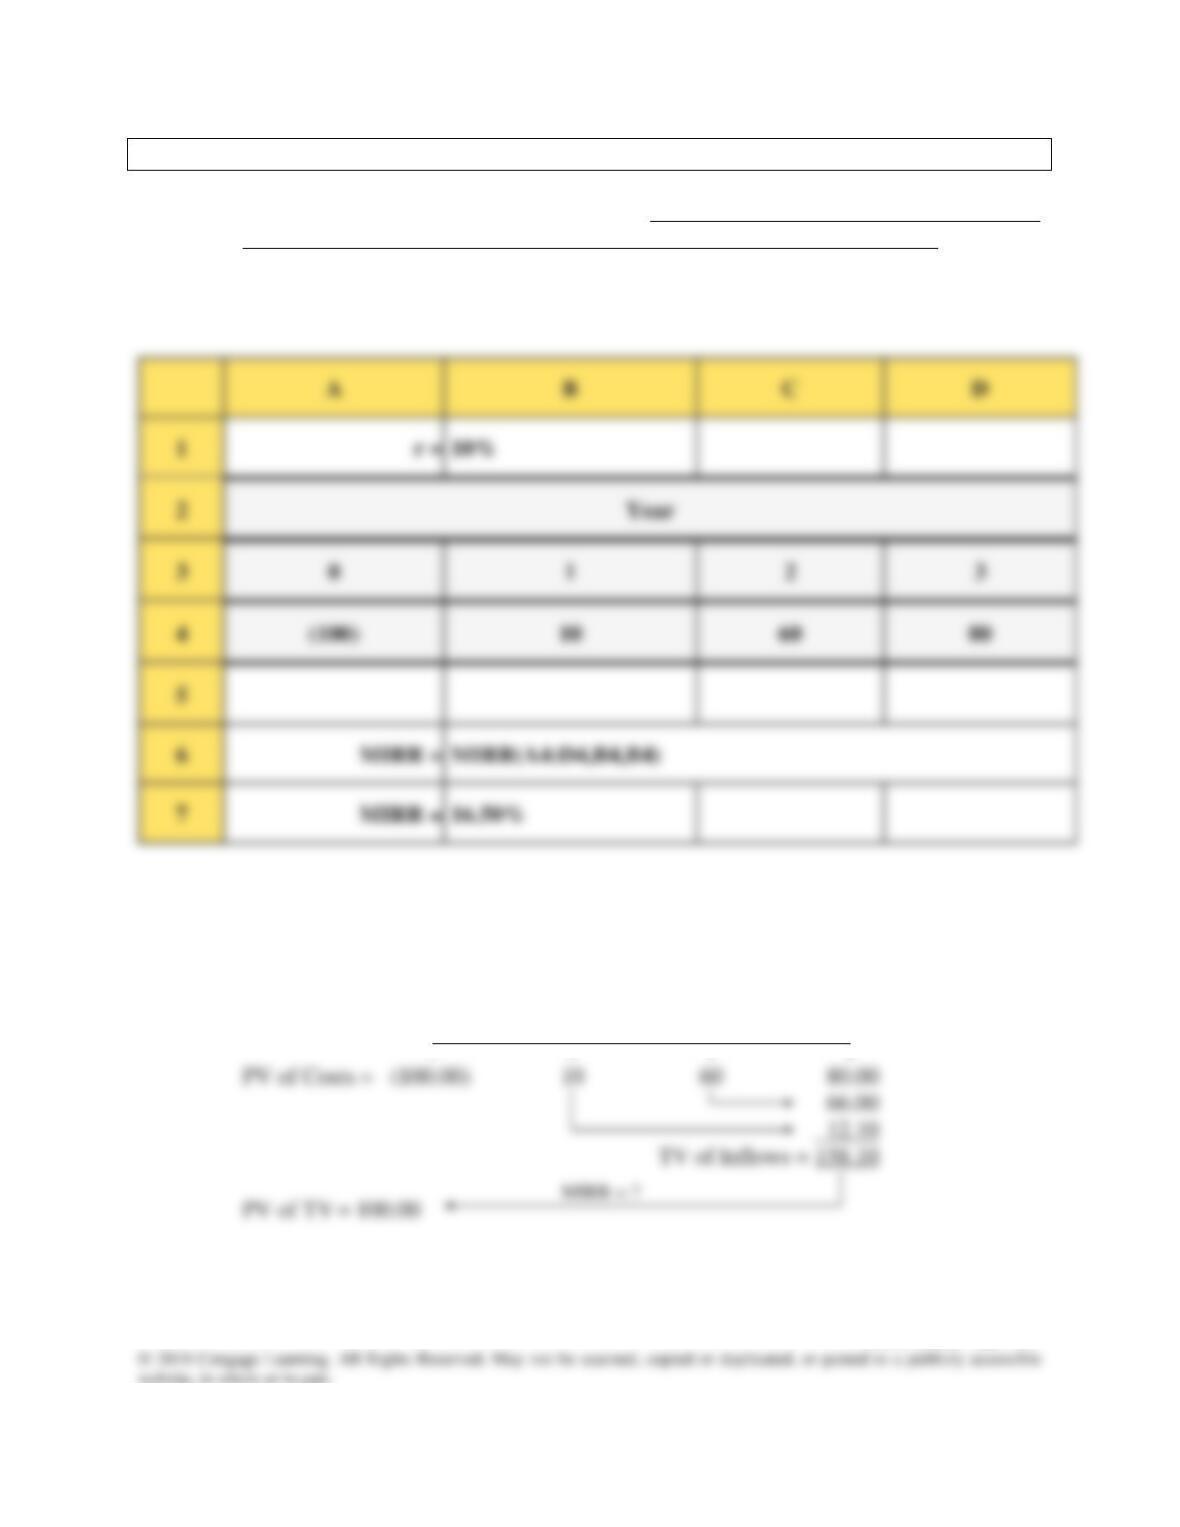
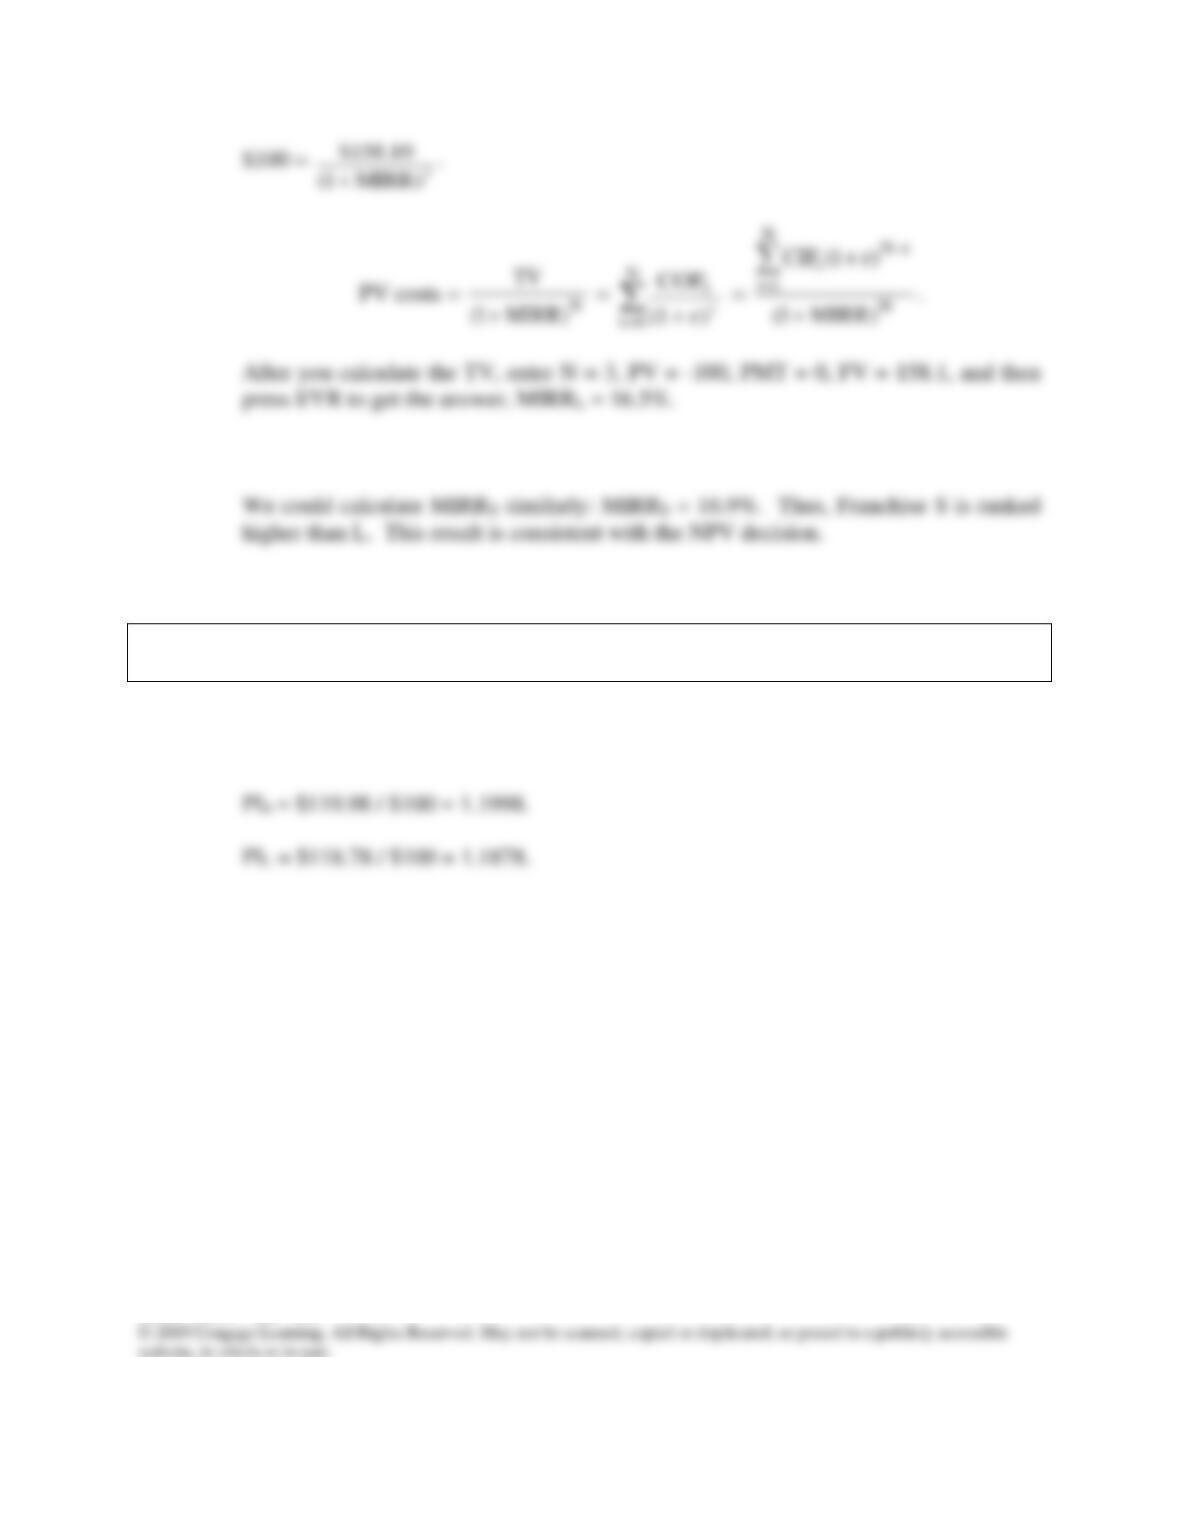
Answer: MIRR is the discount rate that equates the present value of the terminal value of the
inflows, compounded at the cost of capital, to the present value of the costs.
Use the Excel function MIRR:
Alternatively, here is the setup for calculating Franchise L’s modified IRR:
0 1 2 3
| | | |
r = 10%
Mini Case: 12 – 38
h. What does the profitability index (PI) measure? What are the PI’s for Franchises
S and L?
Answer: The PI is equal to the present value of all future cash flows divided by the initial cost.
It measures the “bang for the buck.”
Mini Case: 12 – 39
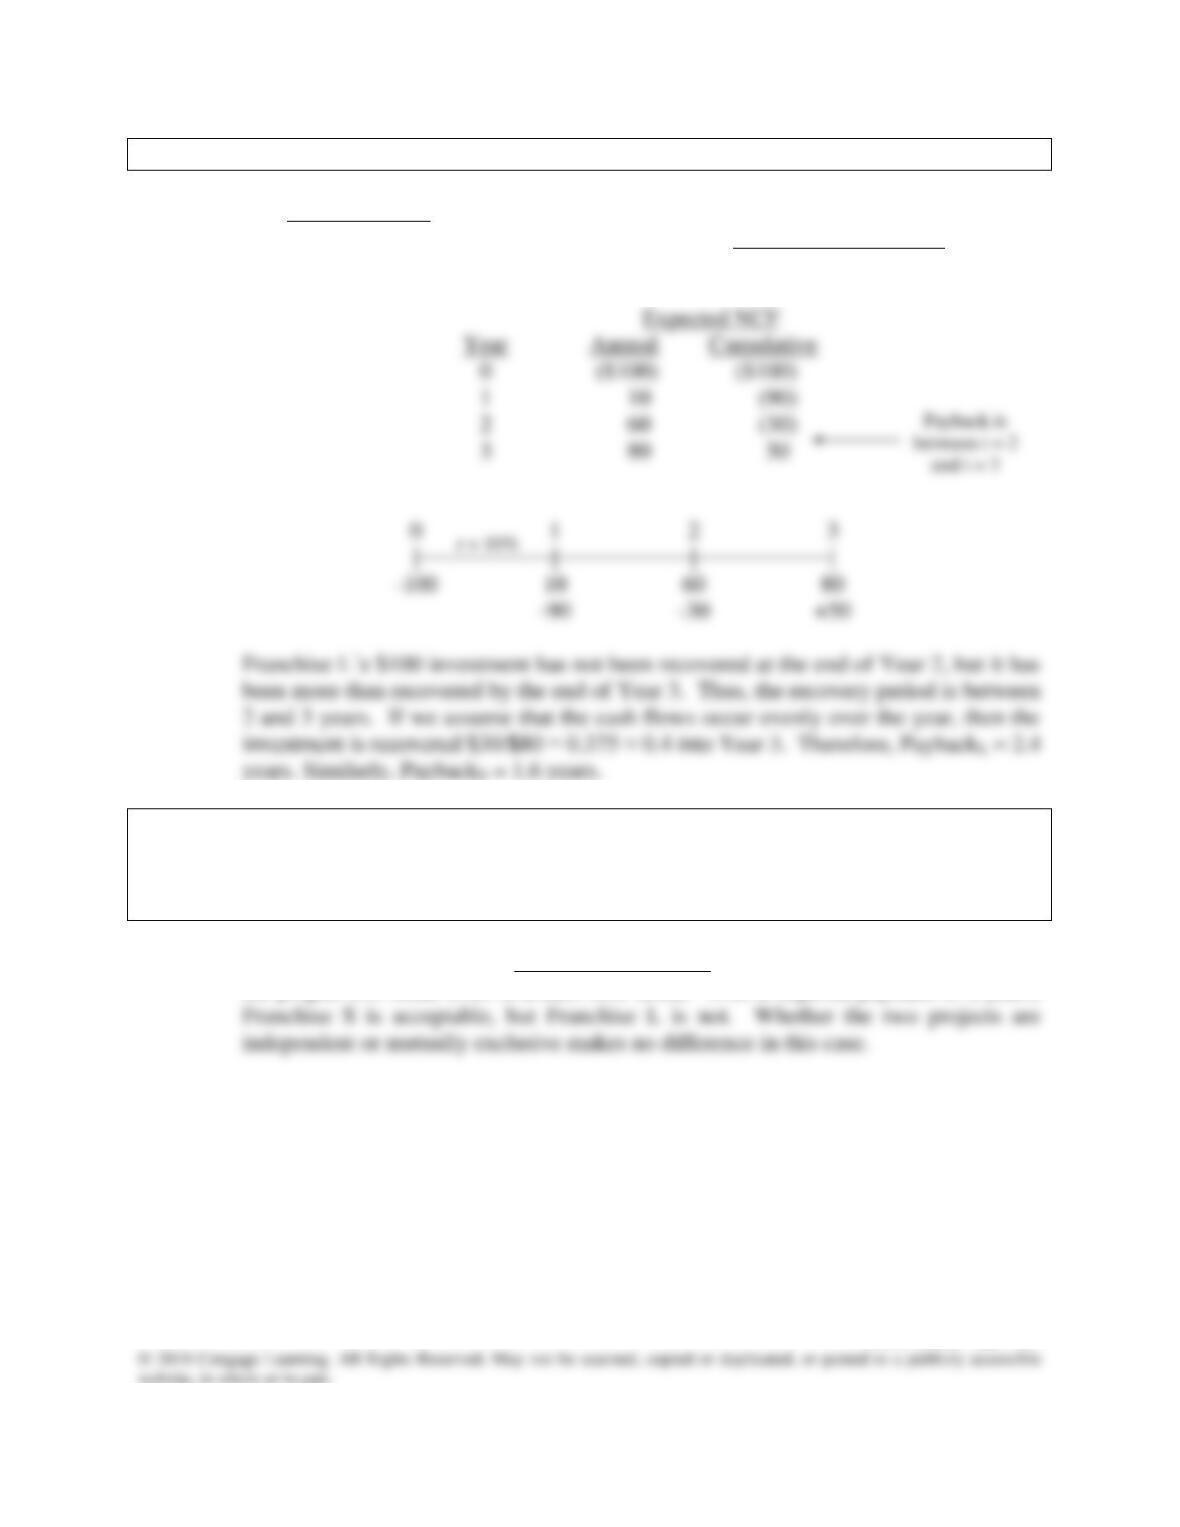
i. 1. What is the payback period? Find the paybacks for Franchises L and S.
Answer: The payback period is the expected number of years required to recover a project’s
cost. We calculate the payback by developing the cumulative cash flows as shown
below for Franchise L (in thousands of dollars):
i. 2. What is the rationale for the payback method? According to the payback
criterion, which franchise or franchises should be accepted if the firm’s maximum
acceptable payback is 2 years, and if Franchises L and S are independent? If they
are mutually exclusive?
Answer: Payback represents a type of “breakeven” analysis: The payback period tells us when
the project will break even in a cash flow sense. With a required payback of 2 years,
Mini Case: 12 – 40
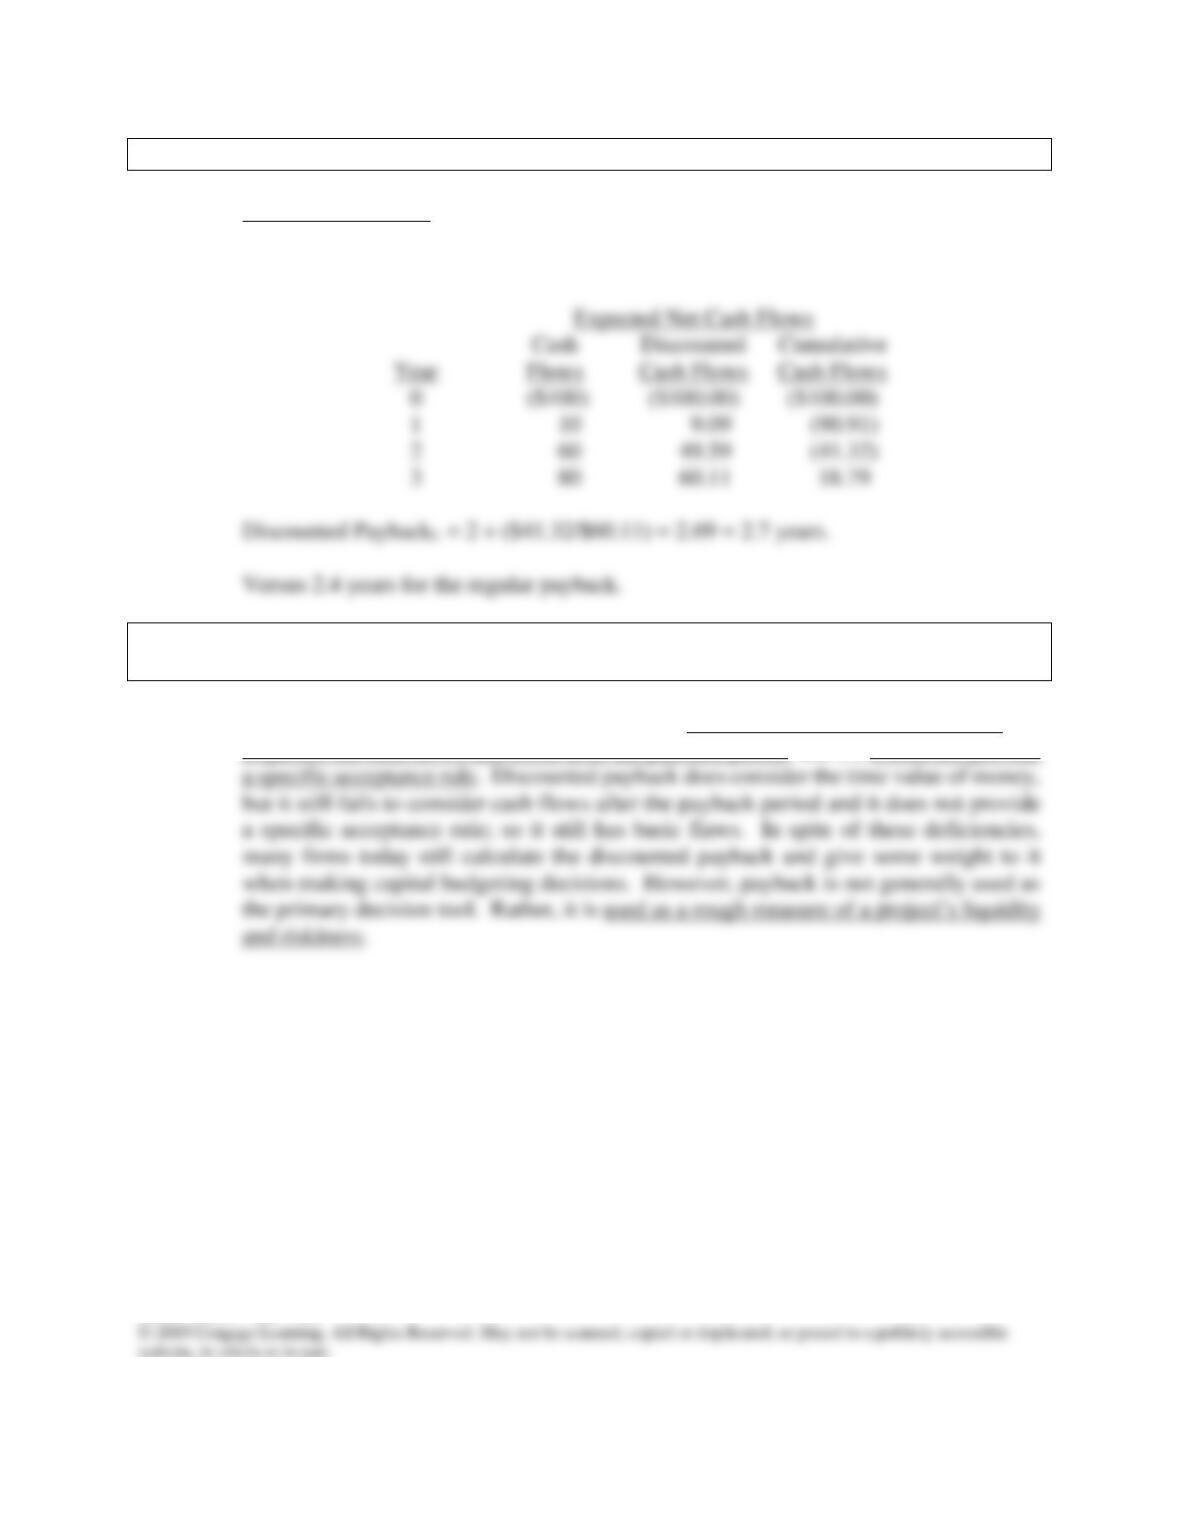
i. 3. What is the difference between the regular and discounted payback periods?
Answer: Discounted payback is similar to payback except that discounted cash flows are used.
Setup for Franchise L’s discounted payback, assuming a 10% cost of capital:
i. 4. What is the main disadvantage of discounted payback? Is the payback method of
any real usefulness in capital budgeting decisions?
Answer: Regular payback has 3 critical deficiencies: (1) It ignores the time value of money, (2)
it ignores the cash flows that occur after the payback period, and (3) it does not provide
Mini Case: 12 – 41
j. As a separate project (Project P), you are considering sponsoring a pavilion at the
upcoming World’s Fair. The pavilion would cost $800,000, and it is expected to
result in $5 million of incremental cash inflows during its 1 year of operation.
However, it would then take another year, and $5 million of costs, to demolish the
site and return it to its original condition. Thus, Project P’s expected net cash
flows look like this (in millions of dollars):
Year Net Cash Flows
0 −$0.8
1 5.0
2 −5.0
The project is estimated to be of average risk, so its cost of capital is 10%.
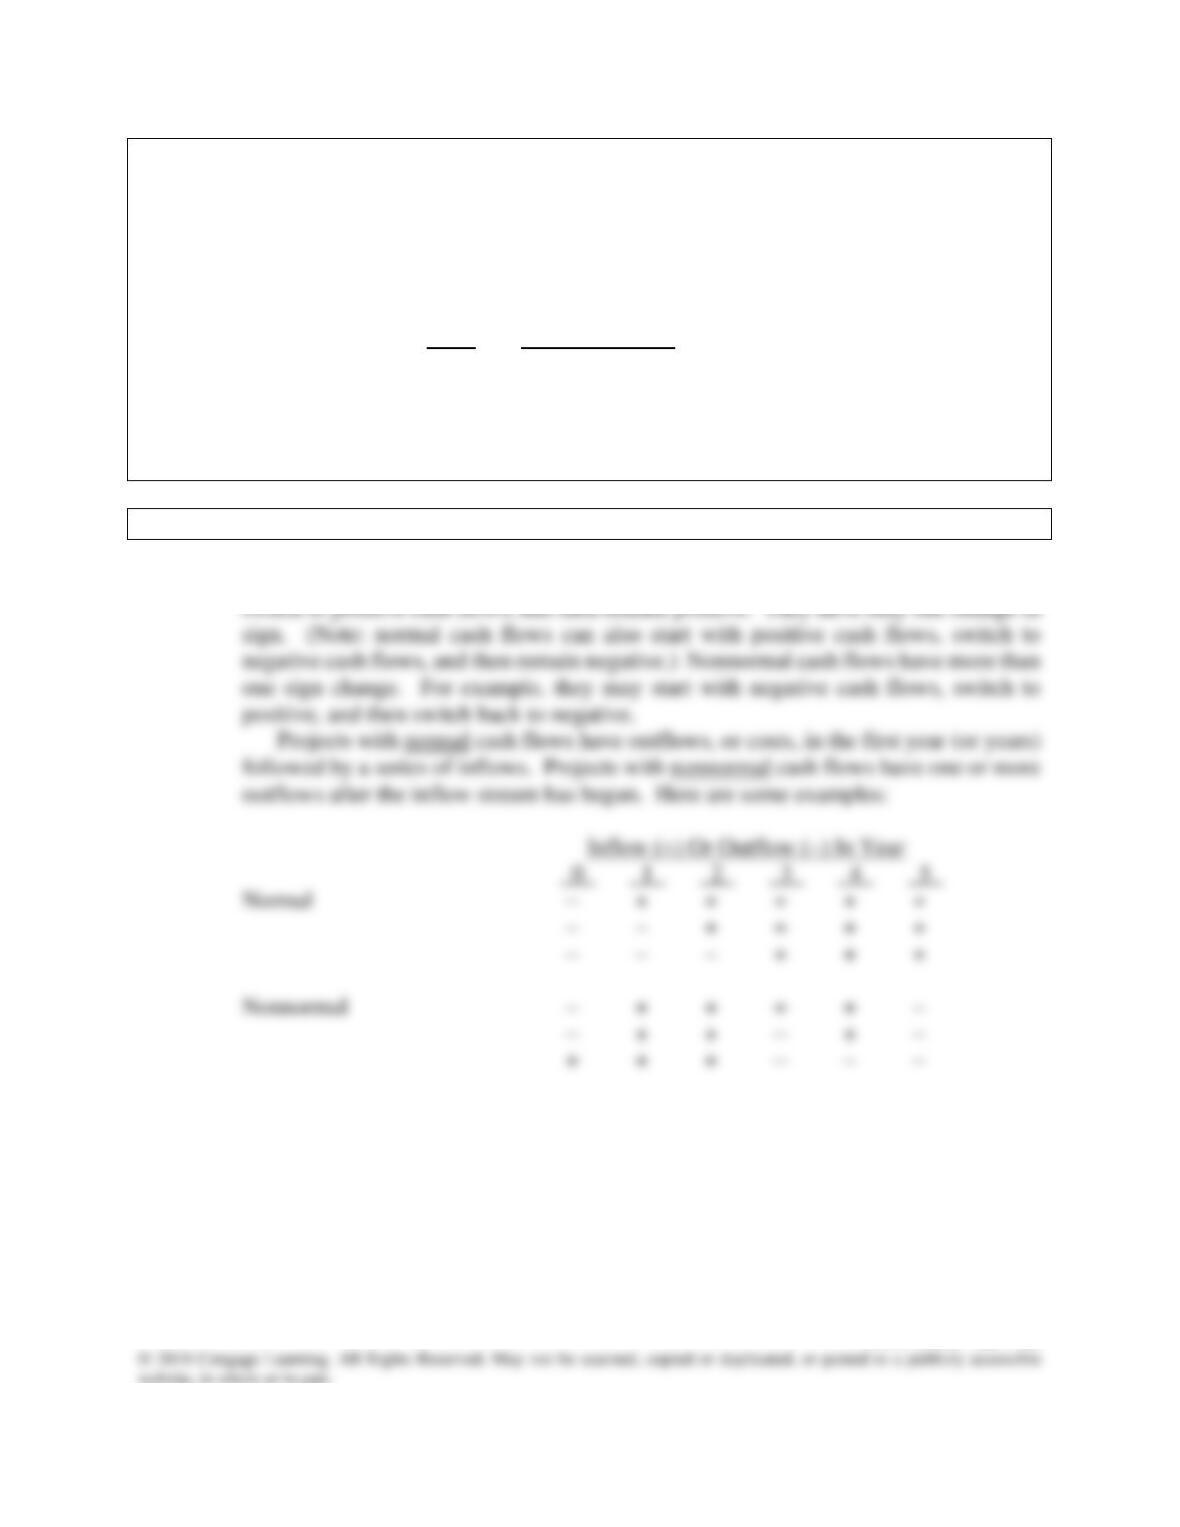
j. 1. What are normal and nonnormal cash flows?
Answer: Normal cash flows begin with a negative cash flow (or a series of negative cash flows),
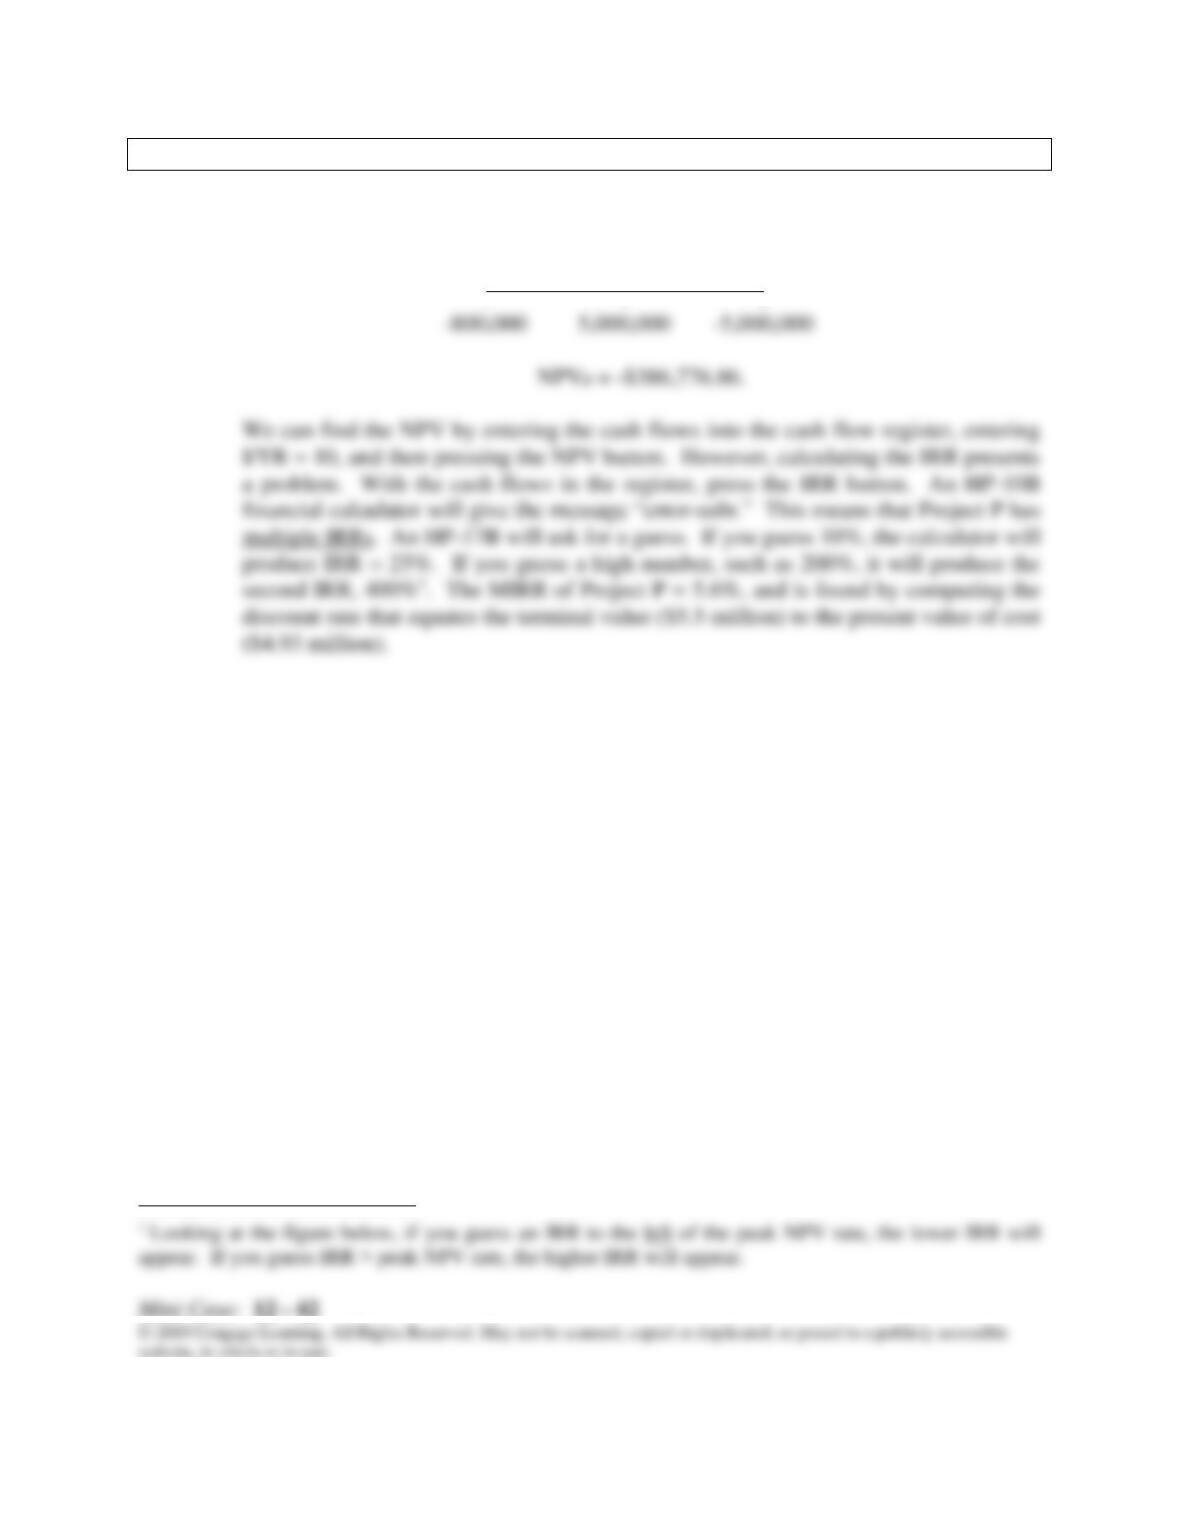
j. 2. What is Project P’s NPV? What is its IRR? Its MIRR?
Answer: Here is the time line for the cash flows, and the NPV:
0 1 2
| | |
10%
Mini Case: 12 – 43
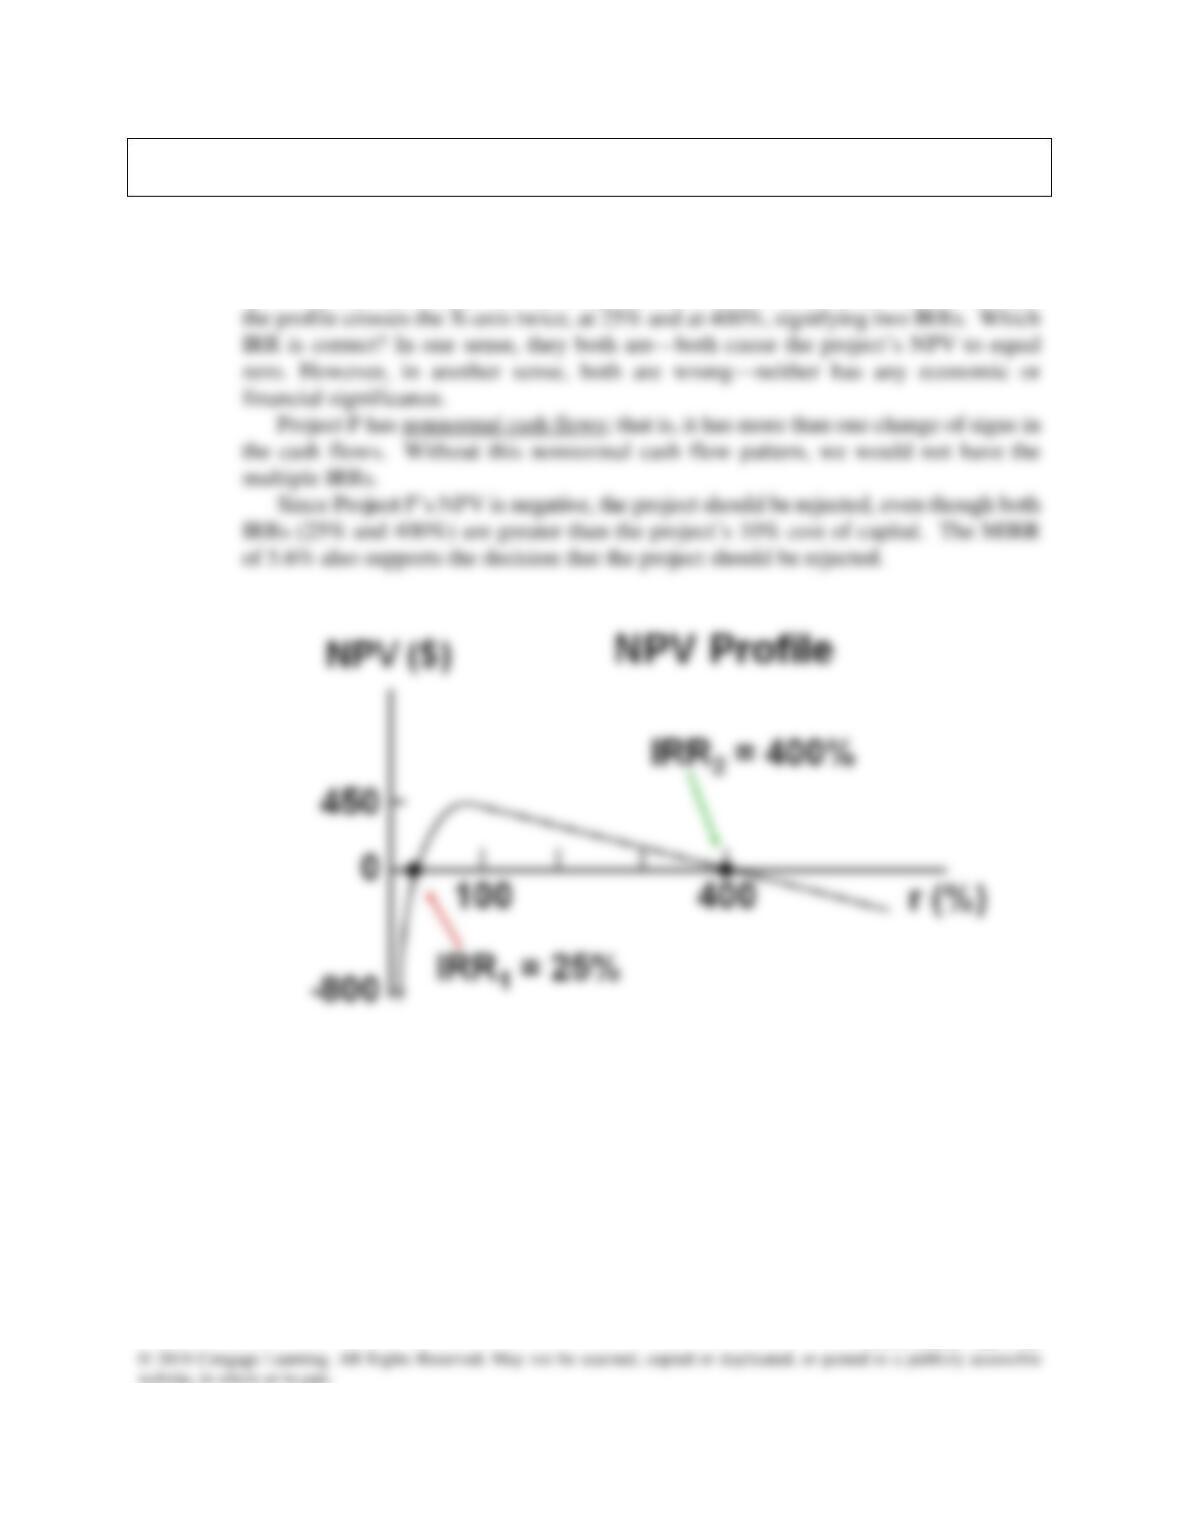
j. 3. Draw Project P’s NPV profile. Does Project P have normal or nonnormal cash
flows? Should this project be accepted?
Answer: You could put the cash flows in your calculator and then enter a series of r values, get
an NPV for each, and then plot the points to construct the NPV profile. We used a
spreadsheet program to automate the process and then to draw the profile. Note that
Mini Case: 12 – 44
k. In an unrelated analysis, you have the opportunity to choose between the following
two mutually exclusive projects, Project T (which lasts for two years) and Project
F (which lasts for four years):
Expected Net Cash Flows
Year Project T Project F
0 ($100,000) ($100,000)
1 60,000 33,500
2 60,000 33,500
3 — 33,500
4 — 33,500
The projects provide a necessary service, so whichever one is selected is expected
to be repeated into the foreseeable future. Both projects have a 10% cost of
capital.
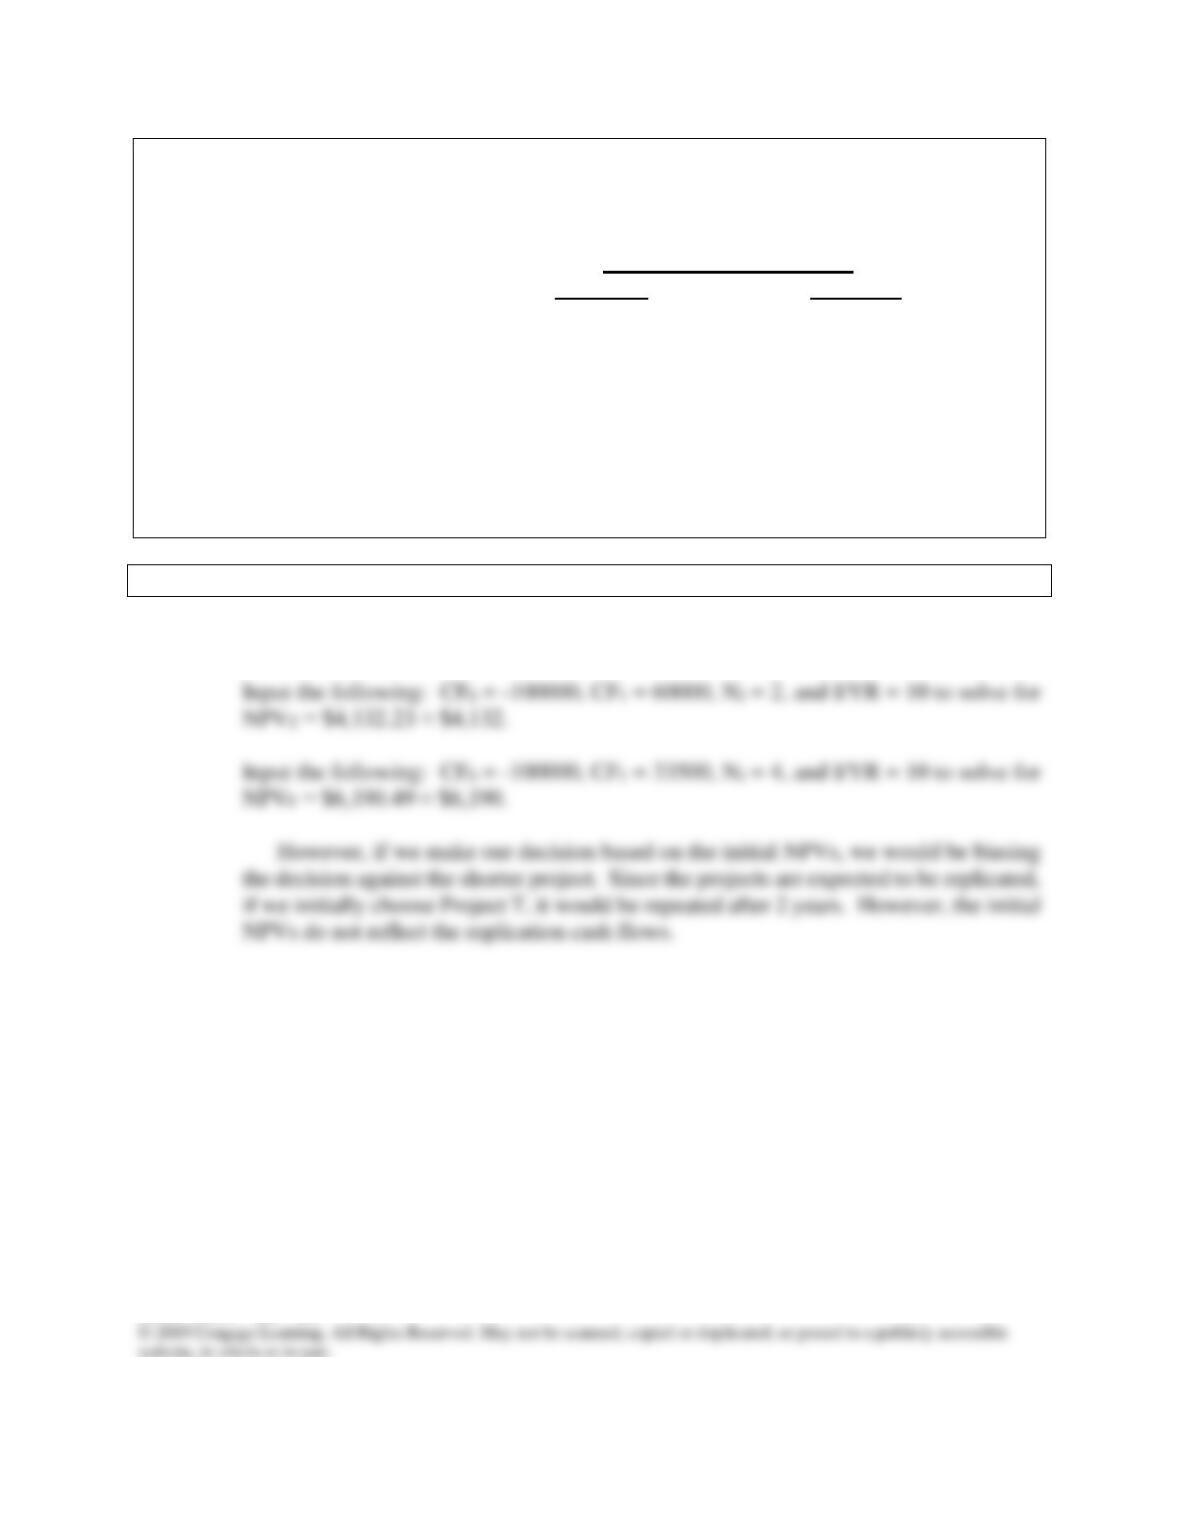
k. 1. What is each project’s initial NPV without replication?
Answer: The NPVs, found with a financial calculator, are calculated as follows:
Mini Case: 12 – 45
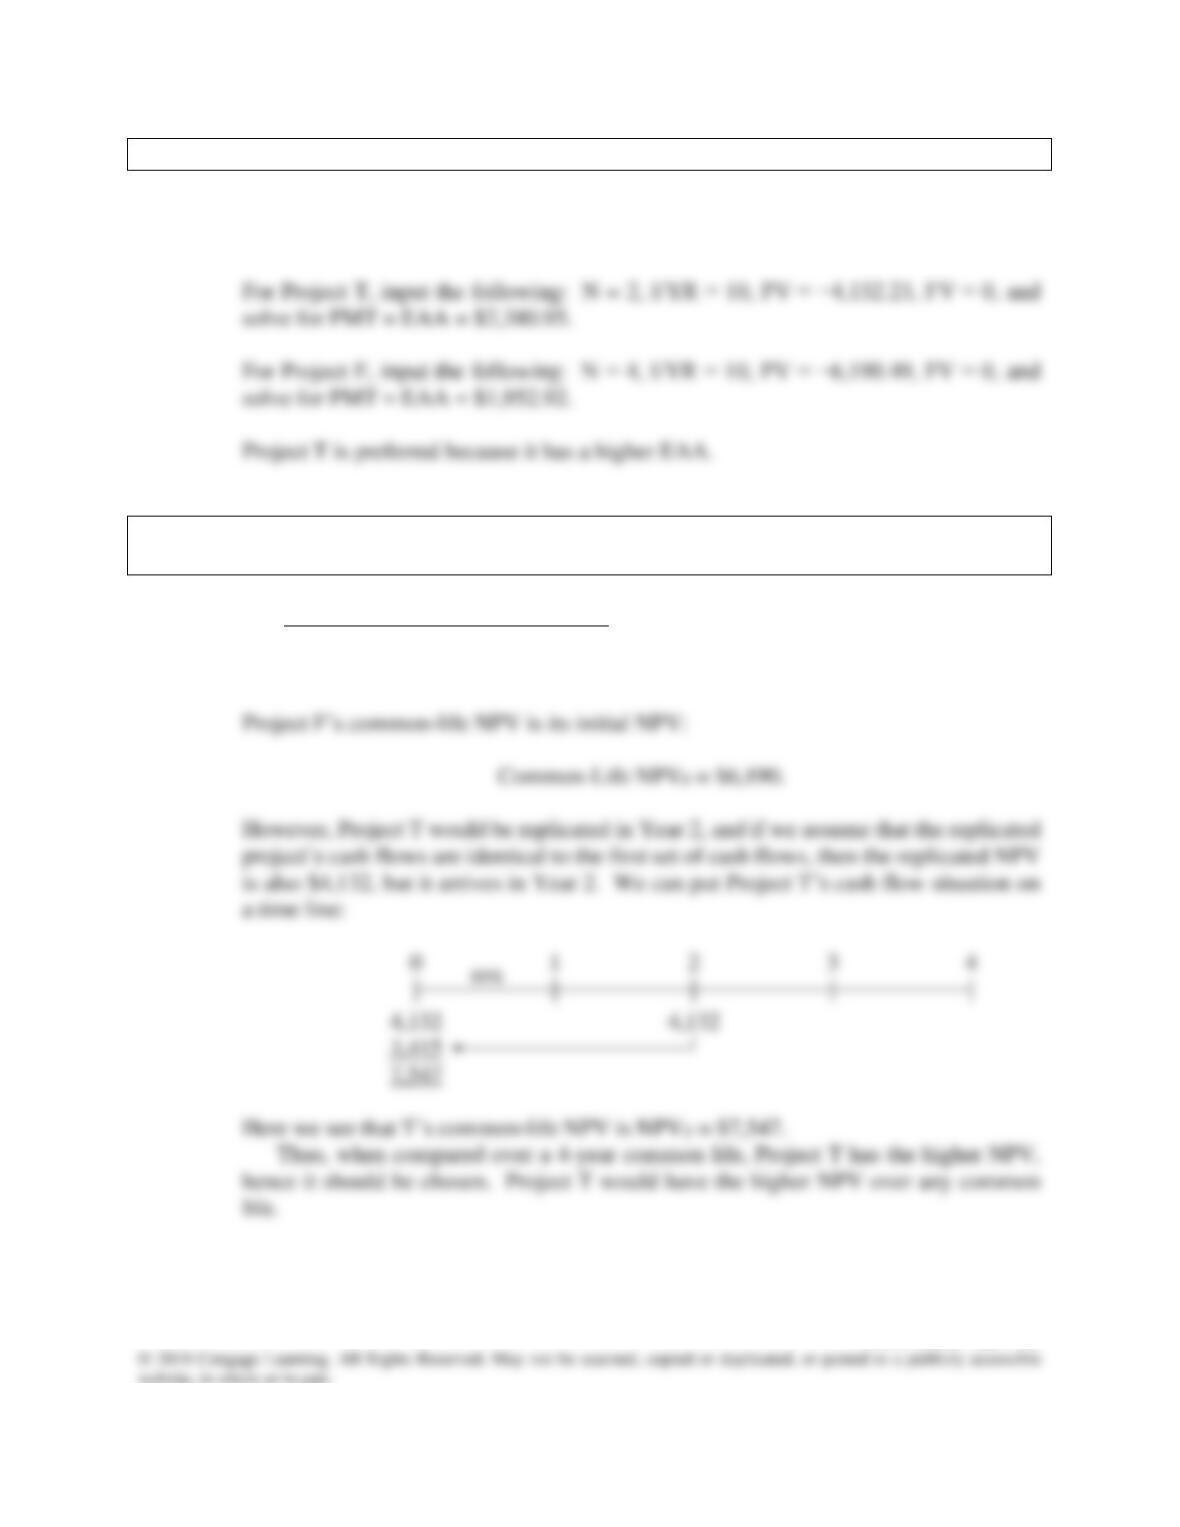
k. 2. What is each project’s equivalent annual annuity?
Answer: We begin with the NPVs found in the previous step. We then find the annuity payment
stream that has the same present value as follows:
k. 3. Now apply the replacement chain approach to determine the projects’ extended
NPVs. Which project should be chosen?
Answer: The simple replacement chain approach assumes that the projects will be replicated out
to a common life. Since Project T has a 2-year life and F has a 4-year life, the shortest
common life is 4 years.
Mini Case: 12 – 46
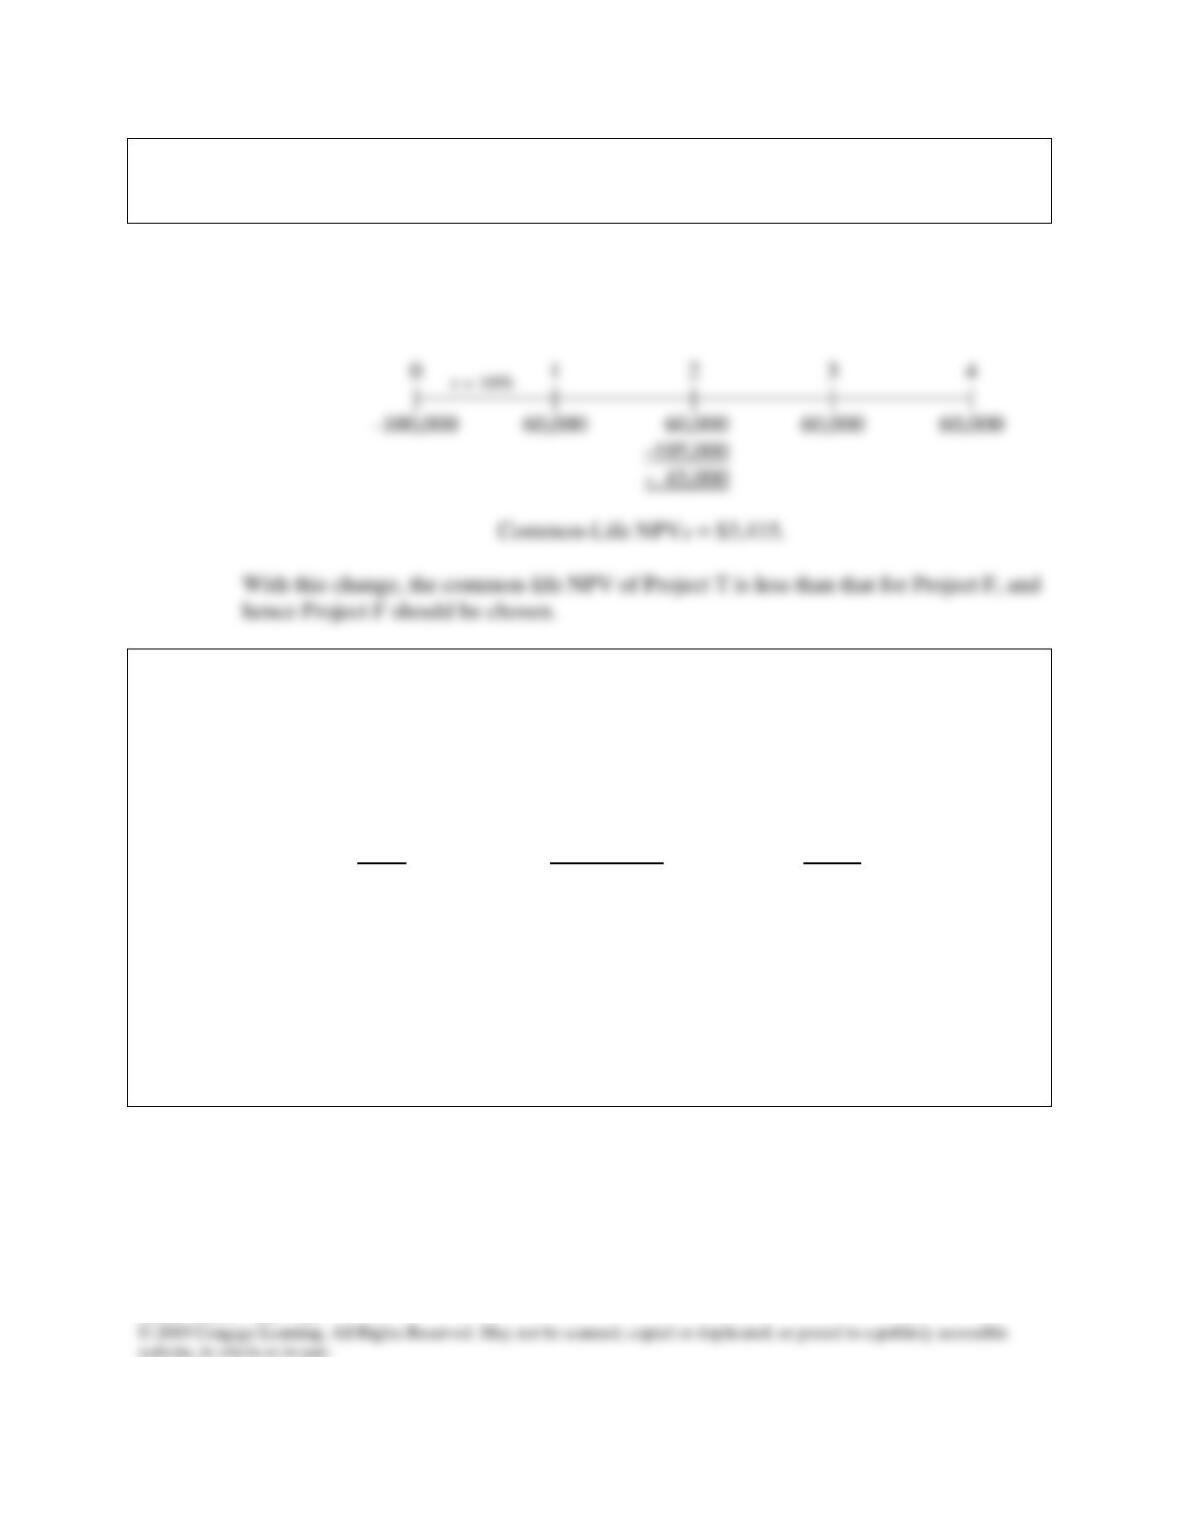
k. 4. Now assume that the cost to replicate Project T in 2 years will increase to $105,000
because of inflationary pressures. How should the analysis be handled now, and
which project should be chosen?
Answer: If the cost of Project T is expected to increase, the replication project is not identical to
the original, and the EAA approach cannot be used. In this situation, we would put the
cash flows on a time line as follows:
l. You are also considering another project which has a physical life of 3 years; that
is, the machinery will be totally worn out after 3 years. However, if the project
were terminated prior to the end of 3 years, the machinery would have a positive
salvage value. Here are the project’s estimated cash flows:
Initial Investment End-of-Year
And Operating Net Salvage
Year Cash Flows Value
0 ($5,000) $5,000
1 2,100 3,100
2 2,000 2,000
3 1,750 0
Using the 10% cost of capital, what is the project’s NPV if it is operated for the
full 3 years? Would the NPV change if the company planned to terminate the
project at the end of Year 2? At the end of Year 1? What is the project’s optimal
(economic) life?
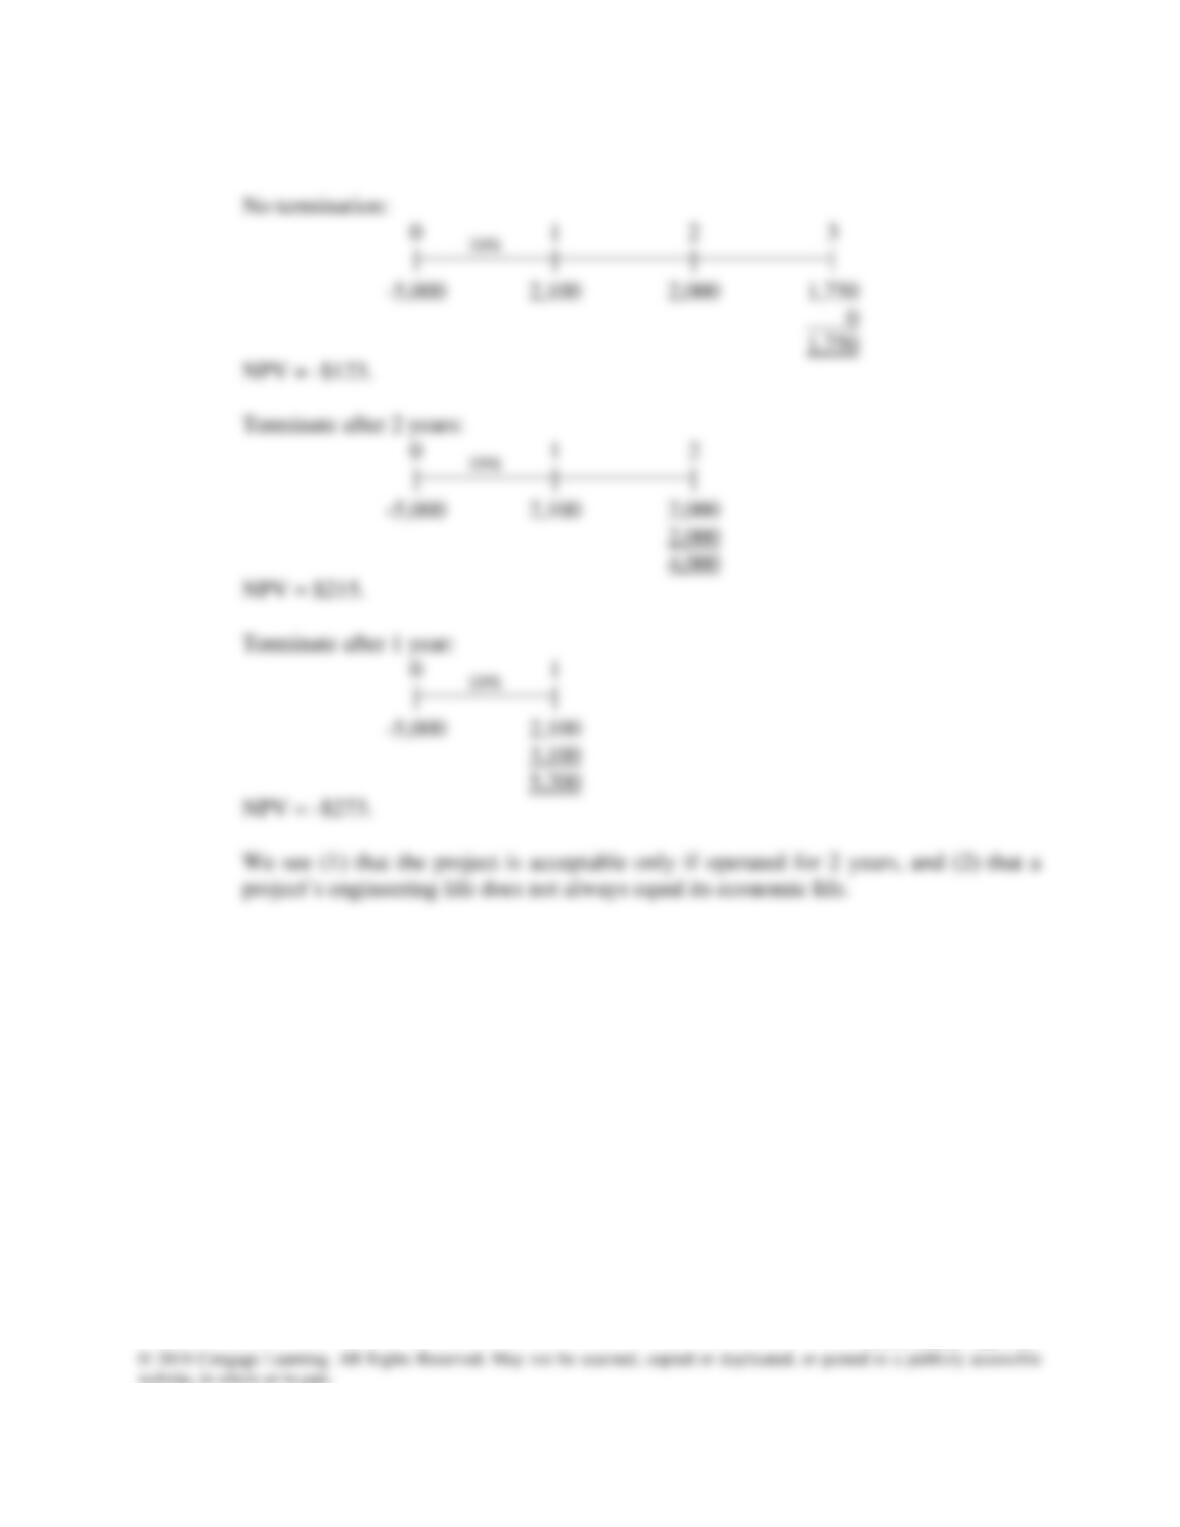
Mini Case: 12 – 47
Answer: Here are the time lines for the 3 alternative lives: