Build a Model Solution
Chapter: 10
Problem: 23
Expected Net Cash Flows
Time Project A Project B
0($375) ($575)
1($300) $190
2($200) $190
3($100) $190
7($200) $0
@ 12% cost of capital @ 18% cost of capital
WACC = 12% WACC = 18%
At a cost of capital of 12%, Project A should be selected. However, if the cost of capital rises to 18%, then the choice is
reversed, and Project B should be accepted.
added separately.
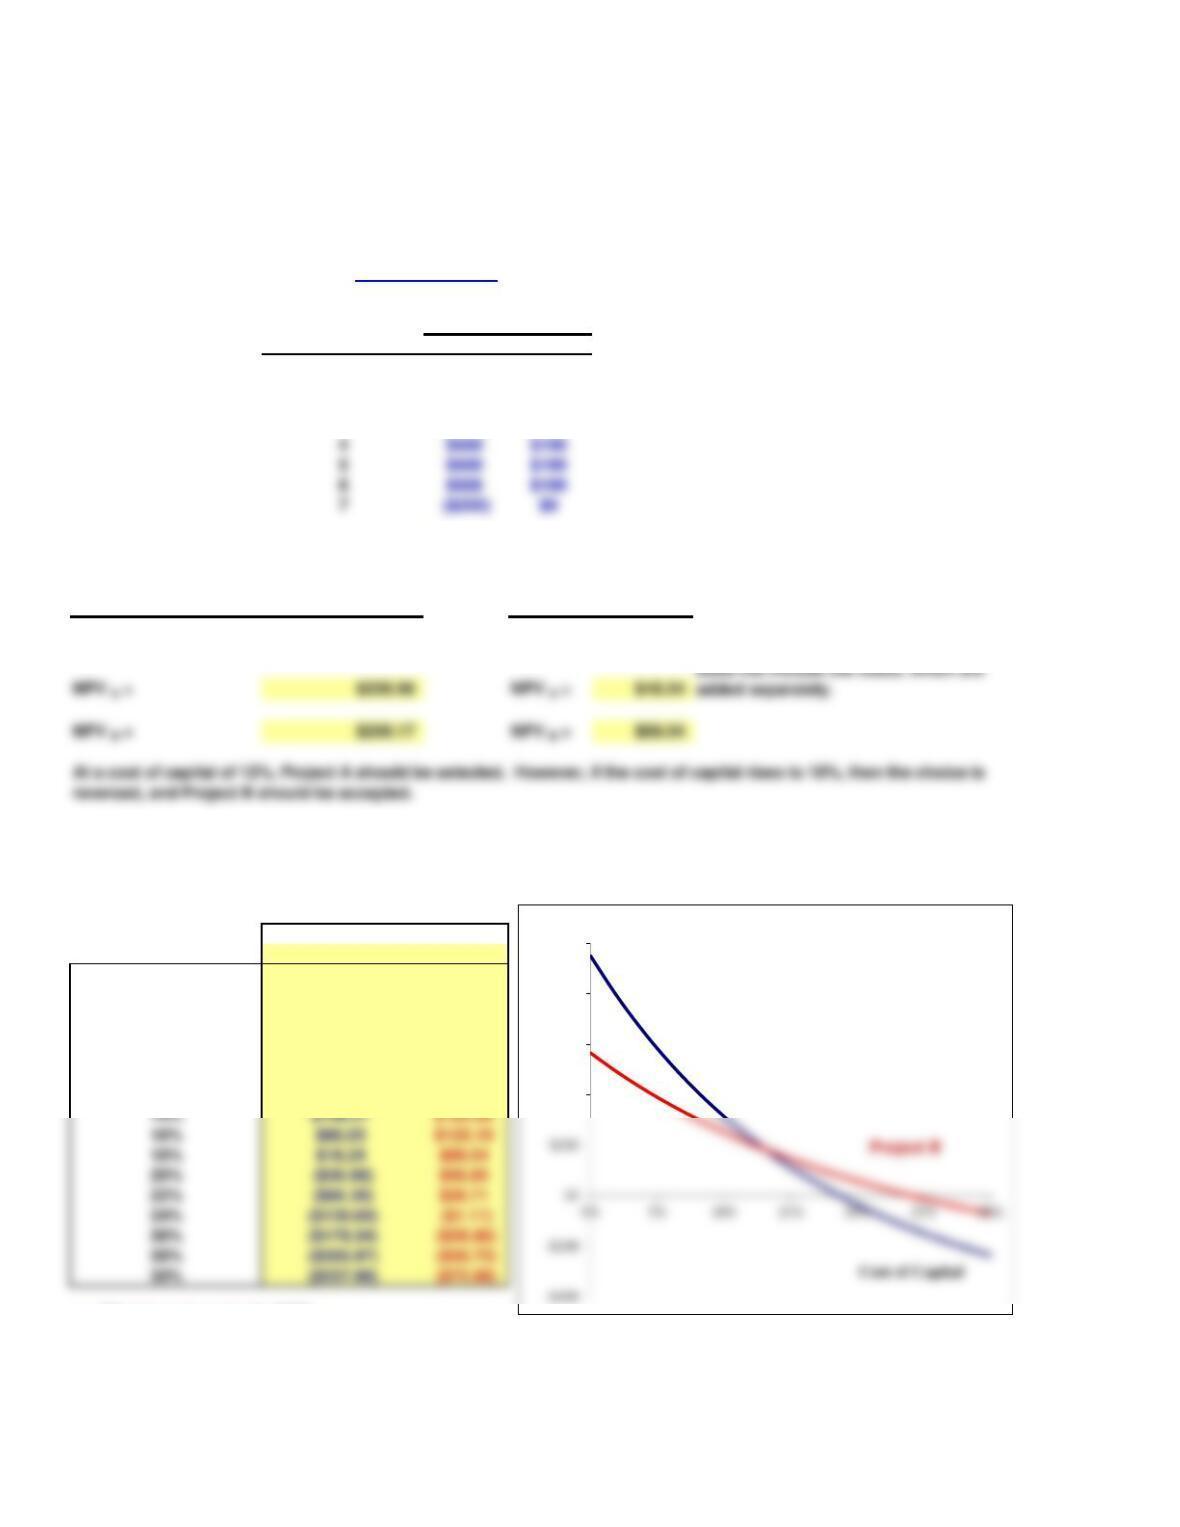
b. Construct NPV profiles for Projects A and B.
Project A Project B
$226.96 $206.17
0% $951.00 $565.00
2% $790.31 $489.27
4% $648.61 $421.01
6% $523.41 $359.29
8% $412.58 $303.35
10% $314.28 $252.50
12% $226.96 $206.17
14% $149.27 $163.85
c. What is each project’s IRR?
We find the internal rate of return with Excel’s IRR function:
11/26/2018
Before we can graph the NPV profiles for these projects, we must create a data table of project NPVs relative to differing
costs of capital.
Gardial Fisheries is considering two mutually exclusive investments. The projects’ expected net cash flows are as follows:
a. If each project’s cost of capital is 12%, which project should be selected? If the cost of capital is 18%, what project is
the proper choice?
Use Excel’s NPV function as explained in
this chapter’s Tool Kit. Note that the range
$400
$600
$800
$1,000
NPV
NPV Profiles
Project A
IRR A = 18.64%
IRR B = 23.92%
d. What is the crossover rate, and what is its significance?
Cash flow
Time differential
0$200
1 ($490)
2 ($390) Crossover rate = 13.14%
3 ($290)
4$410
5$410
6$736 $182
7 ($200)
@ 12% cost of capital @ 18% cost of capital
MIRR A = 15.43% MIRR A = 18.34%
MIRR B = 17.87% MIRR B = 20.88%
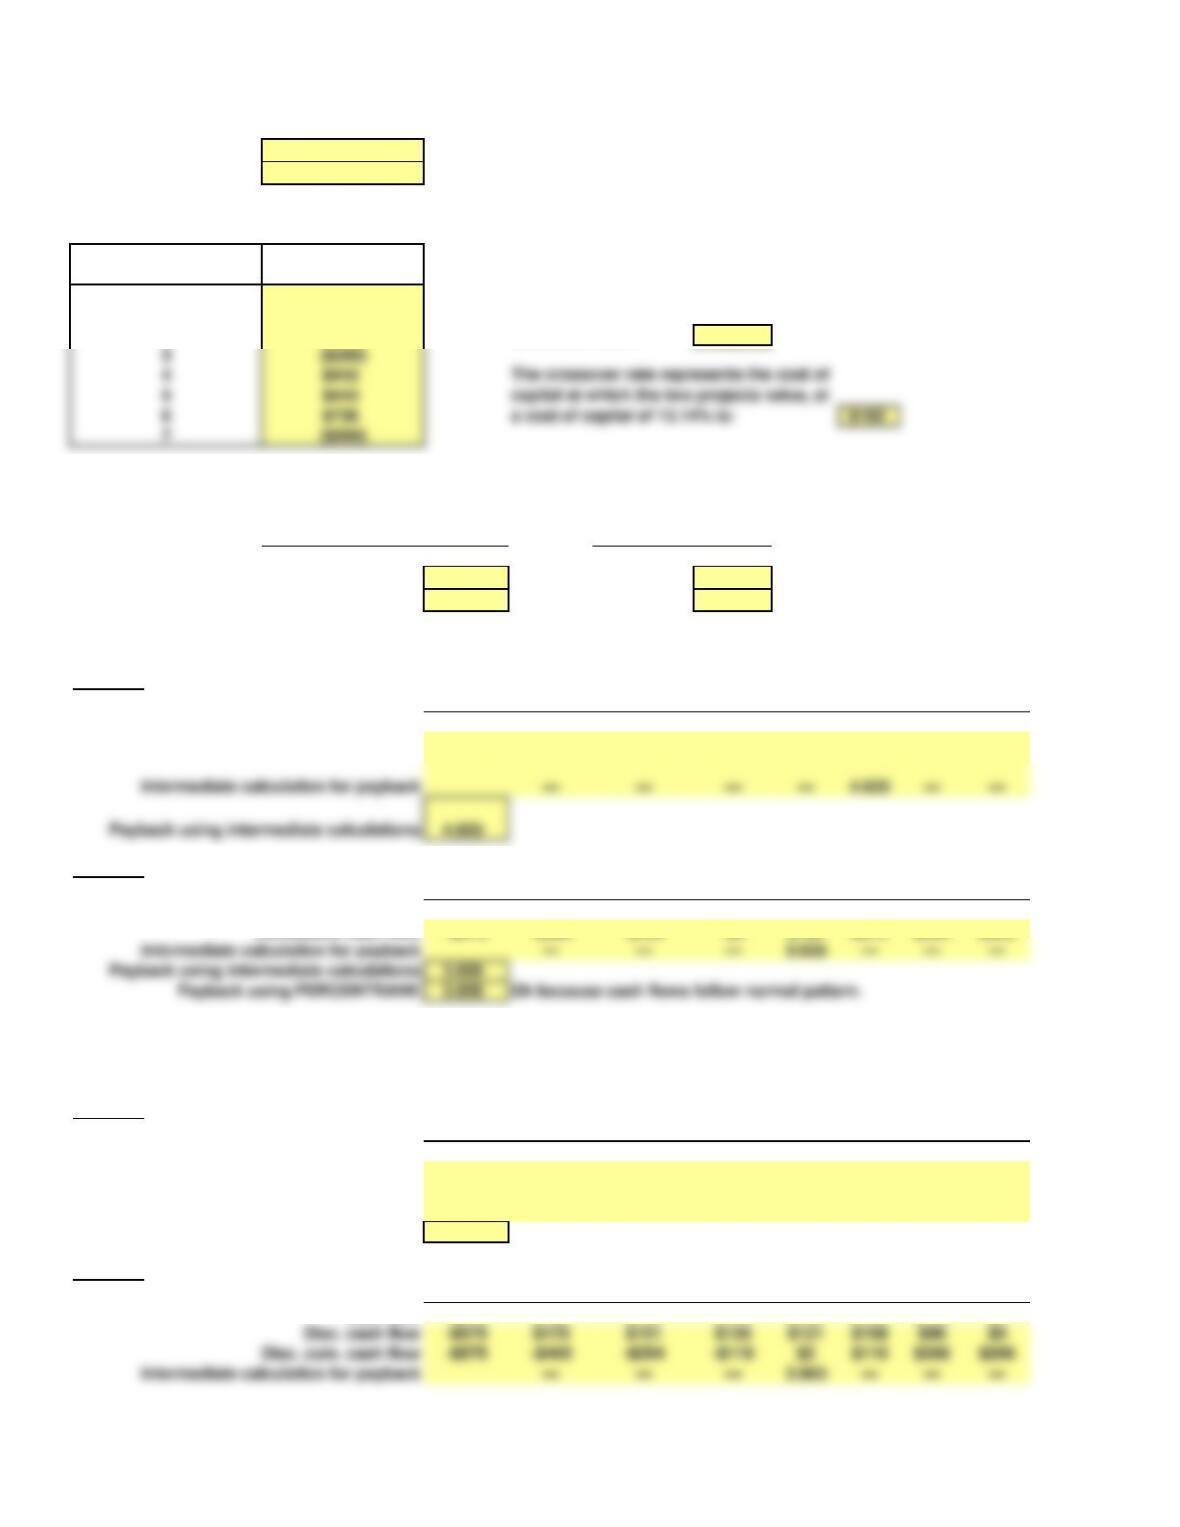
f. What is the regular payback period for these two projects?
Project A
Time period 0 1 2 3 4 5 6 7
Cash flow (375) (300) (200) (100) 600 $600 $926 ($200)
Cumulative cash flow -$375 -$675 -$875 -$975 -$375 $225 $1,151 $951
Intermediate calculation for payback
Payback using intermediate calculations
Project B
Time period 0 1 2 3 4 5 6 7
Cash flow -$575 $190 $190 $190 $190 $190 $190 $0
Cumulative cash flow -$575 -$385 -$195 -$5 $185 $375 $565 $565
Intermediate calculation for payback
Payback using intermediate calculations
g. At a cost of capital of 12%, what is the discounted payback period for these two projects?
WACC = 12%
Project A
Time period 0 1 2 3 4 5 6 7
Cash flow -$375 -$300 -$200 -$100 $600 $600 $926 -$200
Disc. cash flow -$375 -$268 -$159 -$71 $381 $340 $469 -$90
Disc. cum. cash flow -$375 -$643 -$802 -$873 -$492 -$152 $317 $227
— — — — — 5.323 —
5.323
Project B
Time period 0 1 2 3 4 5 6 7
Cash flow -$575 $190 $190 $190 $190 $190 $190 $0
Disc. cash flow -$575 $170 $151 $135 $121 $108 $96 $0
Disc. cum. cash flow -$575 -$405 -$254 -$119 $2 $110 $206 $206
Intermediate calculation for payback
e. What is each project’s MIRR at a cost of capital of 12%? At r = 18%? Hint: note that B is a 6-year project.
Note in the graph above that the X-axis intercepts are equal to the two
Payback using intermediate calculations
Intermediate calculation for payback

3.983
Discounted Payback using PERCENTRANK 3.983 Ok because cash flows follow normal pattern.
h. What is the profitability index for each project if the cost of capital is 12%?
Payback using intermediate calculations