1 –
1
CHAPTER 1
THE INVESTMENT SETTING
Answers to Questions
1. When an individual’s current money income exceeds his current consumption desires, he
saves the excess. Rather than keep these savings in his possession, the individual may
consider it worthwhile to forego immediate possession of the money for a larger future
2. Students in general tend to be borrowers because they are typically not employed and
thus have no income, but obviously consume and have expenses. The usual intent is to
3. In the 20–30-year-old segment, an individual would tend to be a net borrower because he
is in a relatively low-income bracket and has several expenditures, including
automobile(s), durable goods, etc. In the 30–40-year-old segment, the individual would
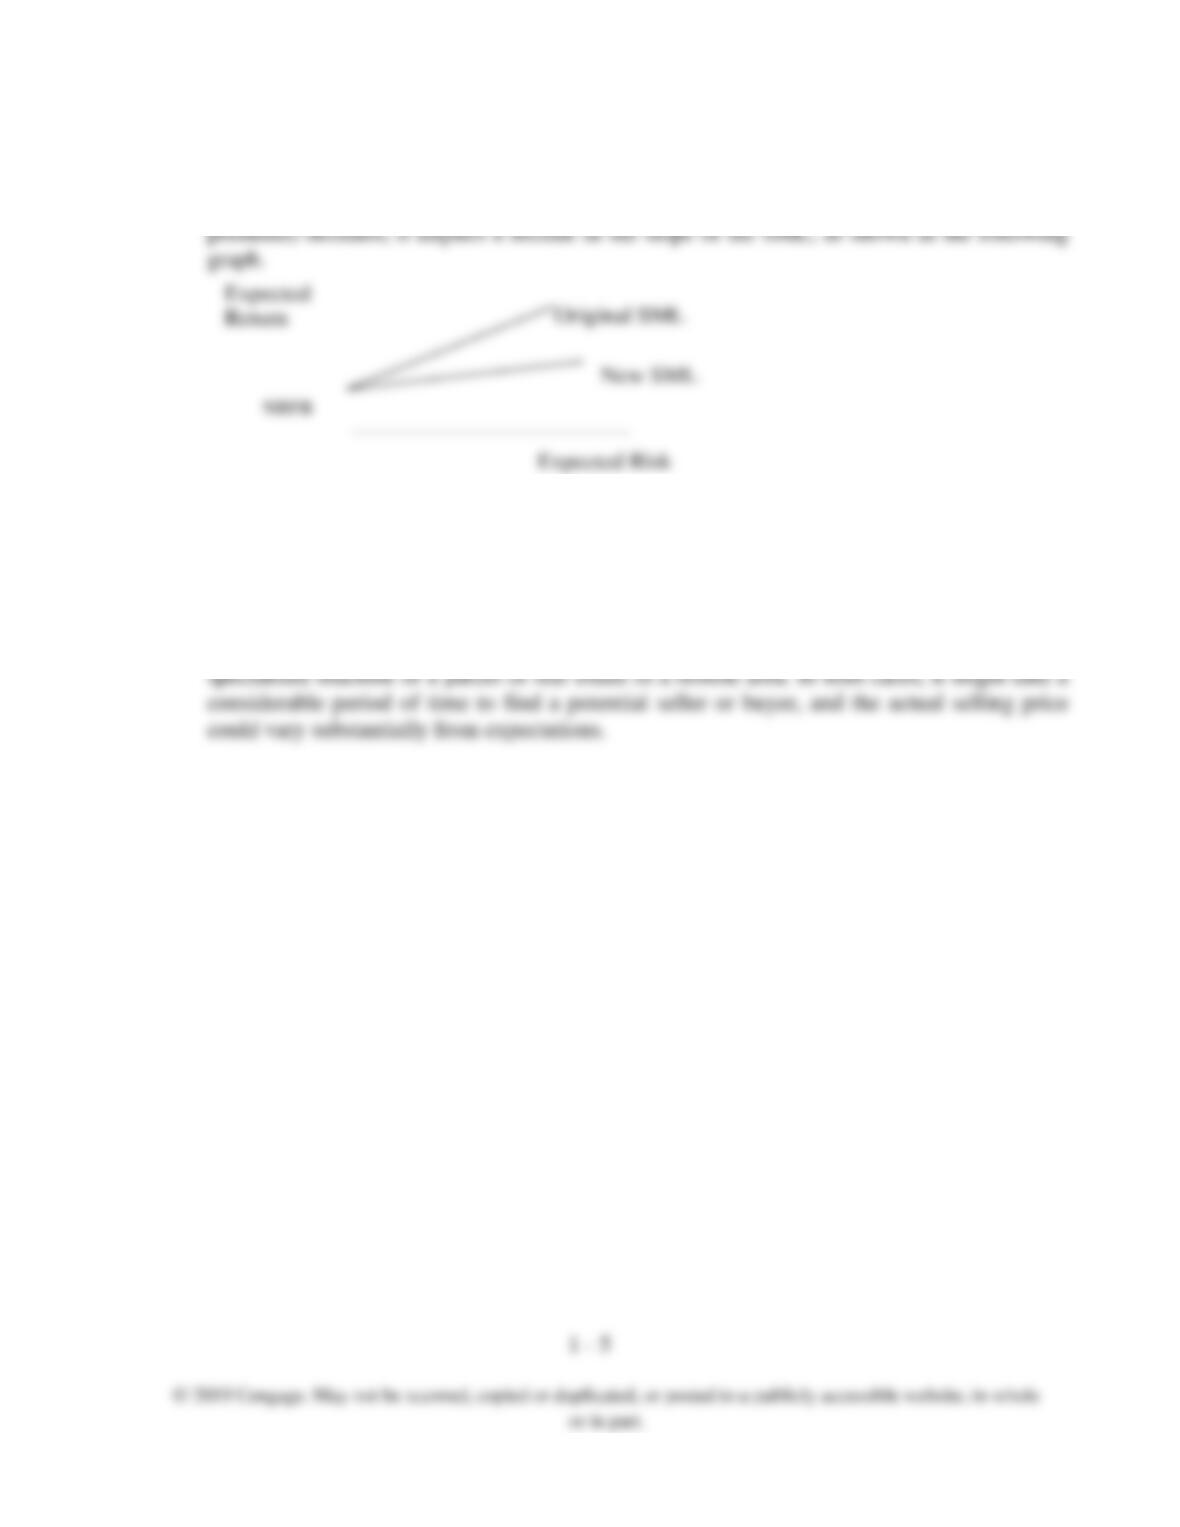
4. The saving-borrowing pattern would vary by profession to the extent that compensation
patterns vary by profession. For most white-collar professions (for example, lawyers),
5. The difference is because of the definition and measurement of return. In the case of the
1 –
2
© 2019 Cengage. May not be scanned, copied or duplicated, or posted to a publicly accessible website, in whole
or in part.
WSJ, they are only referring to the current dividend yield on common stocks versus the
promised yield on bonds. In the University of Chicago studies, they are talking about the
total rate of return on common stocks, which is the dividend yield plus the capital gain or
loss yield during the period. In the long run, the dividend yield has been 4–5 percent, and
the capital gain yield has averaged about the same. Therefore, it is important to compare
alternative investments based upon total return.
6. The variance of expected returns represents a measure of the dispersion of actual returns
around the expected value. The larger the variance is, everything else remaining constant,
7. An investor’s required rate of return is a function of the economy’s risk free rate (RFR),
an inflation premium that compensates the investor for loss of purchasing power, and a
risk premium that compensates the investor for taking the risk. The RFR is the pure time
value of money and is the compensation an individual demands for deferring
8. Three factors that influence the nominal RFR are the real growth rate of the economy,
liquidity (i.e., supply and demand for capital in the economy), and the expected rate of
inflation. Obviously, the influence of liquidity on the RFR is an inverse relationship,
9. The five factors that influence the risk premium on an investment are business risk,
financial risk, liquidity risk, exchange rate risk, and country risk.
Business risk is a function of sales volatility and operating leverage, and the combined
effect of the two variables can be quantified in terms of the coefficient of variation of
10. The increased use of debt increases the fixed interest payment. Since this fixed
11. According to the Capital Asset Pricing Model, all securities are located on the Security
Market Line, with securities’ risk on the horizontal axis and securities’ expected return on
the vertical axis. As to the locations of the five types of investments on the line, the U.S.
government bonds should be located to the left of the other four, followed by United
12. If a market’s real RFR is, say, 3 percent, the investor will require a 3 percent return on an
investment because this will compensate him for deferring consumption. However, if the
13. Both changes cause an increase in the required return on all investments. Specifically, an
increase in the real growth rate will cause an increase in the economy’s RFR because of a
higher level of investment opportunities. In addition, the increase in the rate of inflation will
Low Grade Corporate Bonds
UK Government Bonds
US Government Bonds
Common Stock of Japanese Firms
Common Stock of Large Firms
Expected Return
SML
NRFR
Expected Risk
14. Such a change in the yield spread would imply a change in the market risk premium
because, although the risk levels of bonds remain relatively constant, investors have changed
the spreads they demand to accept this risk. In this case, because the yield spread (risk
15. The ability to buy or sell an investment quickly without a substantial price concession is
known as liquidity. An example of a liquid investment asset would be a United States
Government Treasury Bill. A Treasury bill can be bought or sold in minutes at a price
almost identical to the quoted price. In contrast, an example of an illiquid asset would be a
Expected
Return
RFR
Expected Risk
Original SML
New SML
NRFR

1 –
6
CHAPTER 1
Answers to Problems
3. $4,000 used to purchase 80 shares = $50 per share
For Problem #1: HPR = 1.191
19.1% .191 1 – 1.191 1 – HPR HPY
191.1
34
50.40
34
1.50 39
Investment of Value Beginning
Flows)Cash (including Investment of Value Ending
HPR .1
====
==
+
=
=
1.5%– .015– 1 – .985 1 – HPR HPY
985.
65
64
65
3 61
HPR 2.
====
−==
+
=
28% .280 1 – 1.280 1 – HPR HPY
280.1
000,4
120,5
000,4
400720,4
000,4
80) x (5 80) x (59
HPR
====
==
+
=
+
=
18% .180 1 – 1.180 Alone) Increase (Price HPY
180.1
000,4
720,4
4,000
80 x 59
Alone) Increase (Price HPR
===
===
1
Inflation of Rate1
Return Period Holding
Return of Rate Real““ 4. −
+
=
%3.10103.1103.11
08.1
191.1
1
.081
1.191
:inflation 8%at
%5.14145.1145.11
04.1
191.1
1
.04 1
1.191
:inflation 4%at
==−=−=−
+
==−=−=−
+

© 2019 Cengage. May not be scanned, copied or duplicated, or posted to a publicly accessible website, in whole
For Problem #2: HPR = .985
For Problem #3: HPR = 1.280
Stock T is more desirable because the arithmetic mean annual rate of return is higher.
%8.8088.1912.1
1.08
.985
:inflation 8%at
%3.5053.1947.1
1.04
.985
:inflation 4%at
−=−=−=−
−=−=−=−
%5.18185.1185.11
1.08
1.280
:inflation 8%at
%1.23231.1231.11
1.04
1.280
:inflation 4%at
==−=−
==−=−
016.
5
.08
5
)04(.)02(.)09.()03(.)08(.
AM
054.
5
.27
5
)15(.)03.()12.()08(.)19(.
AM
n
HPY
(AM)Mean cArithemeti a).(5
B
T
i
n
1i
==
++−++
=
==
+−+−++
=
=
=
11467.01314.
01315.5/06574.
06574.
00922.00706.03028.00068.01850.
)054.15(.)054.03.()054.12.()054.08(.)054.19(.
T
2
22222
T
==
==
=
++++=
−+−−+−−+−+−=
Variance
=
−=
n
1i
2
ii /)]E(RR[ )(Deviation Standard 5(b). n

By this measure, B would be preferable.
5(d). Geometric Mean (GM) = 1/n – 1
where = Product of the HRs
GMT = [(1.19) (1.08) (.88) (.97) (1.15)]1/5 -1
6. E(RMBC) = (.30) (-.10) + (.10) (0.00) + (.30) (.10) + (.30) (.25)
7. E(RLCC) = (.05) (-.60) + (.20) (-.30) + (.10) (-.10) + (.30) (.20) + (.20) (.40) + (.15) (.80)
8. Lauren’s range of possible returns is much wider ranging from -0.60 to 0.80 compared to
05681.00323.
00323.5/01614.
01614.
00058.00002.01124.00020.00410.
)016.04(.)016.02(.)016.09.()016.03(.)016.08(.
B
2
22222
B
==
==
=
++++=
−+−+−−+−+−=
5513.3
016.
05682.
CV
123.2
054.
11466.
CV
Return Expected
Deviation Standard
Variation oft Coefficien c).(5
B
T
==
==
=
1 –
9
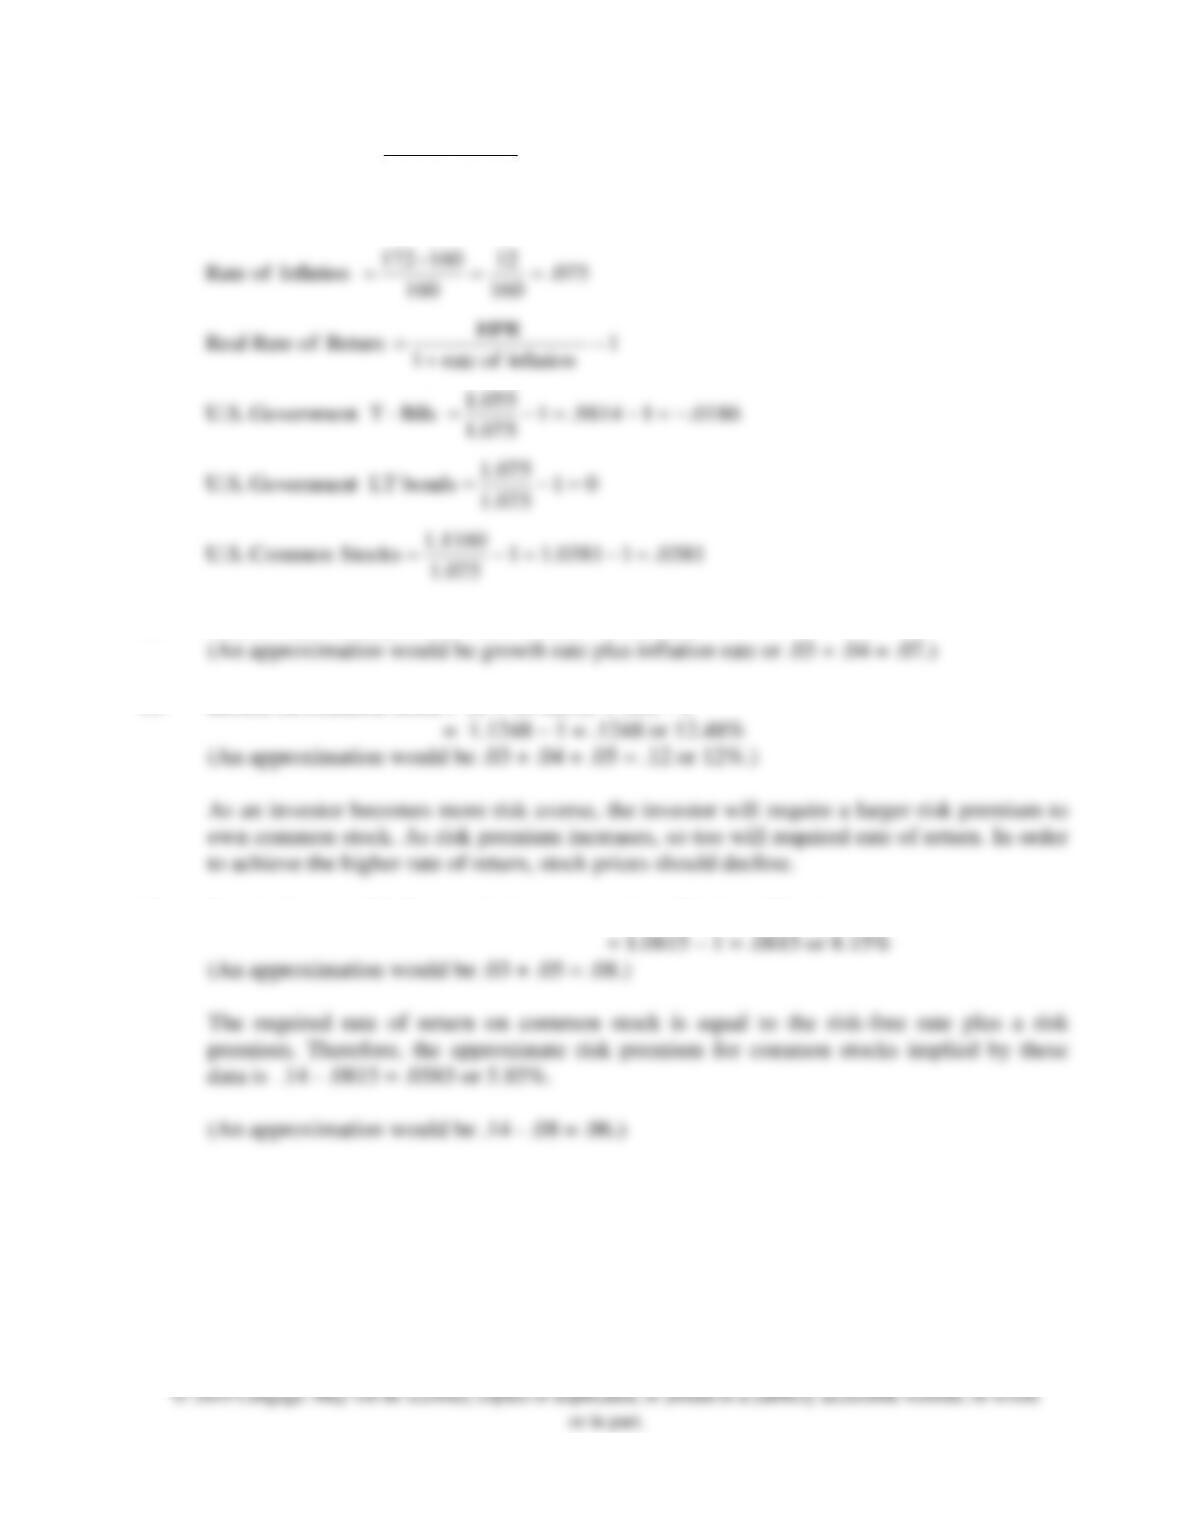
10. NRFR = (1 + .03) (1 + .04) – 1 = 1.0712 – 1 = .0712
11. Return on common stock = (1 + .0712) (1 + .05) – 1
12. Nominal rate on T-bills (or risk-free rate) = (1 + .03) (1 + .05) – 1
0381.10381.11
1.075
1.1160
StocksCommon U.S.
01
1.075
1.075
bonds LT Government U.S.
0186.19814.1
1.075
1.055
Bills–T Government U.S.
1
inflation of rate1
HPR
Return of Rate Real
075.
160
12
160
160–172
Inflation of Rate
Index PriceConsumer the CPI where
CPI
CPI CPI
Inflation of Rate .9
n
n1n
=−=−=
=−=
−=−=−=
−
+
=
===
=
−
=+

1 –
10
APPENDIX 1
Answers to Problems
1(a). Expected Return = (Probability of Return)(Possible Return)
1(b). Standard deviation can be used as a good measure of relative risk between two investments
1(c). The coefficient of variation must be used to measure the relative variability of two
2(a). E(RKCC) = (.15)(-.60) + (.10)(-.30) + (.05)(-.10) + (.40)(.20) + (.20)(.40) + (.10)(.80)
= (-.09) + (-.03) + (-.005) + .08 + .08 + .08 = .115
= .07668 + .01722 + .00231 + .00288 + .01624 + .04692
128.0164.σ
0164.0079.0003.0008.0074.)0315)(.25(.)0008)(.35(.)0053)(.15(.)02976)(.25(. )0725.25)(.25(.)0725.10)(.35(.)0725.00.0)(15(.)0725.100.)(25(.
)]E(RR[P
)0725(. )0625(.)035(.)000(.)025.( )25)(.25(.)10)(.35(.)00.0)(15(.)10.)(25(.
]R[P)E(R
GDC
2222
2
iii
n
1i
2
ii
n
1i
GDC
==
=
+++=
+++=
−+−+−+−−=
−=
=
+++−=
+++−=
=
=
=
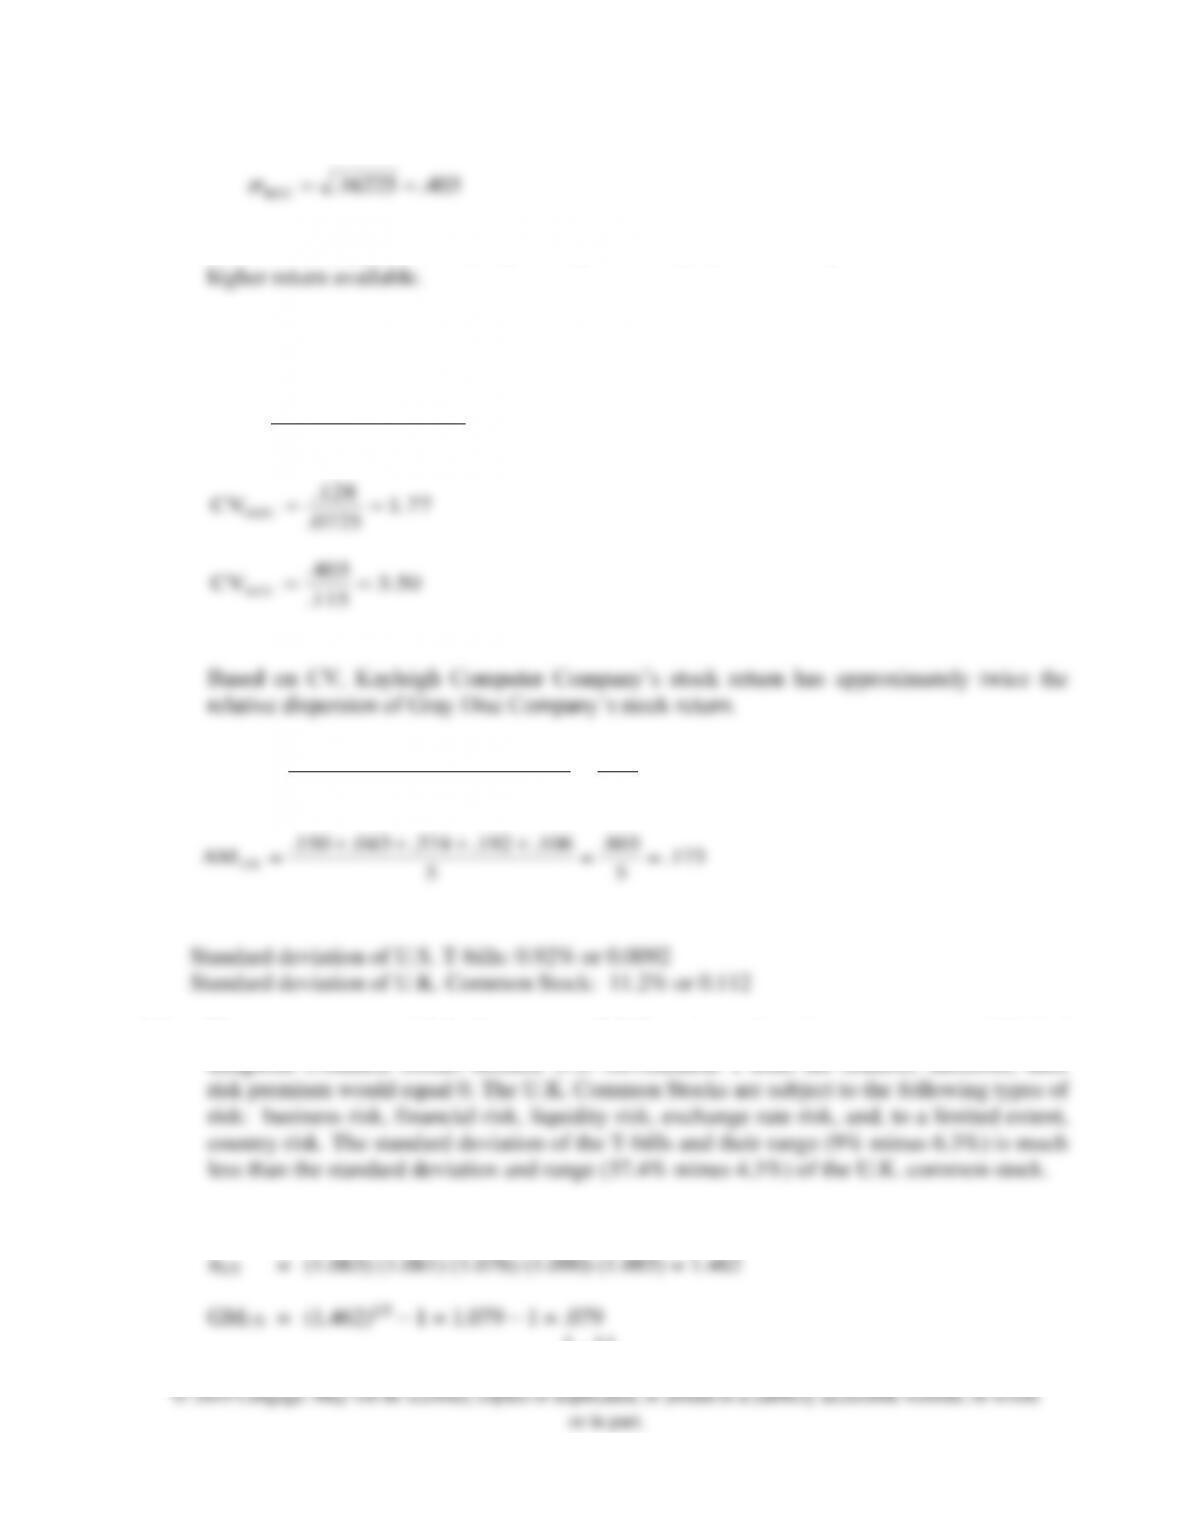
2(b). Based on [E(Ri)] alone, Kayleigh Computer Company’s stock is preferable because of the
2(c). Based on standard deviation alone, the Gray Disc Company’s stock is preferable because of
the likelihood of obtaining the expected return because it has a lower standard deviation.
3(b). The average return of U.S. Government T-Bills is lower than the average return of United
Kingdom Common Stocks because U.S. Government T-Bills are riskless; therefore, their
3(c). GM = 1/n – 1
403.16225.
KCC ==
50.3
115.
403.
CV
77.1
0725.
128.
CV
Return Expected
Deviation Standard
CV 2(d).
KCC
GDC
==
==
=
173.
5
865.
5
106.192.374.043.150.
AM
079.
5
395.
5
085.090.076.081.063.
AM 3(a).
UK
US
==
++++
=
==
++++
=

1 –
12