QUESTIONS Introduction II Geologic Hazards
1. Give the definition of a geologic hazard (in your own words or that provided in the Introduction). A
2. List 5 geologic hazards.
3. What types of hazards have been omitted from this book?
4. Can human activity induce a geologic hazard? ____ Explain your answer.
5. a. How many “Key Concepts about Geologic Hazards” are listed in the Introduction?
6. a. From Figure II.1, which geologic process or hazards map would be the most useful for delineating
tectonic plate boundaries?
7. Briefly explain Will Durant’s statement at the beginning of the Introduction.
Students may answer as they wish, but the statement should include some recognition that major events,
such as earthquakes, can change almost everything about the habitability of a place. The lasting impacts of
Hurricane Katrina on New Orleans might serve as a starting place for a discussion of the introductory
Figure II.2 is a map of the United States that identifies some of the more common hazardous geologic
events in each state.
Questions 1 through 8 are site specific for the location of each student’s home or school. Therefore no
specific answers are provided here. Note that the Lb in Iowa should be an Ls.
1. a. What is your home state? ____
2. Do you think that you personally live in an area of the state that is subject to these hazards? Why or
why not? If so, which hazards?
4. In 1811 and 1812, a series of major earthquakes in New Madrid, Missouri (near the southeastern corner of
Missouri) rang church bells along the east coast.
5. From December 24, 1964 through March 3, 2007, how many PDDs were there in your county?
6. From your knowledge, does the number of PDDs correspond or not with the number of potentially
hazardous geologic events in your county?
9. Figure II.4 (also in the colored plates section) is a map of population densities.
a. Describe what, if any, relationship exists between disaster declarations shown on Figure II.3 and
population density shown on Figure II.4.
In general, there are more disaster declarations where population density is greater.
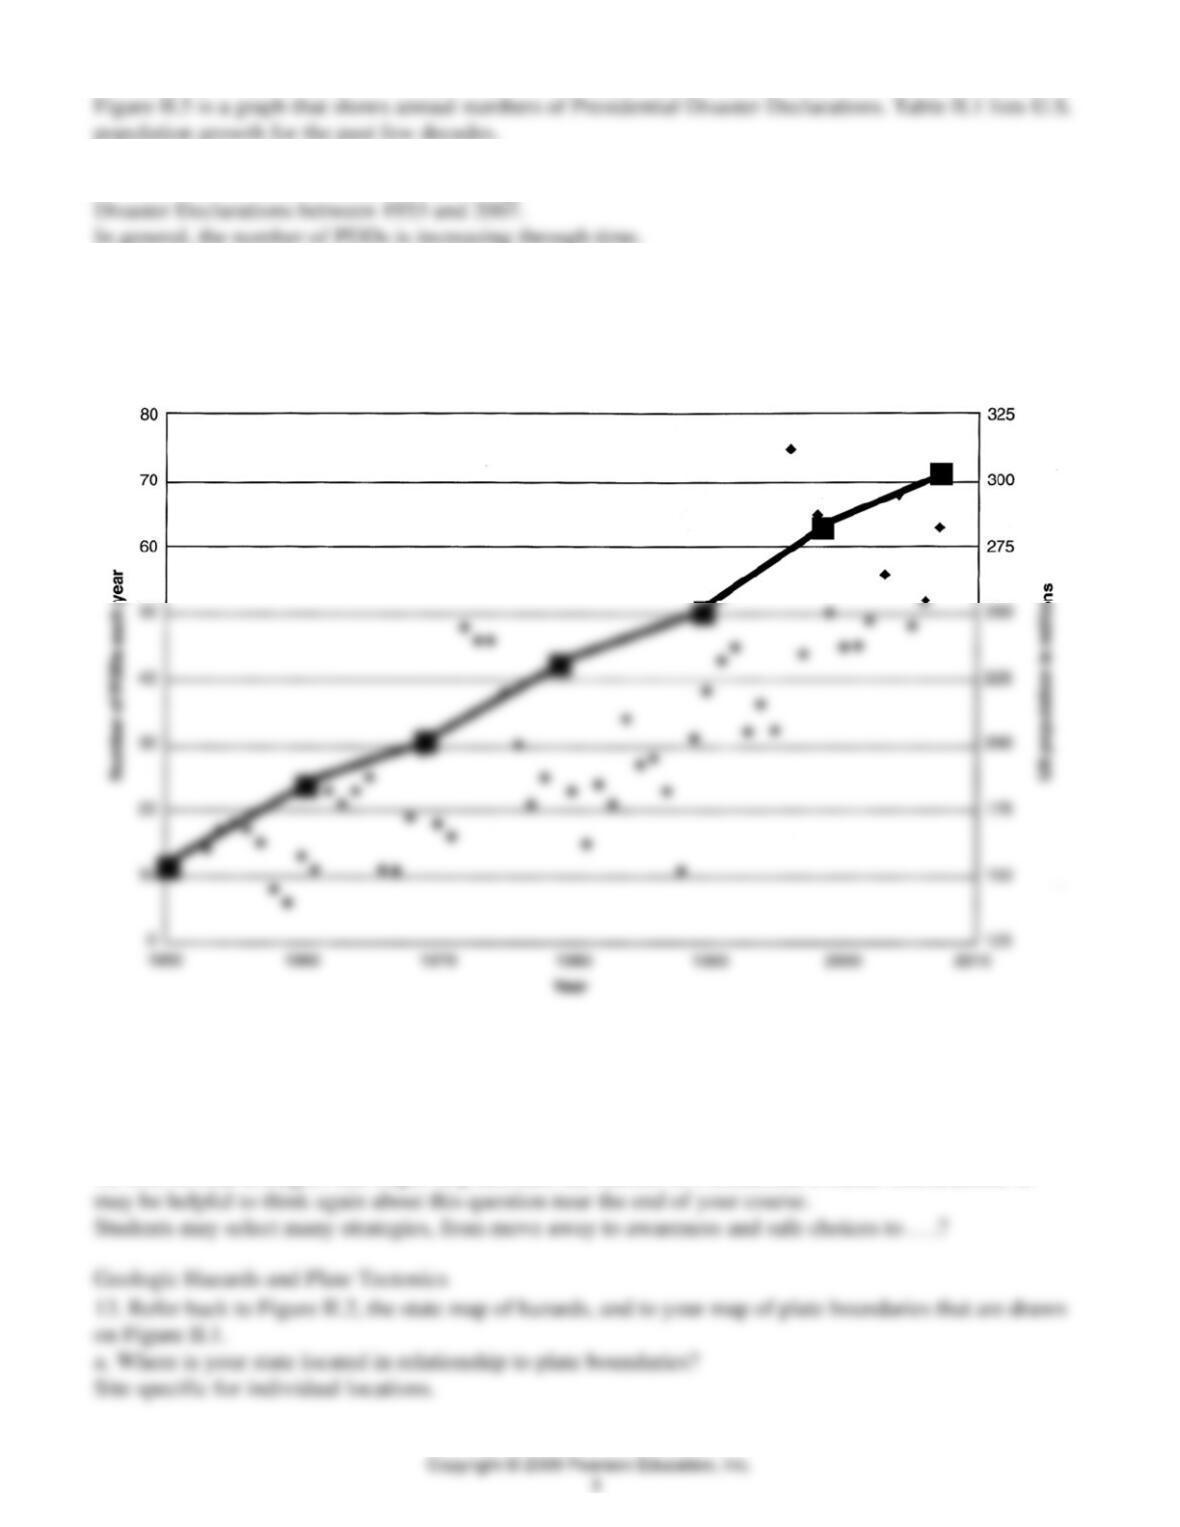
10. Describe the trend (increasing, decreasing, or similar terms) of the annual number of Presidential
11. Refer to the data in Table II.1. Use the scale on the right side of the graph and plot these points on the
graph. Draw a line that connects the points you placed on the graph. What is the correlation between the
number of Presidential Disaster Declarations and population growth?
See the graph below. Population and PDDs appear to increase together.
Figure II.5. Annual number of Presidential Disaster Declarations (PDDs), 1953–2007. Note that the data
for 2007 are incomplete.
Disaster declaration data from http://www.fema.gov/news/disasters_totals_annual.fema (downloaded
September 14, 2007). Population data from http://www.census.gov.
12. List several strategies that might help decrease the number of Presidential Disaster Declarations. It
b. What geologic hazards are more typically found near plate boundaries?
Earthquakes and volcanoes are typically found more often near plate boundaries.
c. What hazards are found typically away from plate boundaries?
14. Refer back to Figure II.3, the map of Presidential Disaster Declarations, and to your map of plate
boundaries. Describe and explain the relationship, if any, of PDDs with plate boundaries. For example, is
the number of PDDs near plate boundaries greater, about the same, or lower than the number of PDDs
away from plate boundaries?