67
Geochemical Evolution
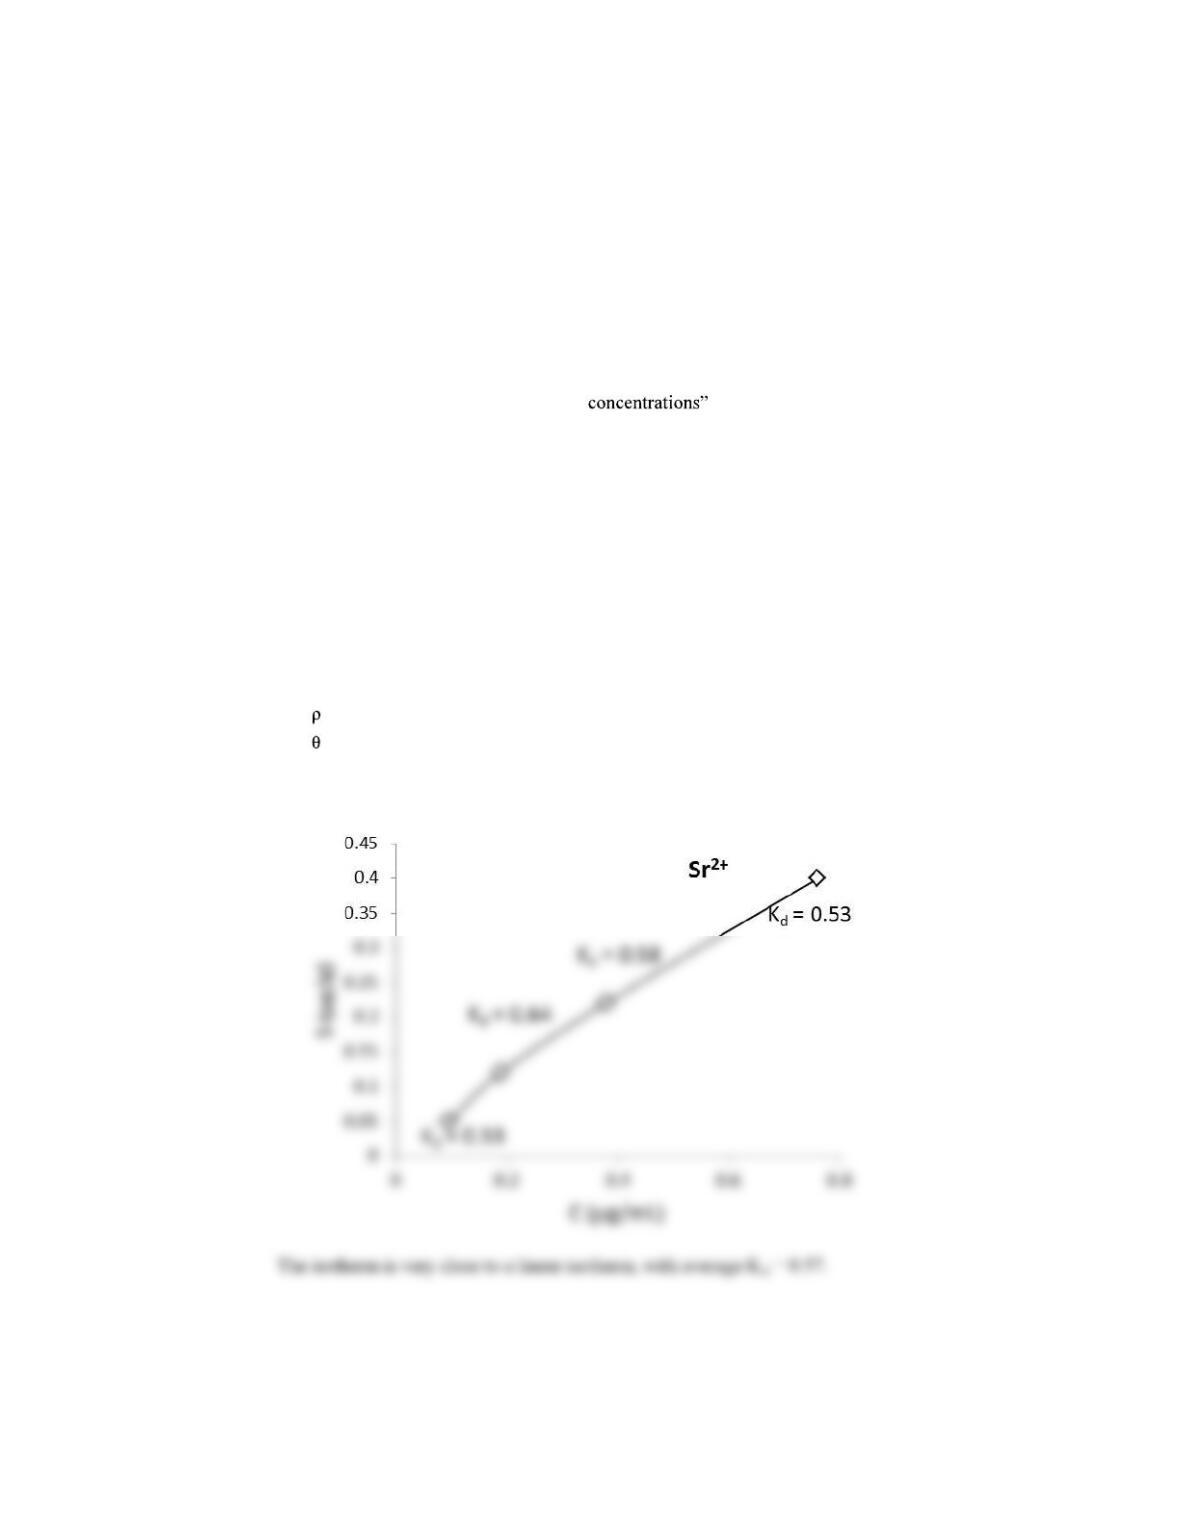
1. The following data were produced from batch tests to test the sorption of Sr2+ on a clay till. For the
experiment, 100 g of clay till was used with 1 L water with different initial concentrations of Sr2+.
Calculate the amount of Sr2+ sorbed from the initial and final concentration data and plot the isotherm.
Describe the isotherm that you plotted and calculate Kd for each batch step. What is the retardation
factor at low Sr2+ concentrations and at high Sr2+
C
final
(mg/L) 0.095
0.188
0.378
0.76
C
initial
(mg/L) 0.1
0.2
0.4
0.8
mg 0.005
0.012
0.022
0.04
mg/g 0.00005
0.00012
0.00022
0.0004
ug/g 0.05
0.12
0.22
0.4
K
d
(mL/g) 0.526316
0.638298
0.582011
0.526316
R 5.210526
5.851064
5.42328
5
2
2
2
2
0.25
0.25
0.25
0.25
The retardation factor needs values for bulk density (assume 2 g/cc) and porosity (0.25).
7
68
2. Write the two redox half reactions that define the upper and lower stability limits for water and give
the their values for G°r and K
½O2 + 2e + 2H+ H2O G°r = 237.14 kJ/mol
3. Write the two complementary redox half-reactions for the oxidation of methane with sulfate and with
ferrihydrite [Fe(OH)3 fer
favourable?
in Table 2.1 on page 42, and for a given reaction is equal to the sum
of free energies for all products (multiplied by their stoichiometric number) minus the sum of free
energies for the reactants.
SO4
2 + 8e + 10H+ H2S + 4H2O
CH4 + SO4
2 + 2H+ CO2 + H2S + 2H2O G°
r = 101.81 kJ/mol CH4
4. A groundwater was sampled from a confined aquifer. The temperature was measured at 25°C, and the
water had a pH of 8.15 and Eh of 0.27 V. The geochemical analysis for this water is as follows (in
mg/L):
Ca
2+
Mg
2+
Na
+
K
+
Fe
2+
HCO3
–
Cl
–
SO4
2
–
HS
–
DOC
68.71 0.34 95 5.7 <0.001
31.0 2.34 300 4.1 6.8
Calculate an Eh for this water from the sulfate/sulfide redox couple (don’t forget to use activities).
What is the calculated pe for this water? How does your calculated Eh compare with your
measured Eh? Write the geochemical reaction that seems to be buffering redox.
69
I = 0.01
0.60
0.88
a
0.00188
0.00011
pe = 4.22 + log pH = 4.79
Eh = 0.059 pe = 0.28 V
5. The oxidation of ammonium by O2 is an important reaction in soils and surface waters that releases
NO3 to the environment. Write a redox equation for the oxidation of ammonium ( G°NH4+ = 79.31
kJ/mol) to nitrate ( G°NO3 = 108.74 kJ/mol) and determine the pe – pH relationship that defines the
equilibrium for this redox pair at an ion activity ratio of 1 (i.e. for aNO3 / aNH4+ = 1).
NH4
+ + 2 O2 NO3 + H2O + 2H+
NH4
+ 3H2O NO3 + 8e + 10H+ G°r = 108.74 + 79.31 = 29.43 kJ/mol
70
6. Under hyperalkaline conditions, ferrous iron oxidation to ferric iron can proceed by the reduction of
water to H2. This can be shown by calculating the redox potential for Fe3+/Fe2+ and for H2O/H2 at pH
12. Which has the higher redox potential? Write an equation for this overall reaction.
From the Fe3+/Fe2+ redox pair, the pe pH line was resolved in Chapter 7 (page 230):
pe = 23.9 3pH and so at pH 12, pe is 12.1
7. The fractionation for deuterium between water and hydrogen gas in the Oman hyperalkaline
groundwaters (section H2O/H2 Reduction of Water) was used to determine the temperature of H2
production. Using the equation for this reaction in Table 4.2, calculate the temperature for the
serpentinization reaction.
For this question, the DH2O value for the hyperalkaline spring waters in Oman is needed, as is
DH2 for the hydrogen gas bubbling from the vent. These were not given but can be found
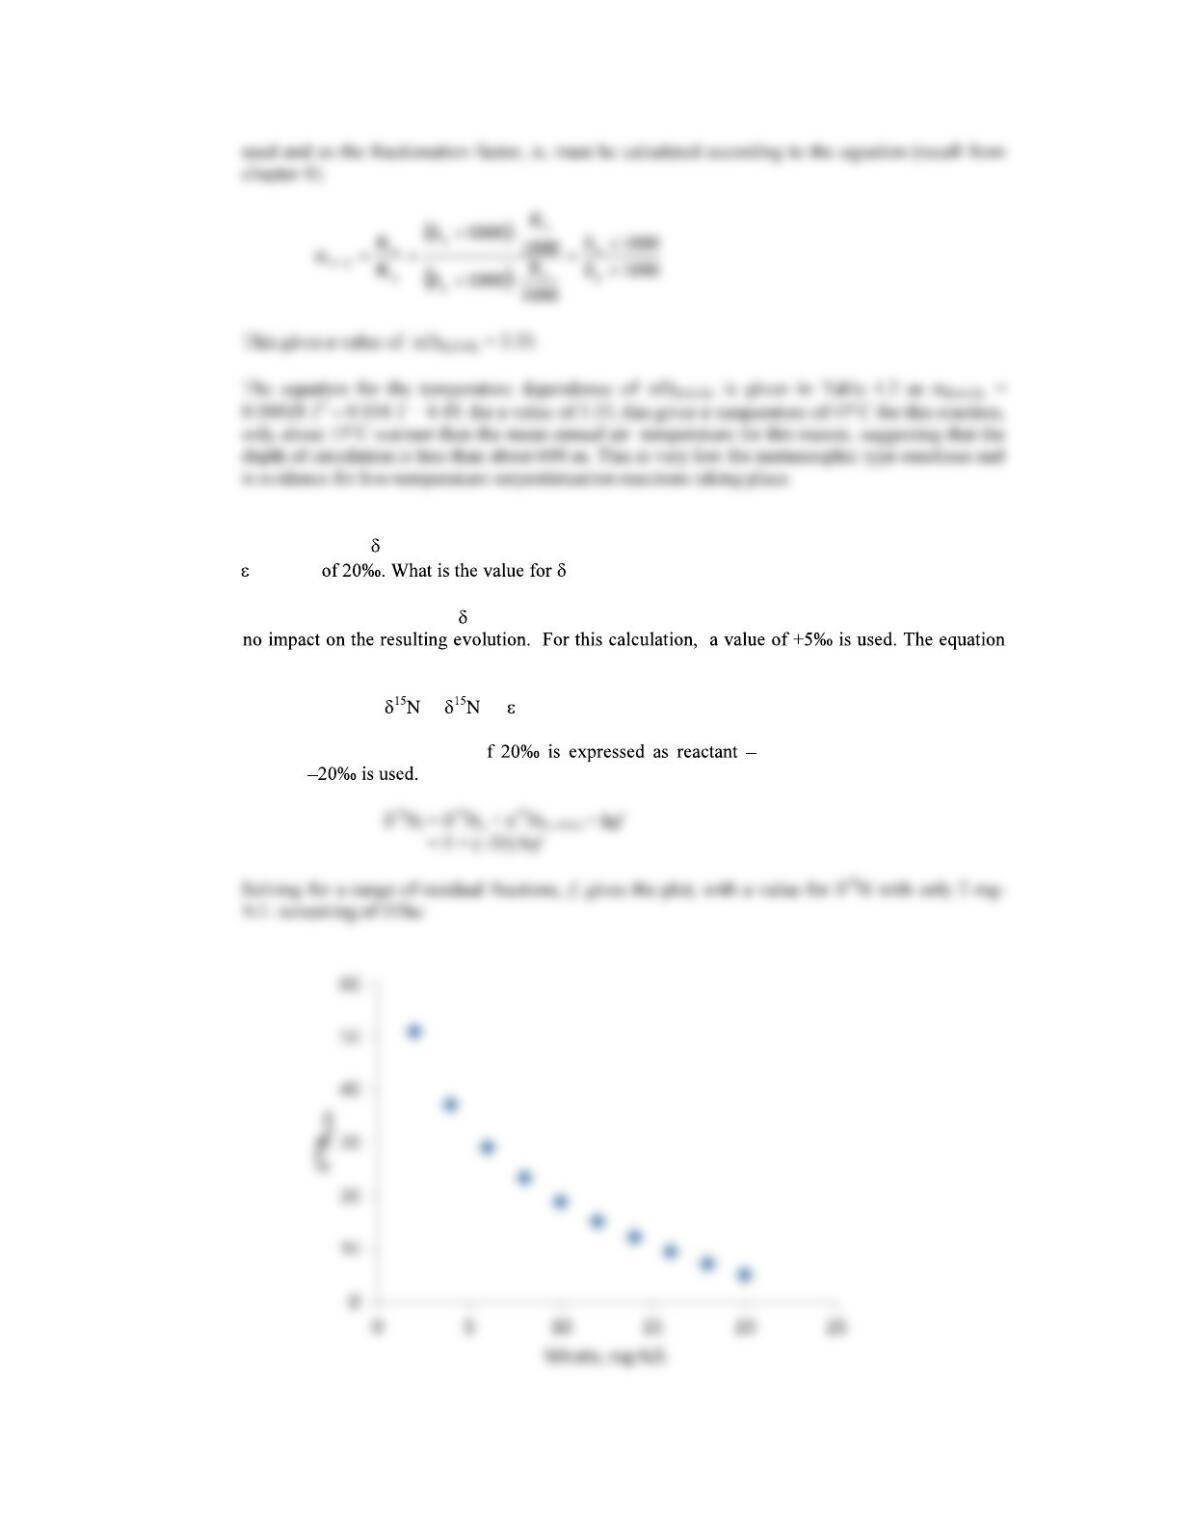
71
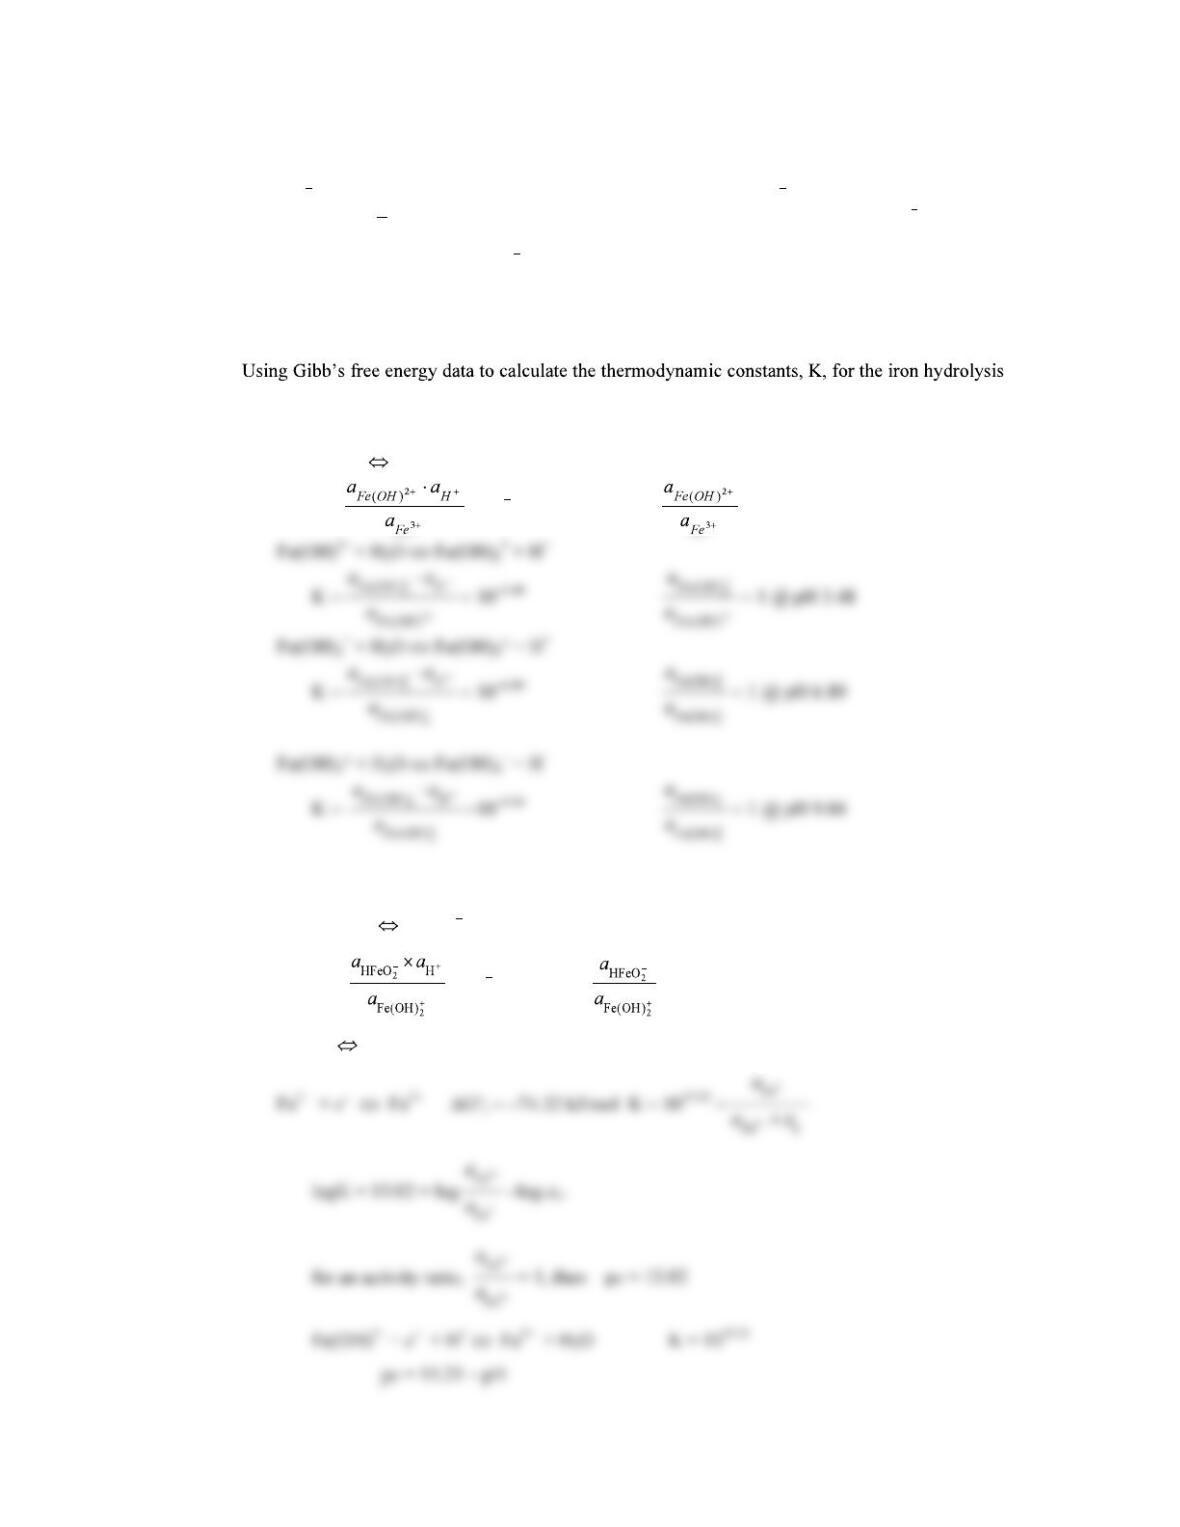
8. Plot the evolution of 15NNO3 during denitrification using an initial nitrate concentration of 20 mg-N/L
and 15NNO3-N2 15NNO3 at a residual nitrate concentration of 2 mg-N/L?
For this problem, an initial 15N value for the nitrate before denitrification can be chosen, but has
that defines the evolution is the modified Rayleigh distillation:
f = o + 15Nproduct-reactant × lnf
The given enrichment value o product (NO3– N2) and so the
inverse,
72
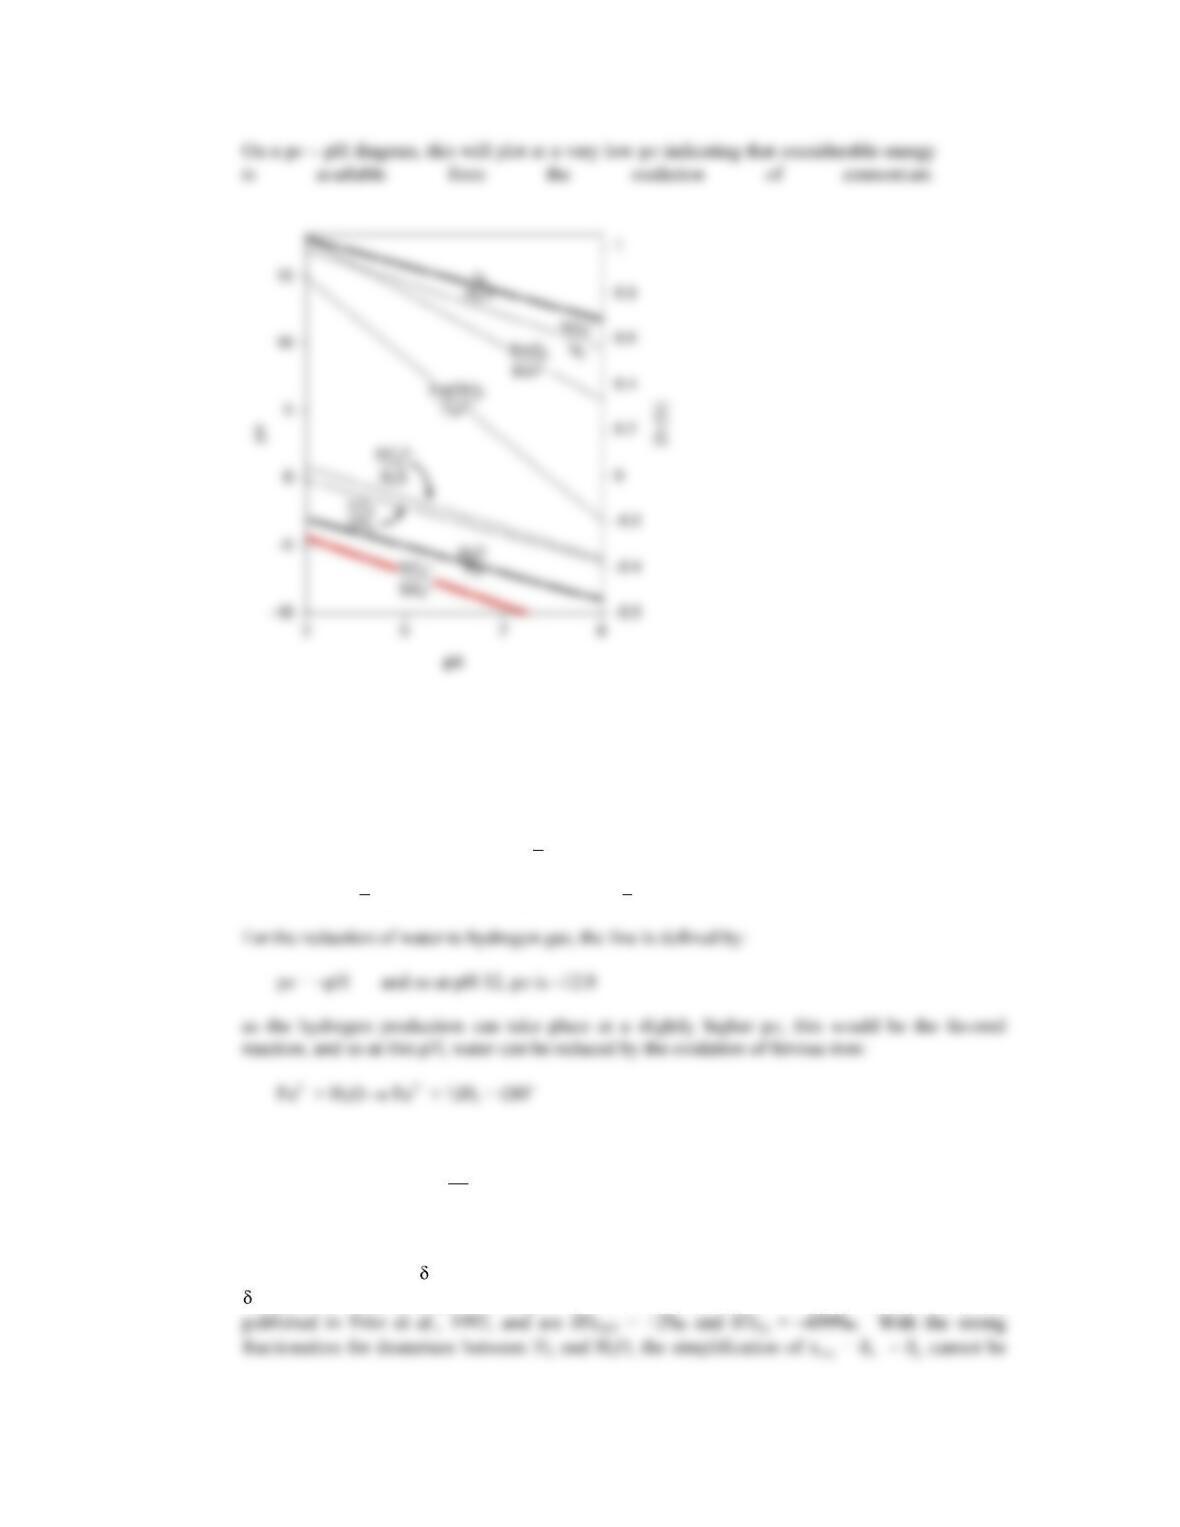
9. Figure 7.14 and associated equations show the speciation of ferric and ferrous iron. Write redox
equations for equilibrium between the various ferric iron species (Fe3+, Fe(OH)2+, Fe(OH)2
+, Fe(OH)3
°
and Fe(OH)4) and their neighboring ferrous iron species (Fe2+ and HFeO2) for the pH range of 1 to
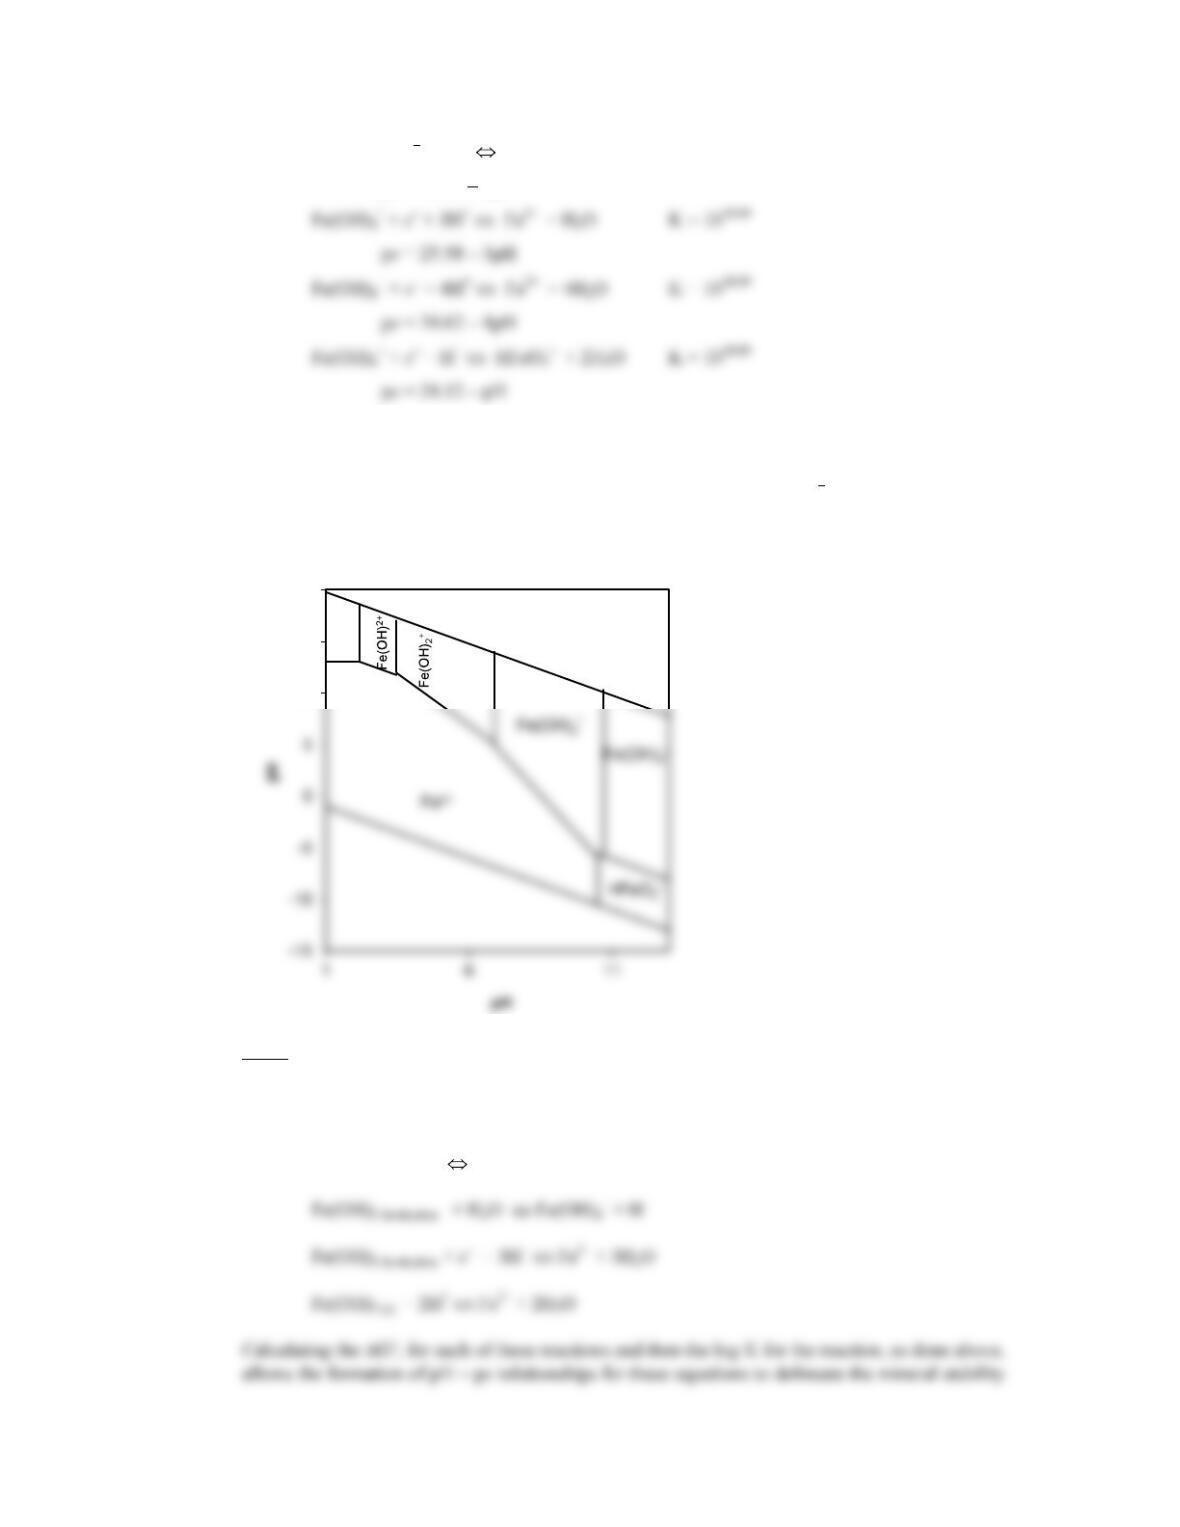
13. Plot these on a pe pH diagram, assuming the total dissolved Fe concentration to be 10 8.
At a total Fe concentration of 10 8 (0.00056 ppm), this is below the solubility of ferrihydrite
[Fe(OH)3 fer] and of Fe(OH)2 solid and so there will be no mineral phases on this diagram, only
fields for dissolved iron species. The borders between these fields will be defined by the redox and
hydrolysis reactions between all the relevant species. Under oxidizing conditions, these are:
reactions for oxidized and reduced iron:
Oxidized, FeIII
Fe3+ + H2O Fe(OH)2+ + H+
K = = 10 2.19 = 1 @ pH 2.19
Reduced, FeII
Fe2+ + 2H2O HFeO2 + H+
K = = 10 10.5 = 1 @ pH 10.5
Redox, FeIII FeII
73
Fe(OH)2
+ + e + 2H+ Fe2+ + 2H2O K = 1018.89
pe = 18.89 2pH
Plotting these lines, and selecting pe and pH values to allow the field division lines to
intersect gives the following graph of the stability fields for all the major oxidized and
reduced iron species. Note that this is for a total concentration of Fe of 10 8 mol/L which
is below the saturation concentration for ferrihydrite [Fe(OH)3 fer] or reduced iron
hydroxide [Fe(OH)2] known as green rust. Therefore, there is no field for these minerals
on this graph.
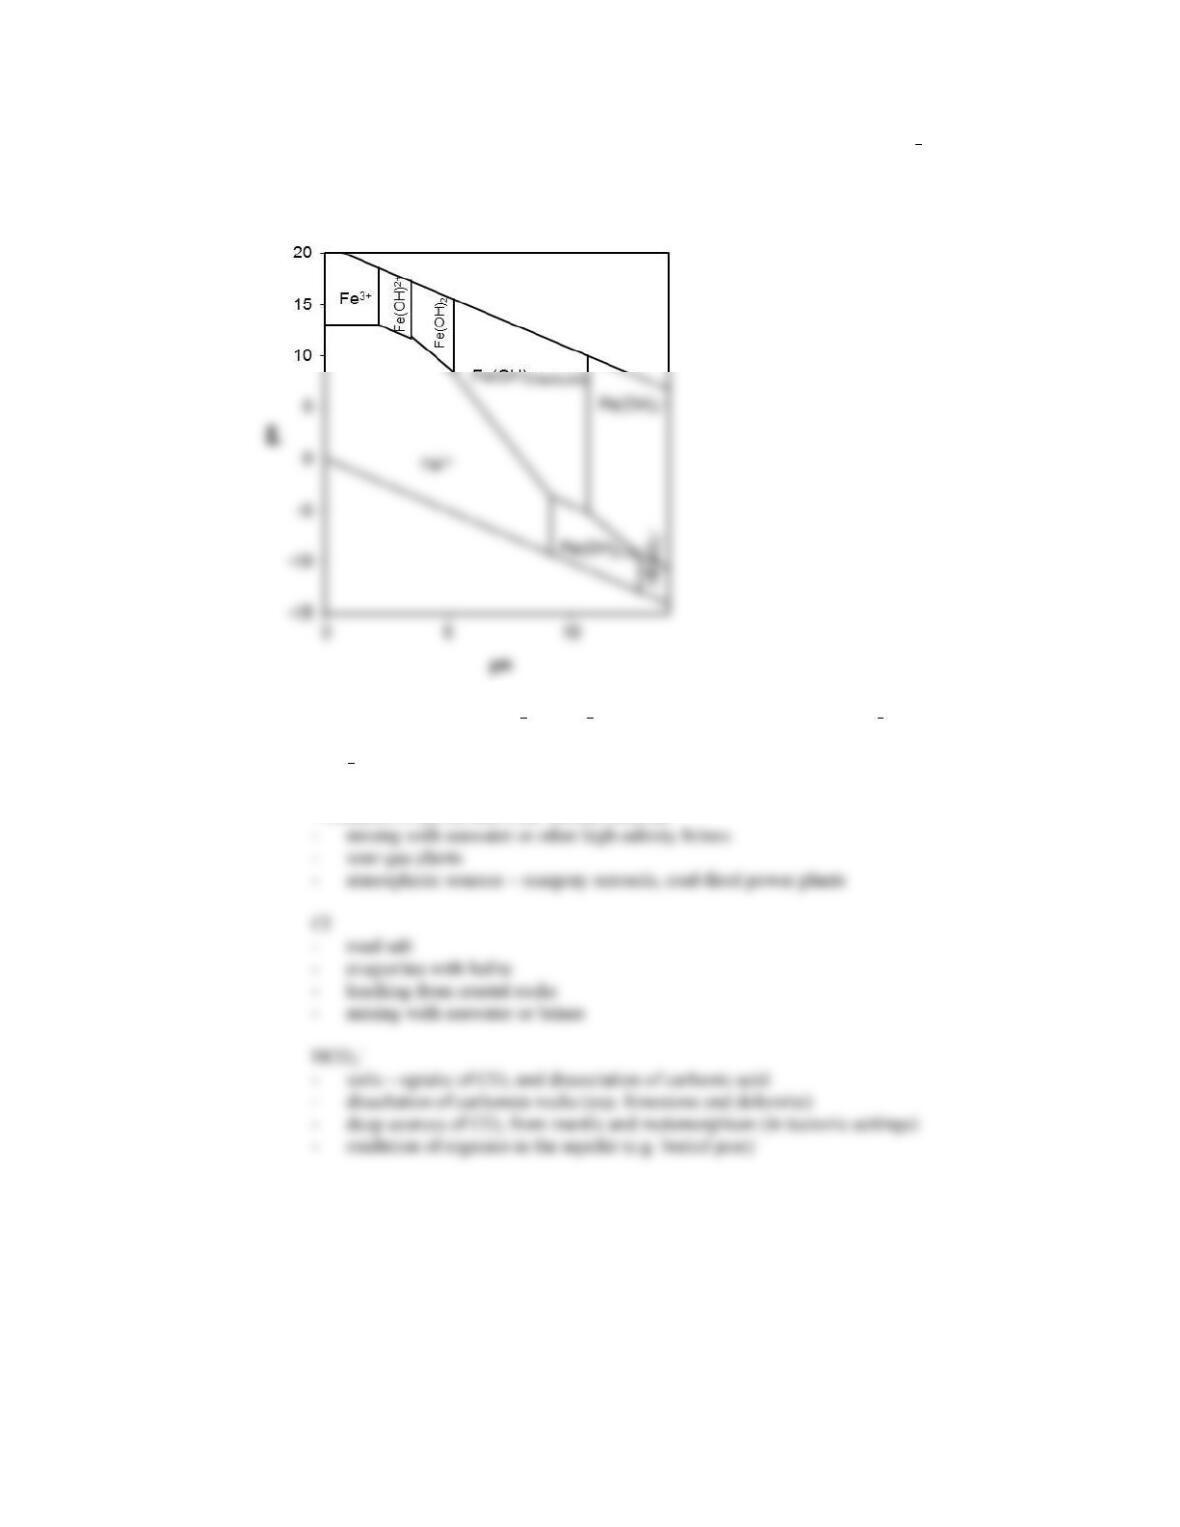
Using a concentration of iron that is high enough to have mineral saturation opens up
fields for these minerals. These fields are defined with the same approach, writing the
equations for equilibrium between these minerals and adjacent dissolved iron species,
such as:
Fe(OH)3 ferrihydrite Fe(OH)3°
10
15
20
Fe3+
74
fields which are in equilibrium with the dissolved phases at a total concentration of 10 6 molar, or
0.056 ppm, as shown in this diagram:
10. What are some potential sources of SO4
2 and Cl in groundwaters? What about HCO3?
SO4
2
– dissolution of gypsum and anhydrite
– oxidation of pyrite and other sulfide minerals