43
CO2 and Weathering
1. What are the activities of dissolved carbonate, aCO32, and carbonic acid, aH2CO3 for 25°C water with pH
7.8 and bicarbonate concentration of 86 ppm as HCO3 ? Assume that the bicarbonate activity is equal
to its molality. How much do they contribute to DIC?
aHCO3 = 0.0014 = 16.92 ppm C
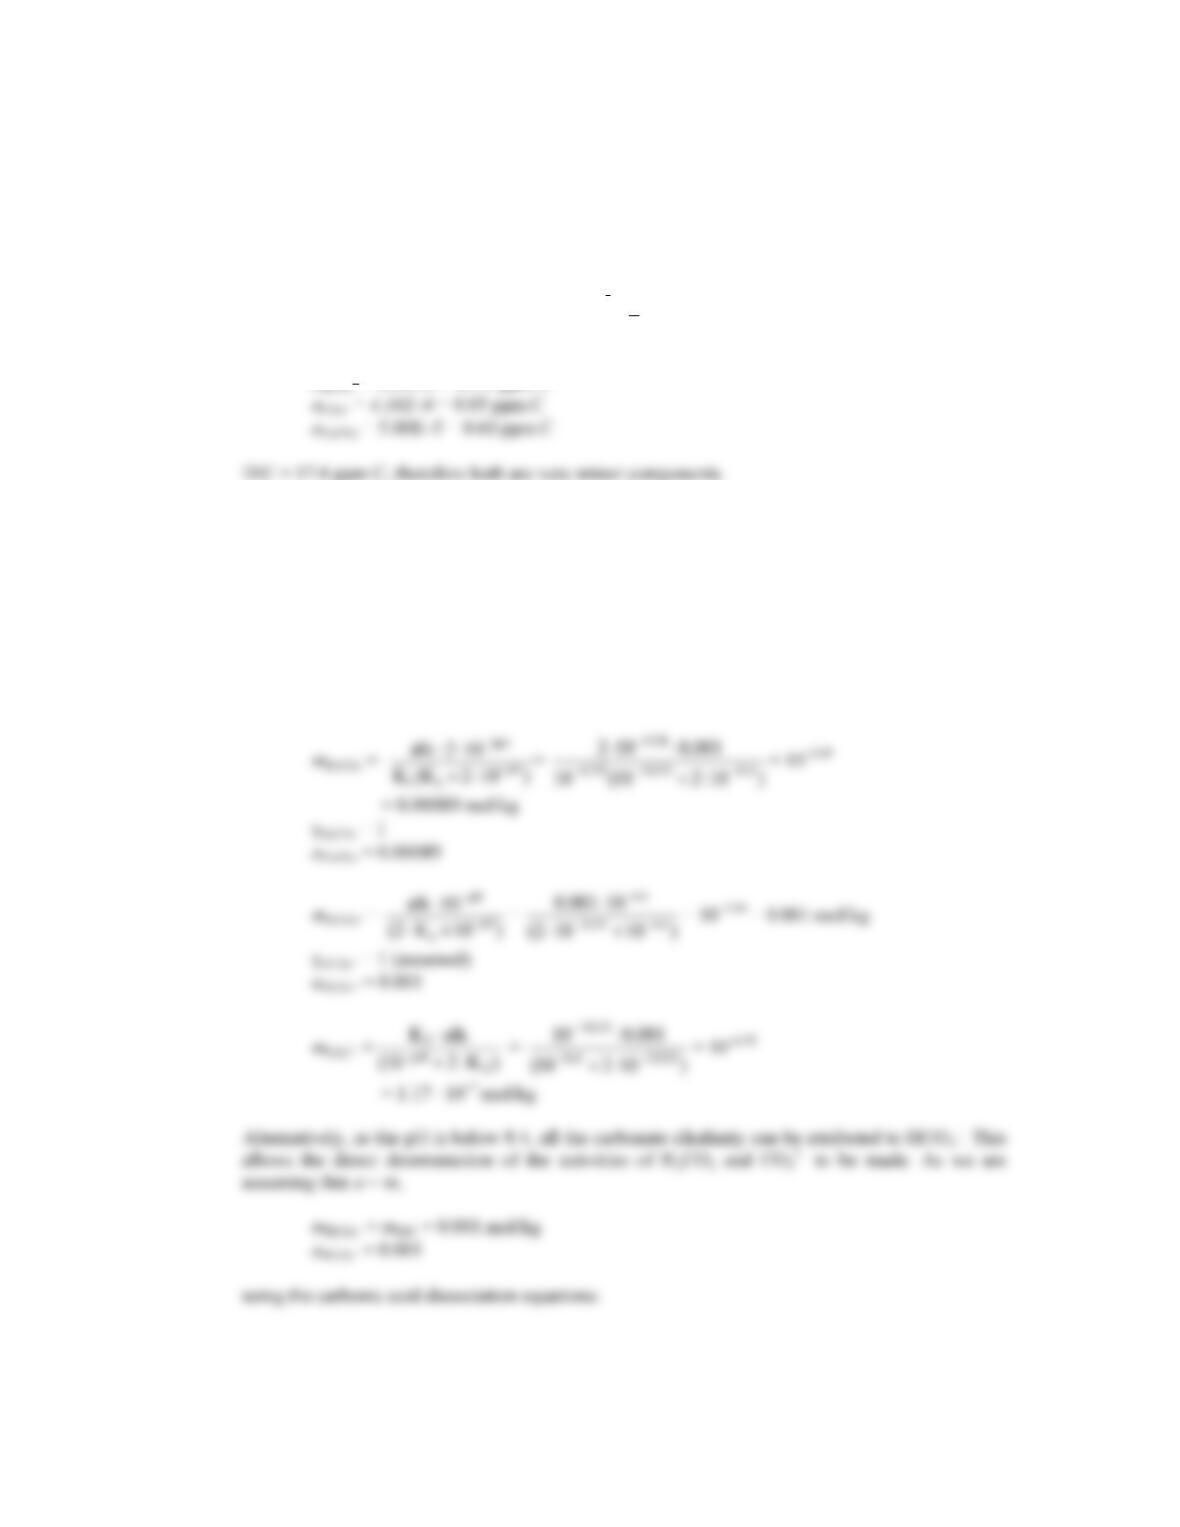
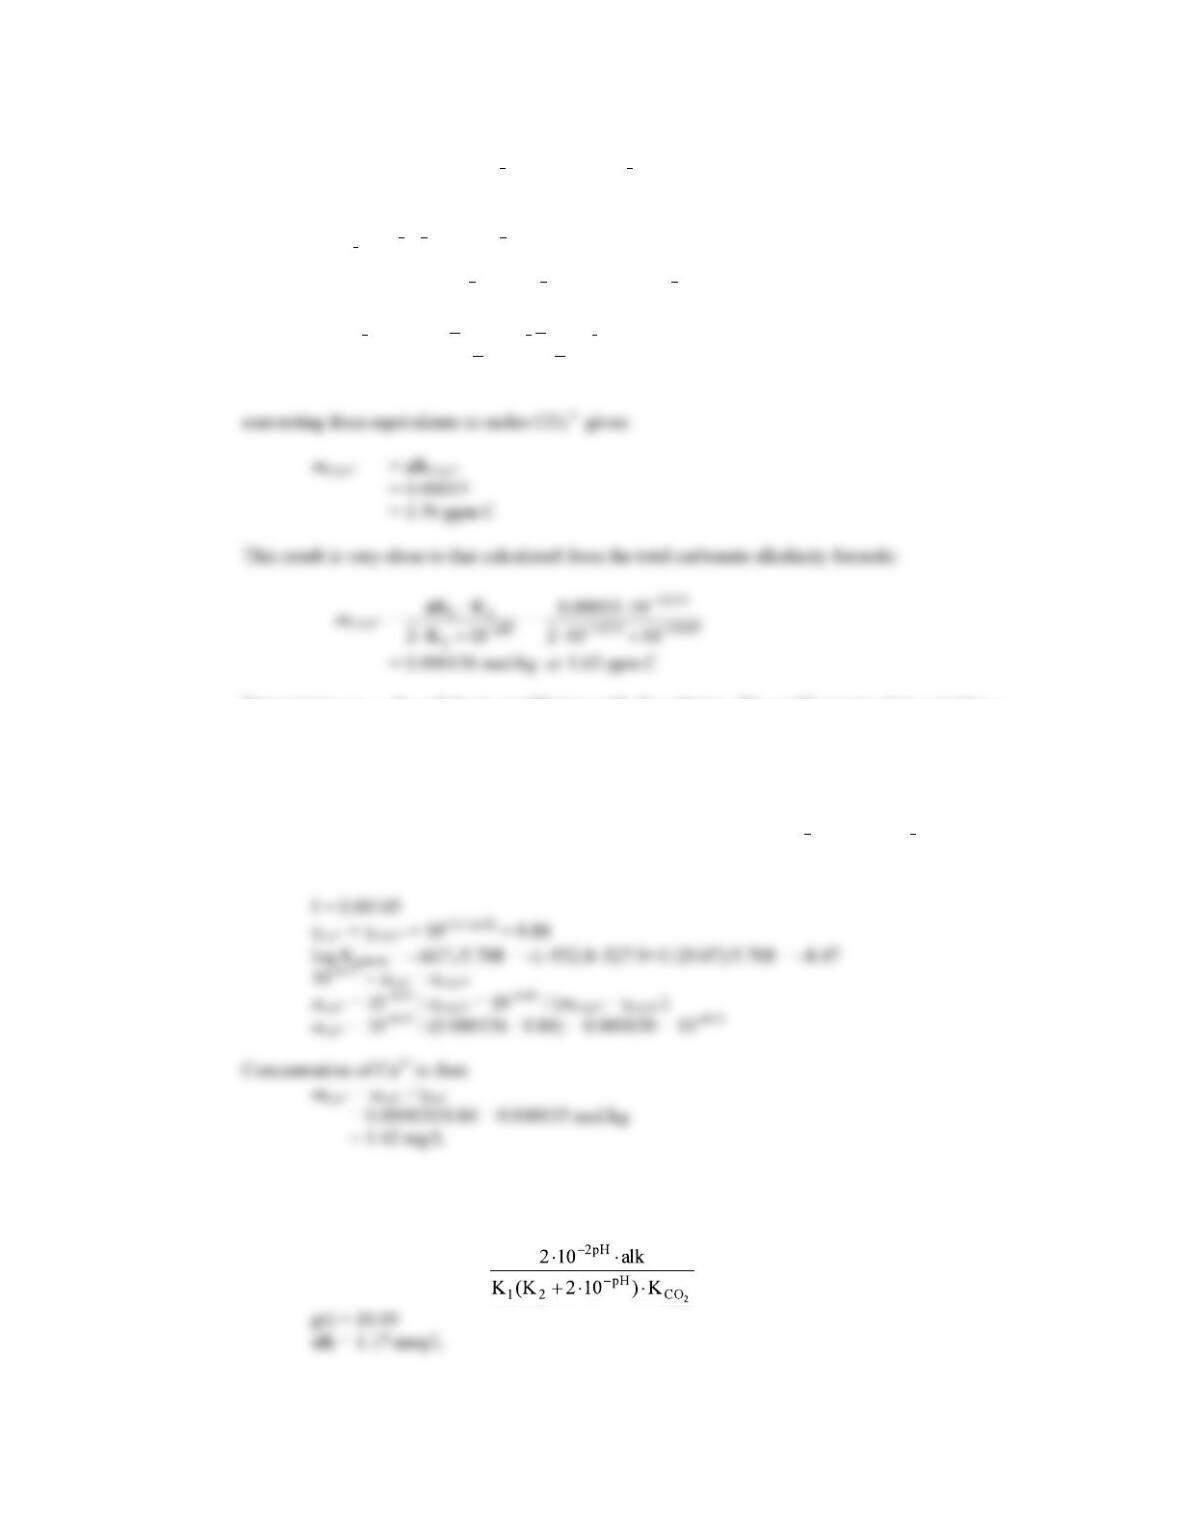
2. A shallow groundwater has a pH of 6.4 and a measured carbonate alkalinity of 1 meq/kg. What are the
activities of the DIC species, and what is the PCO2 of this water?
As there are no other solute concentrations given to calculate I, it can be assumed that activities =
concentrations.
The temperature is not specified, but equilibrium constants here are for 25°C. The molalities of the
DIC species can be calculated using the alkalinity formulas given in Example 6.7.
6
44
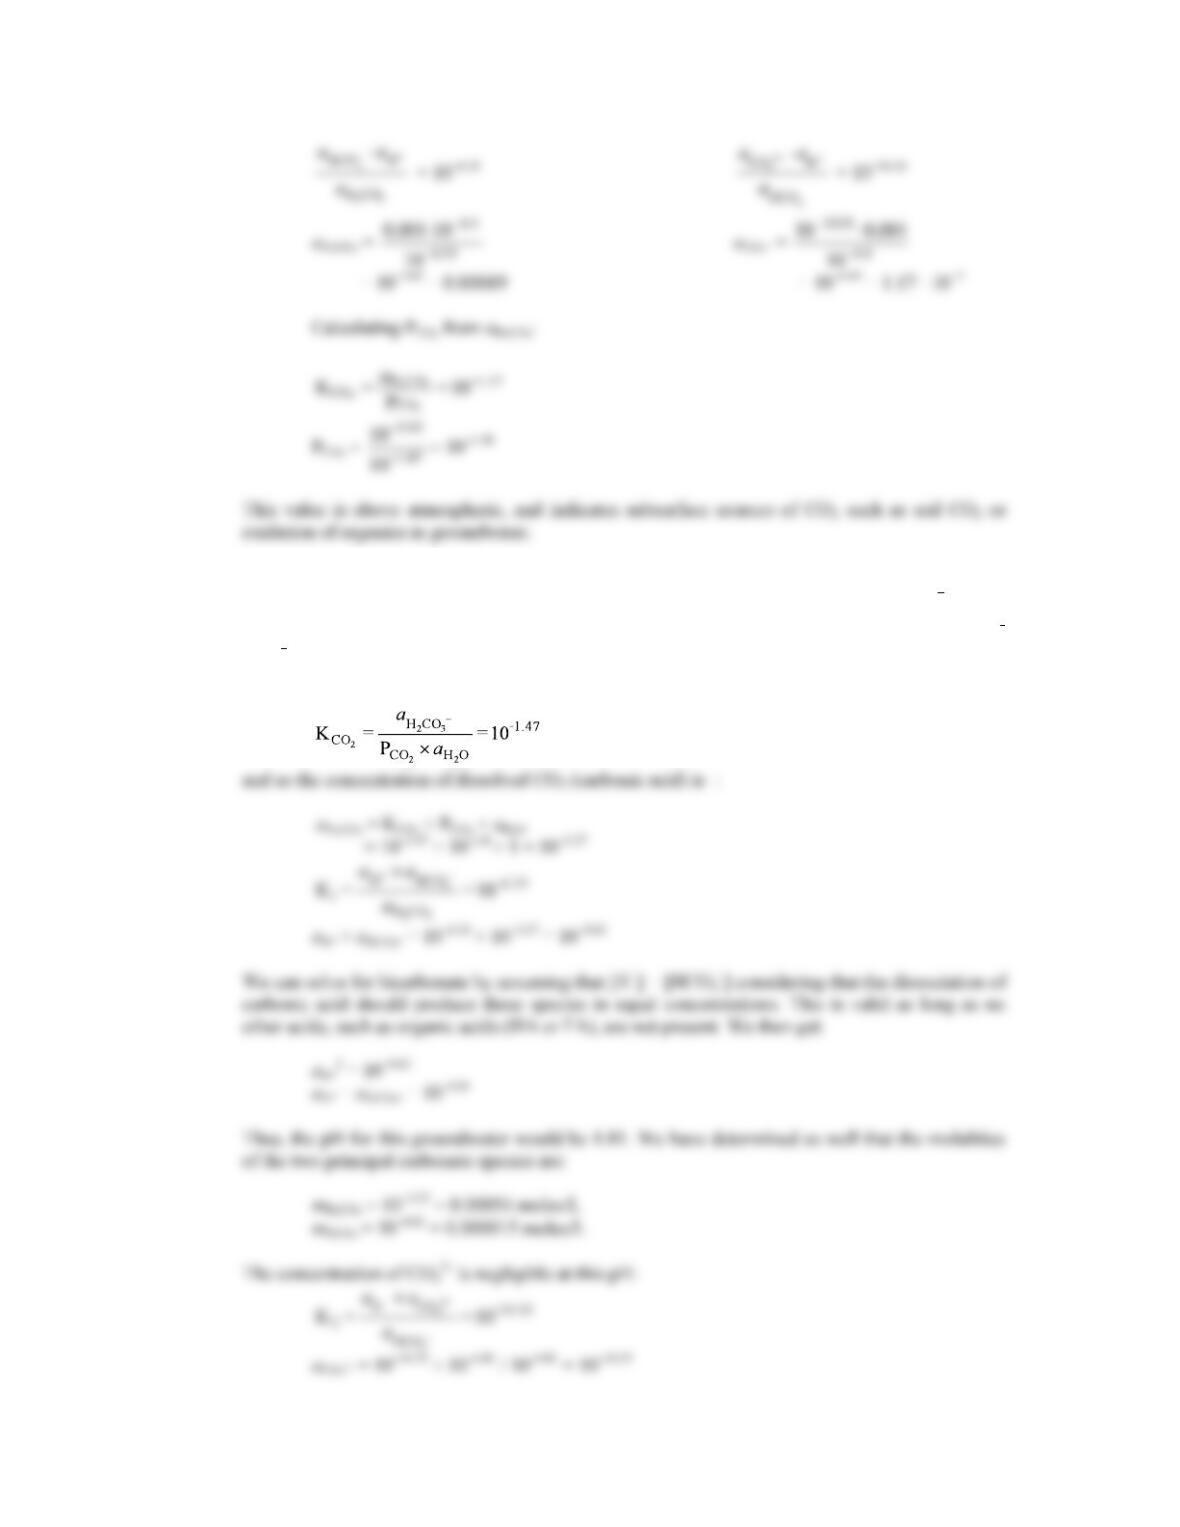
3. What is the pH of a groundwater in equilibrium with a soil atmosphere that has PCO2 = 10 1.8? The
groundwater temperature is 25°C. Determine the distribution of carbonate species (i.e. mH2CO3, mHCO3
and mCO32).
From Table 3.7, the dissolution constant for CO2 can be found for 25°C:
45
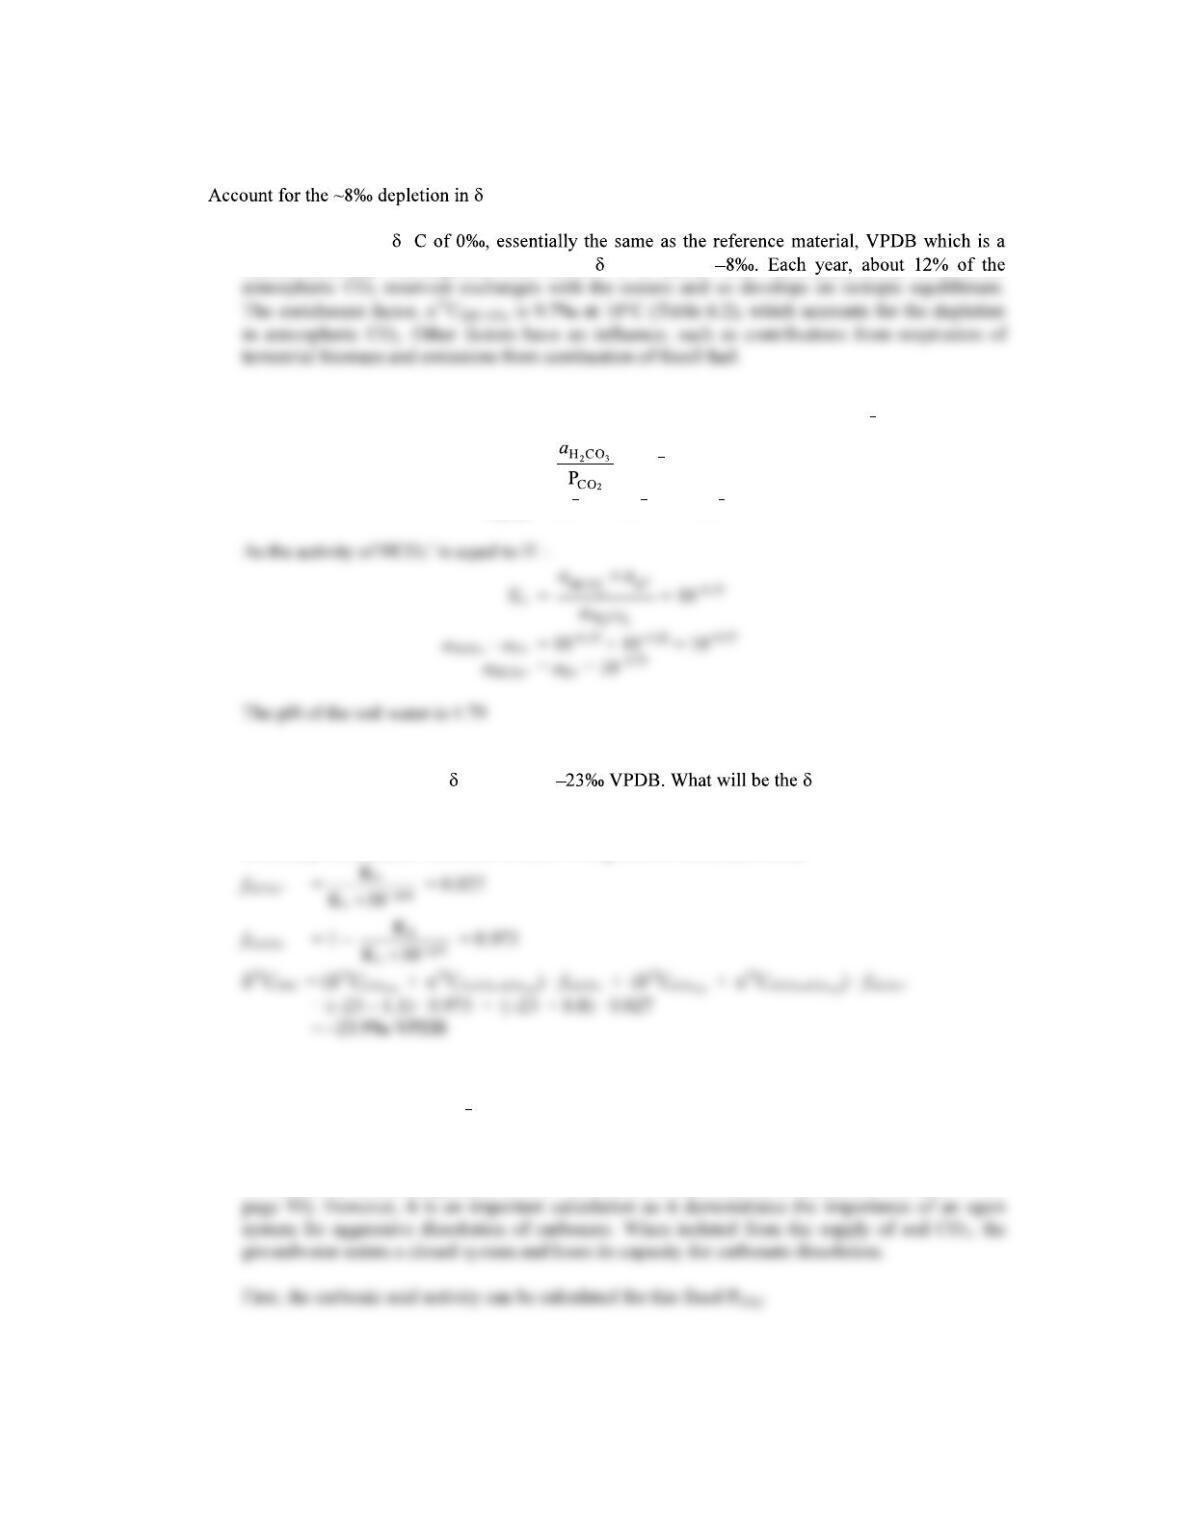
4. 13C of atmospheric CO2 in comparison with marine DIC.
Marine DIC has a 13
marine carbonate. Atmospheric CO2 has a 13C of about
5. Determine the pH of soil water (25°C) in equilibrium with a soil air having PCO2 of 10 1.75.
Carbonic acid activity: KCO2 = = 10 1.47
aH2CO3 = 10 1.47 × 10 1.75 = 10 3.22
6. The soil air in question 5 has a 13C value of 13C of DIC in soil water?
The pH of this water we found to be 4.79, well in the range dominated by carbonic acid, with
secondary bicarbonate. The ratio of these two species is determined from:
7. How many parts per million calcite (ppm CaCO3) will be dissolved during open system weathering of
limestone in a soil with PCO2 = 10 2 and what is the final pH. Assume activities equal molalities.
As temperature is not stated, then 25°C is assumed. This problem is identical to that in Example
6.2 but at a different temperature and so with different thermodynamic constants, K (Table 3.7 on
46
2mCa2+ = mHCO3
Substituting into the charge balance equation for mCa2+ and mHCO3 solves for H+:
2 =
10 3pH = 10 21.79
pH = 7.26
47
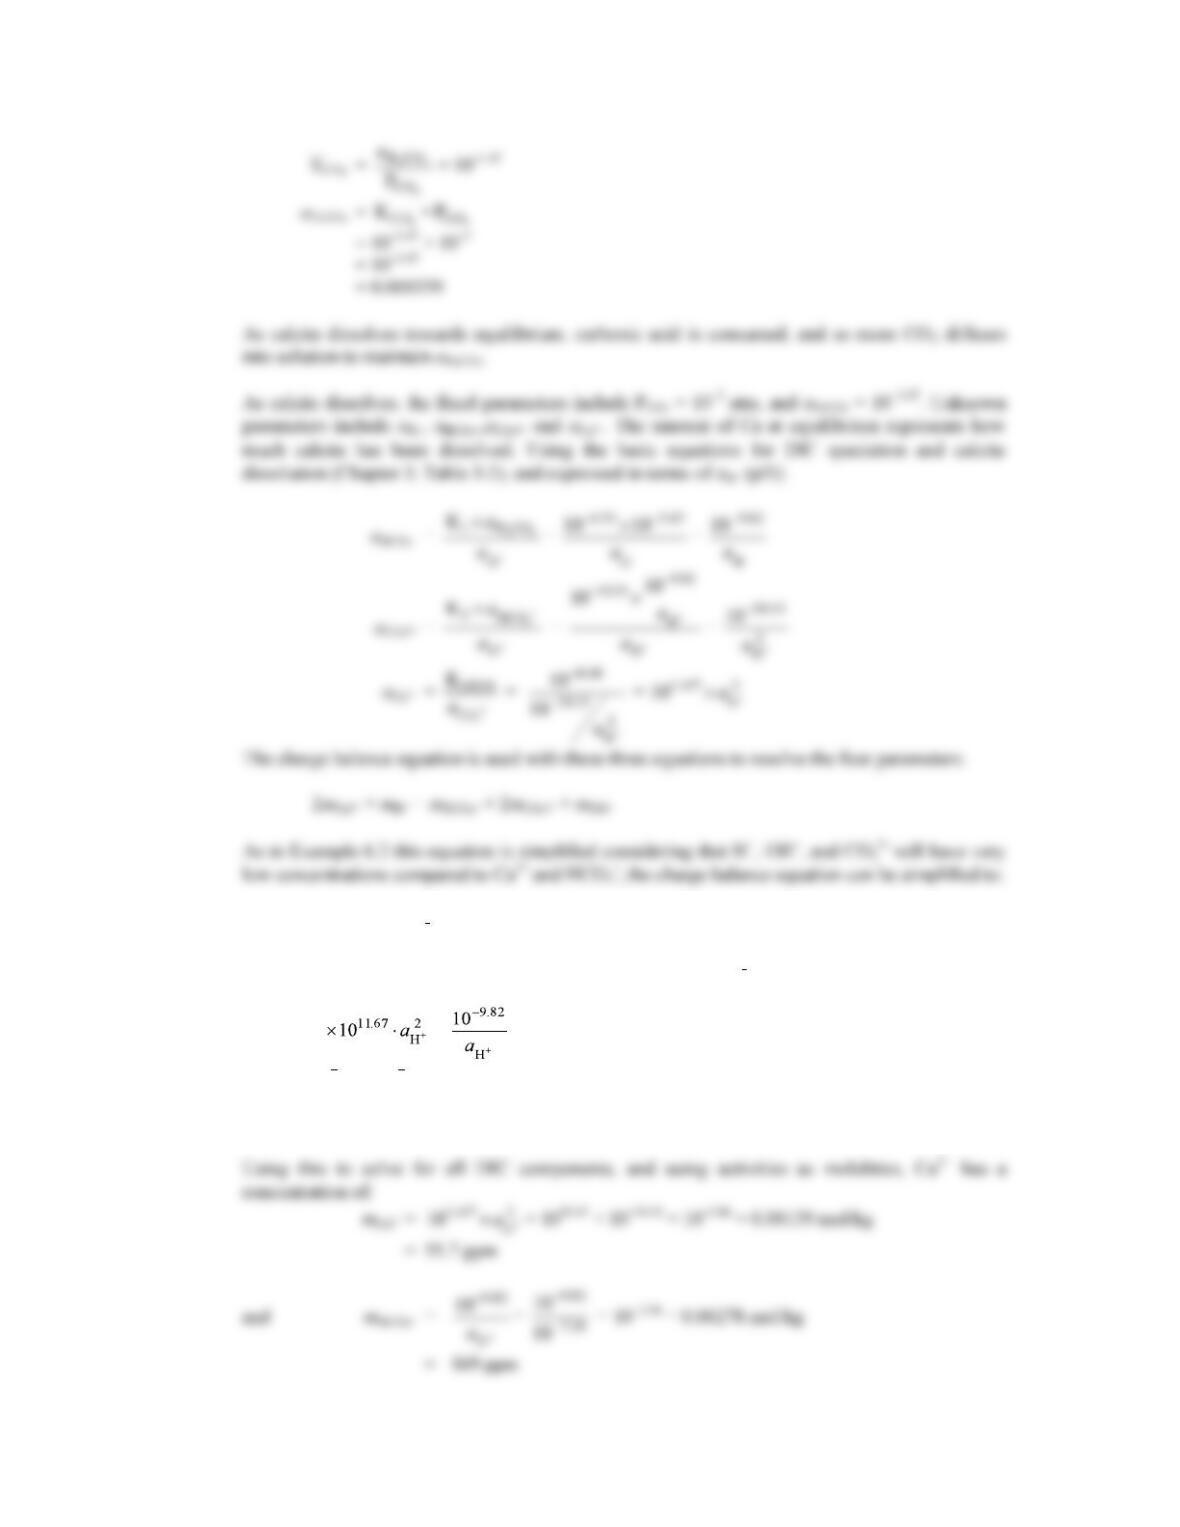
8. How much calcite can be dissolved under closed system conditions with an initial PCO2 of 10 1.5? Note
that as the temperature is not given for this problem, 25°C is assumed.
Carbonate dissolution under closed system conditions is greatly limited due to the consumption of
carbonic acid without its replenishment from the soil zone. However, calculating the amount of
calcite that can be dissolved is not so straightforward as in problem 7 because the carbonic acid
concentration decreases, rather than staying constant as it does under open system conditions. Two
approaches can be used in these hand calculations. The first was shown in Example 6.1 and is an
approximation where the amount of calcite that can be dissolved is equal to the initial amount of
carbonic acid. The second is a more rigorous calculation from Garrels and Christ (1965) that is
based on thermodynamic equilibrium between all reacting components.
48
aHCO3 = = 10 4.66 = 0.000022 mol/kg
As the dissociation of H2CO3 is an acidic reaction (pH = 4.66), CO3
2 will have a minimal
concentration, and so the initial DIC concentration will be:
mDIC = 0.00107 + 0.000022
= 0.00109 mol/kg
There are six unknown parameters and four equations. Two additional equations that can be used
are the mass balance equation, where the amount of dissolved calcite (mCa2+) is equal to the total
DIC minus the initial DIC of 0.00109 mol/L:
Mass balance equation: mCa2+ = mH2CO3 + mHCO3 + mCO32 0.00109
and the charge balance equation, based on the law of electroneutrality:
Charge balance equation: 2mCa2+ = mHCO3 + 2mCO32 + mOH mH+
49
This provides a unique solution to the mass balance equation:
= + 0.00218 + 0.00109
which can be simplified:
Multiplying through by and collecting terms renders a quadratic equation which is most easily
solved by trial and error by using a goal seek function on a spreadsheet:
10 48.7 = 10 8.48 10 16.0 10 26.0 10 37.0 mH+
Accordingly, mH+ = 10 7.48 and pH = 7.48
50
9. The Ahouset spring waters in Example 6.8 are a good case study for the non-carbonate contributions to
alkalinity. The alkalinity titration in Figure 6.15 after correction for OH and H3SiO4, provides total
carbonate alkalinity, which includes both HCO3 and CO3
2. From this titration, calculate the
concentration of CO3
2. Using CO3
2 activity, what would be the concentration of Ca2+ for calcite
equilibrium?
From the graph, the carbonate alkalinity curve flattens in the pH 8.4 range which is the point
where all the CO3
2 has been converted to HCO3 according to the reaction:
CO3
2 + H+ 3
However, both hydroxide, OH , and silica, H3SiO4, contribute to alkalinity above pH 8.4, and
must be subtracted:
Silica alkalinity titrated between pH 10.05 and 8.4:
From Example 6.8, the total silica alkalinity at the sample pH of 10.05 was calculated to be
0.00019 eq/kg. The silica alkalinity at the CO3
2 titration endpoint (pH 8.4) is subtracted from this
to give the amount that contributes to the measured alkalinity at this endpoint:
Total Si = 3 · 10 4 mol/kg = mH3SiO4 + mH4SiO4
51
This is insignificant residual OH and so the OH alkalinity titrated between pH 10.05 and 8.4 is
simply the total calculated in Example 6.8,
alkOH = 10 (14 10.05) = 10 3.95 = 0.00011 eq/kg
And so correcting for H3SiO4 and OH to get just CO3
2alkalinity gives:
alkCO32 = alkpH 8.4 alkH2SiO4 alkOH
= 0.00042 0.00018 0.00011
= 0.00013 eq/kg
Determining mCa2+ for calcite in equilibrium with the solution. We could assume that activities =
molalities (a = m), but it is not too much more complicated to use activity coefficients for a more
correct answer, particularly because for divalent ions, the difference between activities and
molalities is greater than for monovalent ions.
From the geochemical analysis for this spring given in Example 6.4, the ionic strength can be
calculated. Be sure to use the molalities of all the ions, including OH and H3SiO4, which we
showed to have significant concentrations at this high pH.
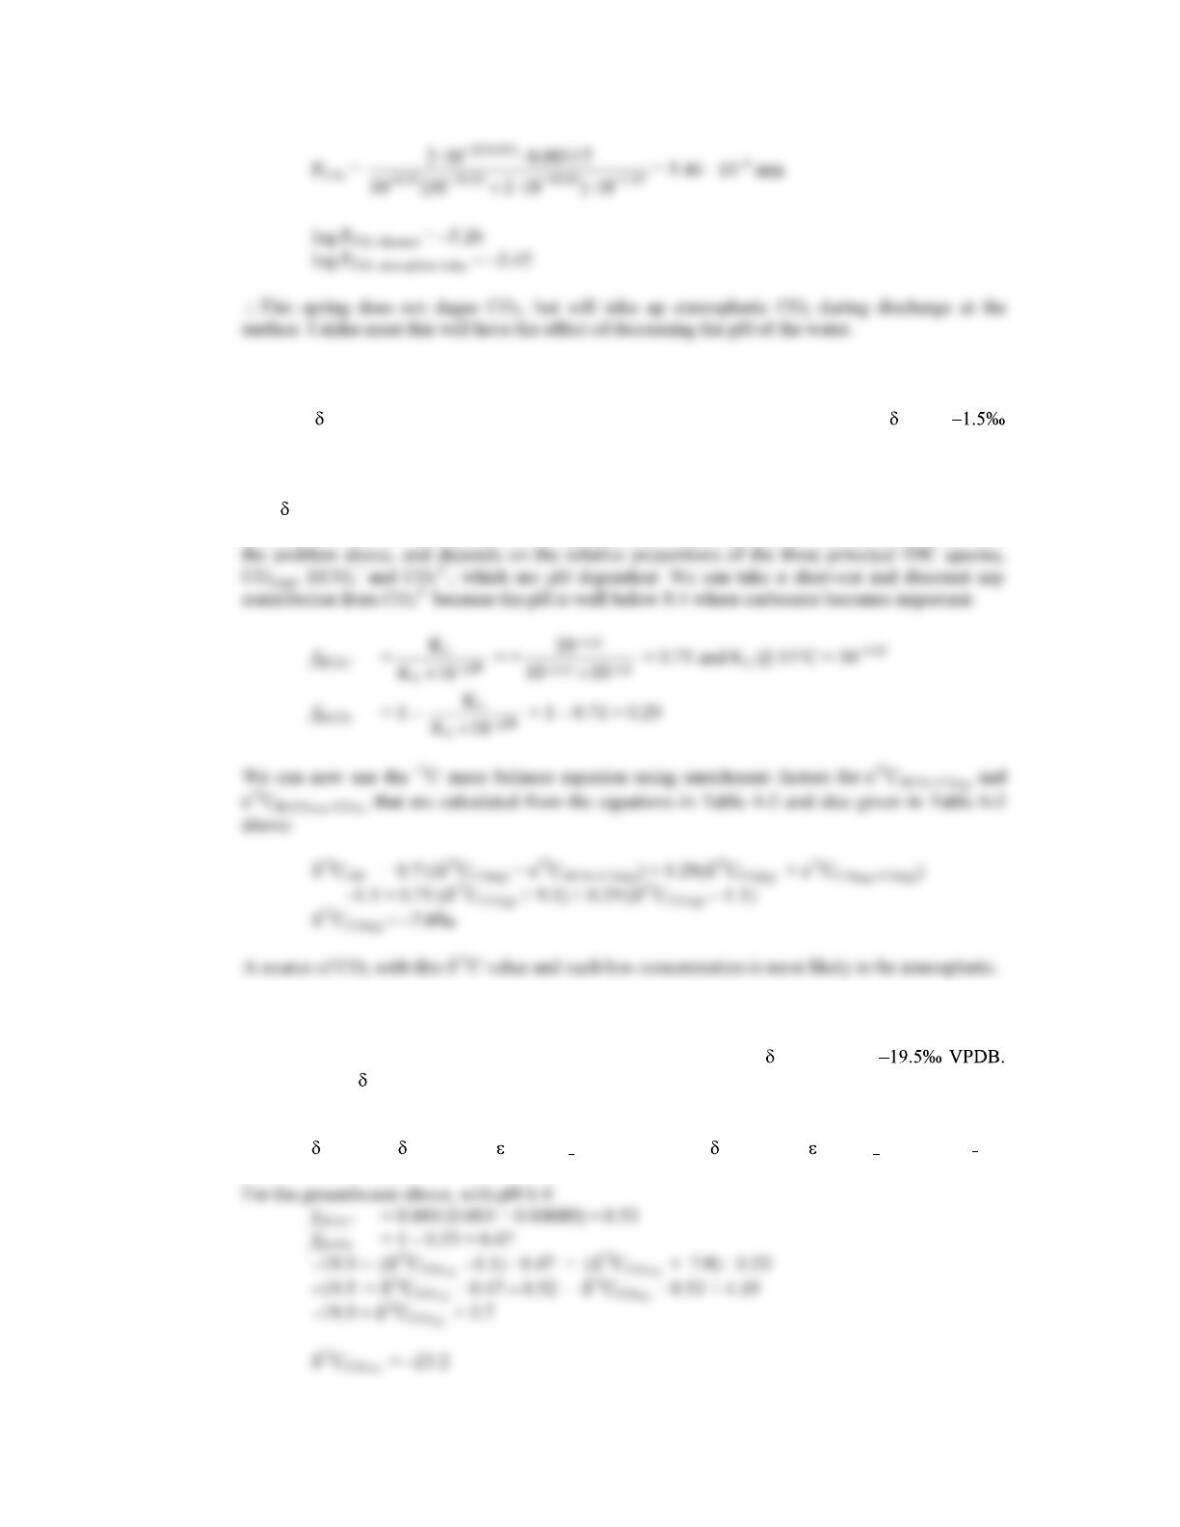
10. What is the PCO2 of the Ahouset spring water? Will this water degas CO2 upon discharge?
PCO2 = aH2CO3 / KCO2 =
52
11. Calculate the 13C of the CO2(g) in equilibrium with a lake whose DIC (2.1 ppm) has a 13C =
and a pH of 6.8 at 15°C. Determine the appropriate enrichment factors from equations in Table 6-2 (or
Table 4-2). What is a likely source of this CO2?
The 13CCO2 is a theoretical value for the CO2(g) that would be in equilibrium with this water.
Whether it exists or not depends on the hydrogeological setting. The calculation is the reverse of
12. The DIC sample from the groundwater in question 2 has a measured 13C value of
What would be the 13C value for a CO2(g) gas phase in equilibrium with this water?
For this we use the isotope mass balance equation for the principal DIC species:
13CDIC = ( 13CCO2(g) + 13CCO2(aq) CO2(g)) · fCO2(aq) + ( 13CCO2(g) + 13CHCO3CO2(g)) · fHCO3
53
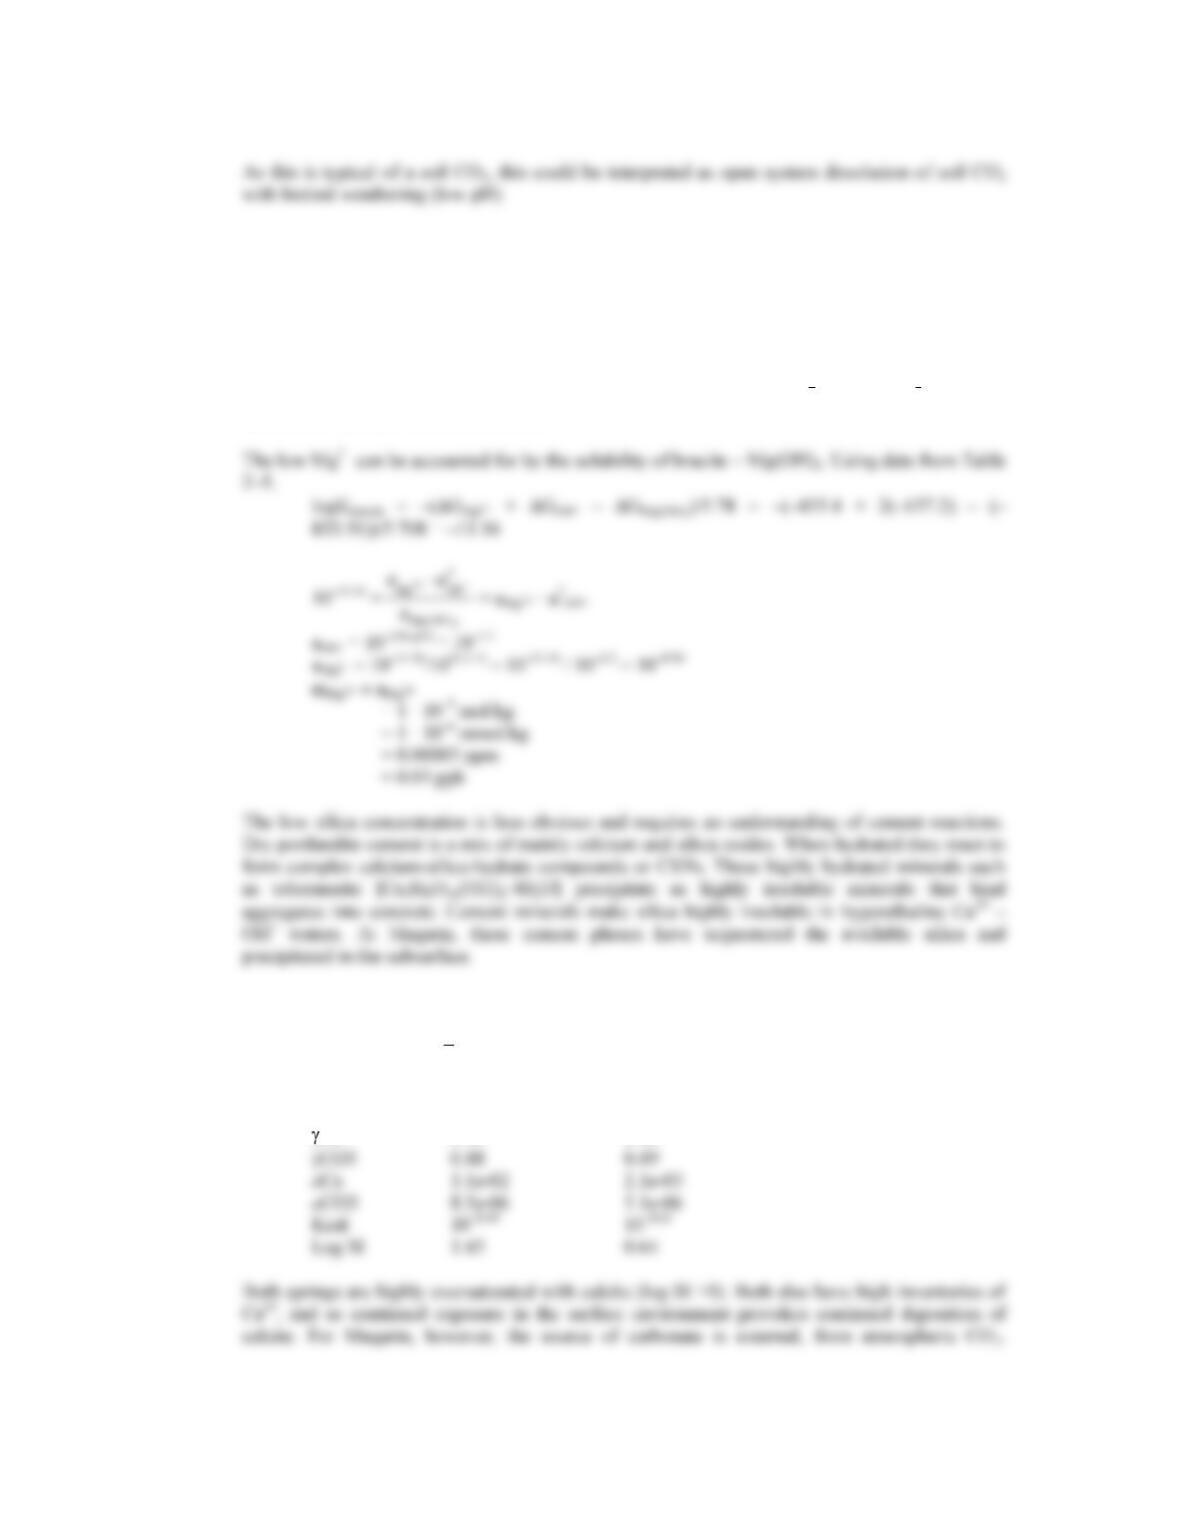
13. The high pH groundwaters from Maqarin (section Extreme Alkalinity on page 201) have no detectable
Mg2+. Determine the solubility constant for brucite [Mg(OH)2] and calculate the equilibrium
concentration of Mg2+ at this pH.
More puzzling is the absence of dissolved silica, which one would expect to be very high given
that at this pH, the groundwaters are within the stability fields for H3SiO4 and H2SiO4
2 (Fig. 2-6).
Account for the lack of dissolved silica.
14. Calculate the calcite saturation indices for the Maqarin and the Mount Edziza spring waters in the
section on Extreme Alkalinity a Tale of Two Travertines on pages 202 and 204.
Maqarin Edziza
I 0.102 0.053
Ca 0.41 0.42
54
15. Describe, with the relevant reactions, how recharge waters in soil developed on basalt bedrock can
precipitate calcite. Note that basalts are mafic rocks dominated by calcium-rich feldspars (anorthite).
CO2 + H2O H2CO3
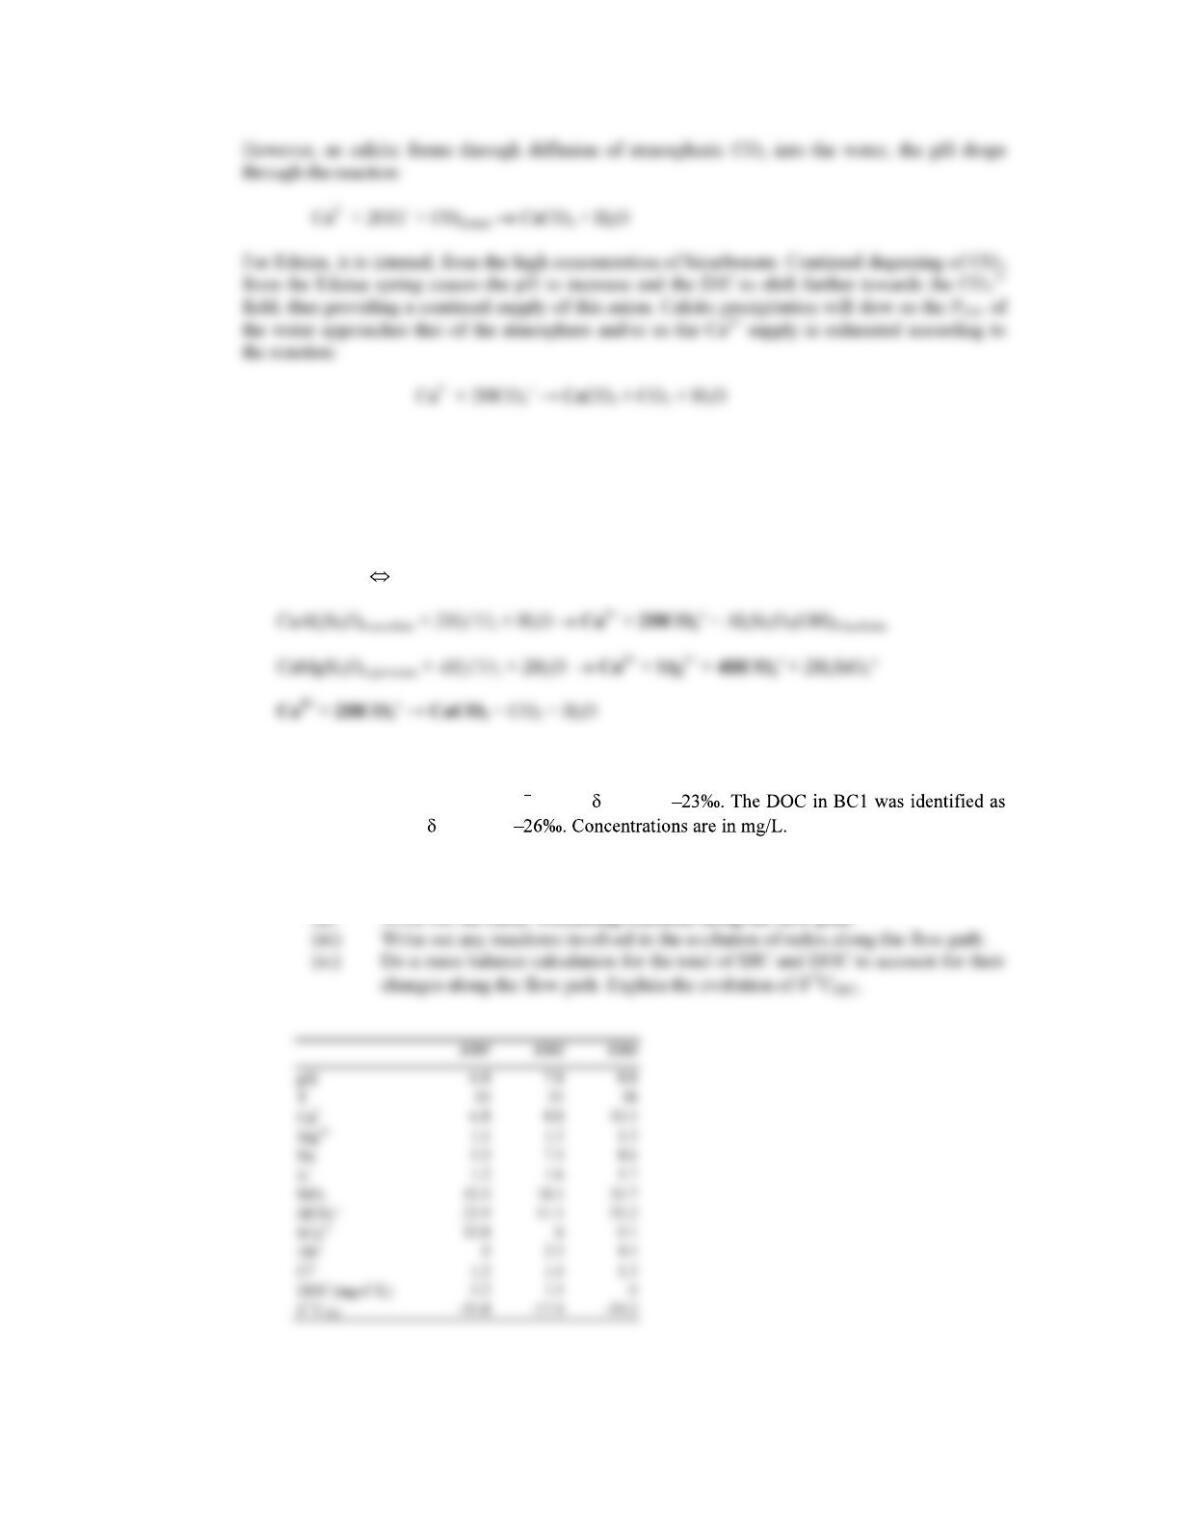
16. These three wells were installed along a flow system in a confined basalt aquifer. In the outcrop
region, the soil PCO2 was measured at 10 1.6 with 13CCO2 =
humic and fulvic acids with 13CCH2O =
(i) Calculate the PCO2 for each well and compare with the recharge area. Is this open
or closed system weathering? Explain the trends for Ca2+ and Na+.
(ii) Write out the likely weathering reactions along the flow path.