34
Tracing the Water Cycle
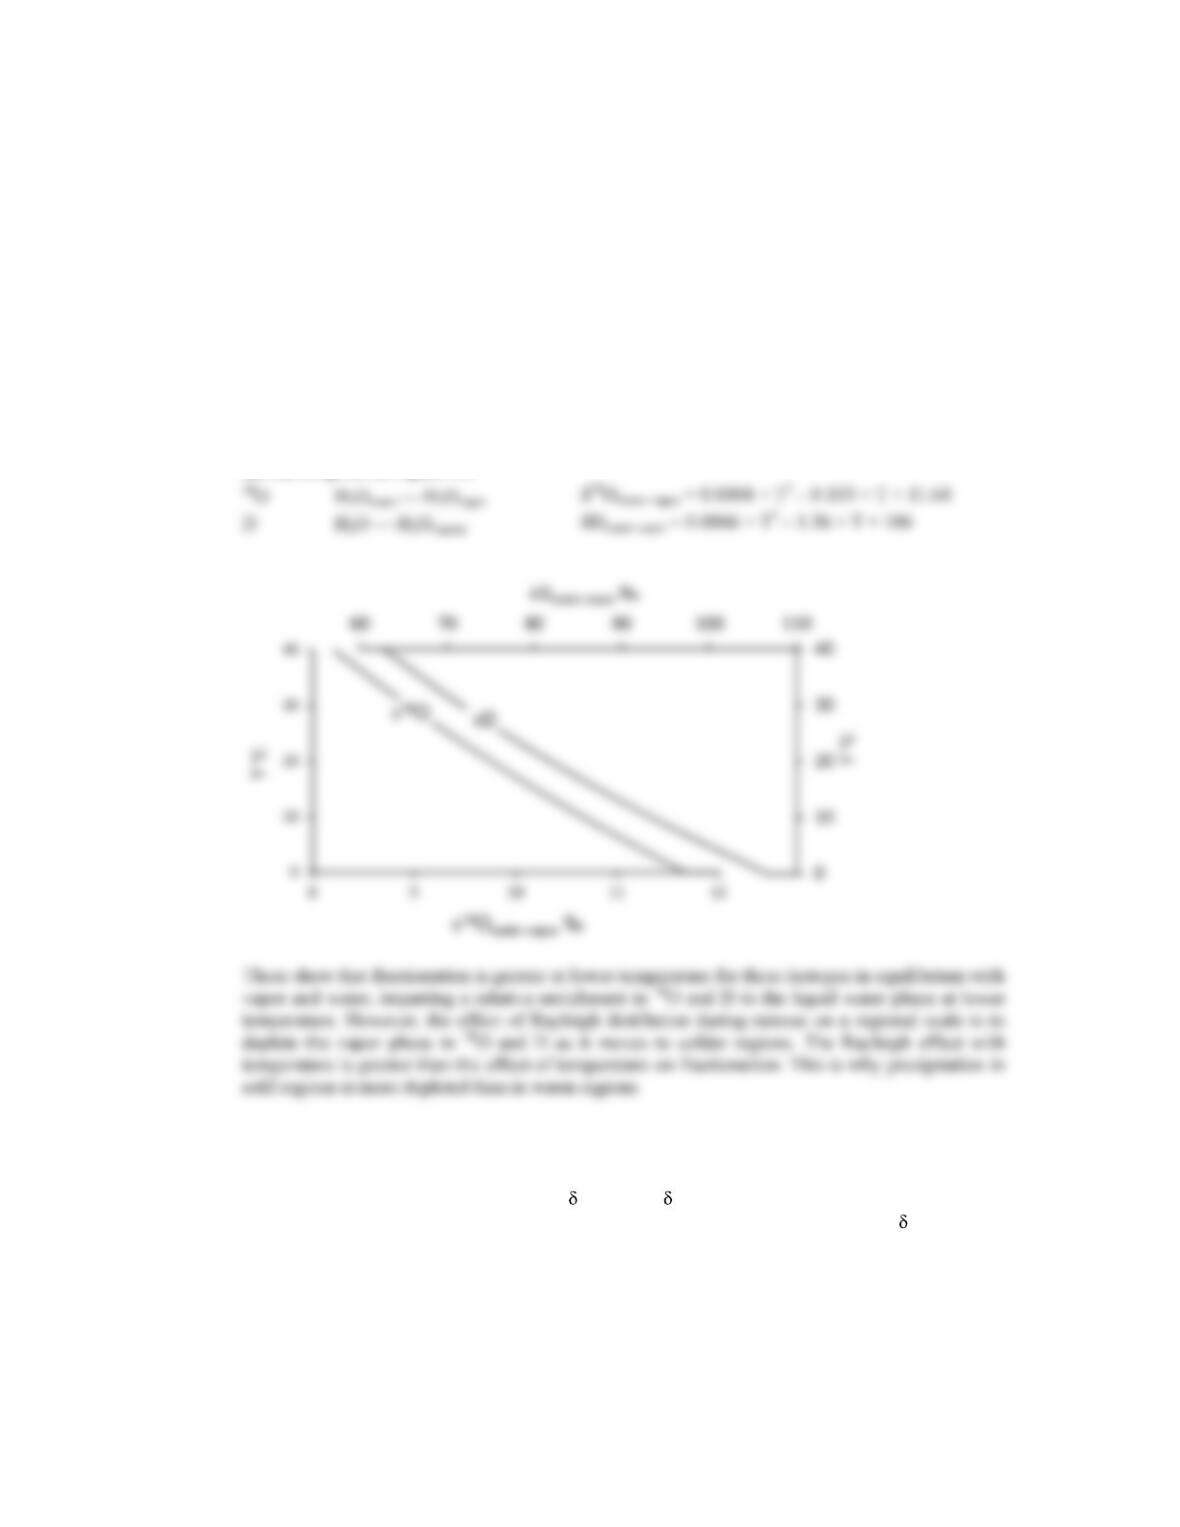
1. Plot the enrichment factors for 18O and D for the temperature range of 0 to 50°C and note that
fractionation is enhanced at lower temperature. Which isotope is most strongly fractionated and why?
If fractionation is enhanced at lower temperature, why is precipitation in cold regions depleted in 18O
and D?
These enrichment factors can be plotted using the temperature equations in Table 4.2 and produce
the curves given in Figure 4.2.
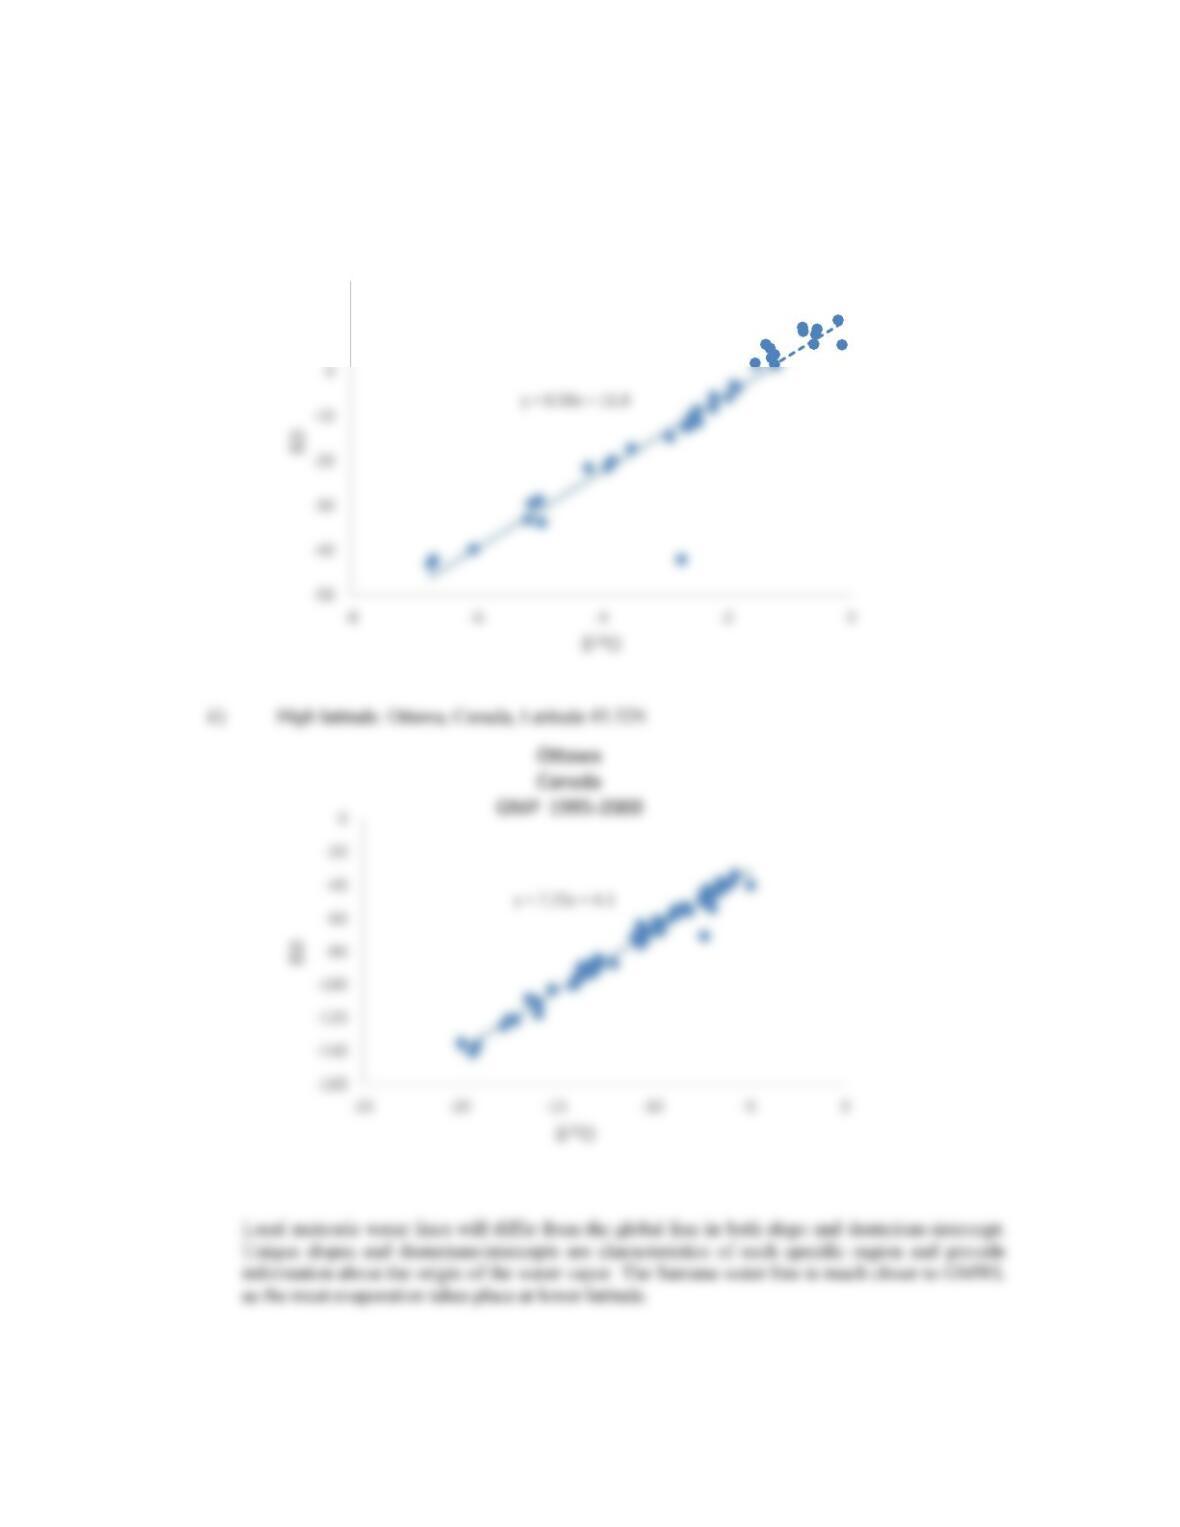
2. From the GNIP site, download the monthly stable isotope data from 1995 to 2000 for (i) a low latitude
site and (ii) a high latitude site. Plot them on a 18O versus D diagram and produce a local meteoric
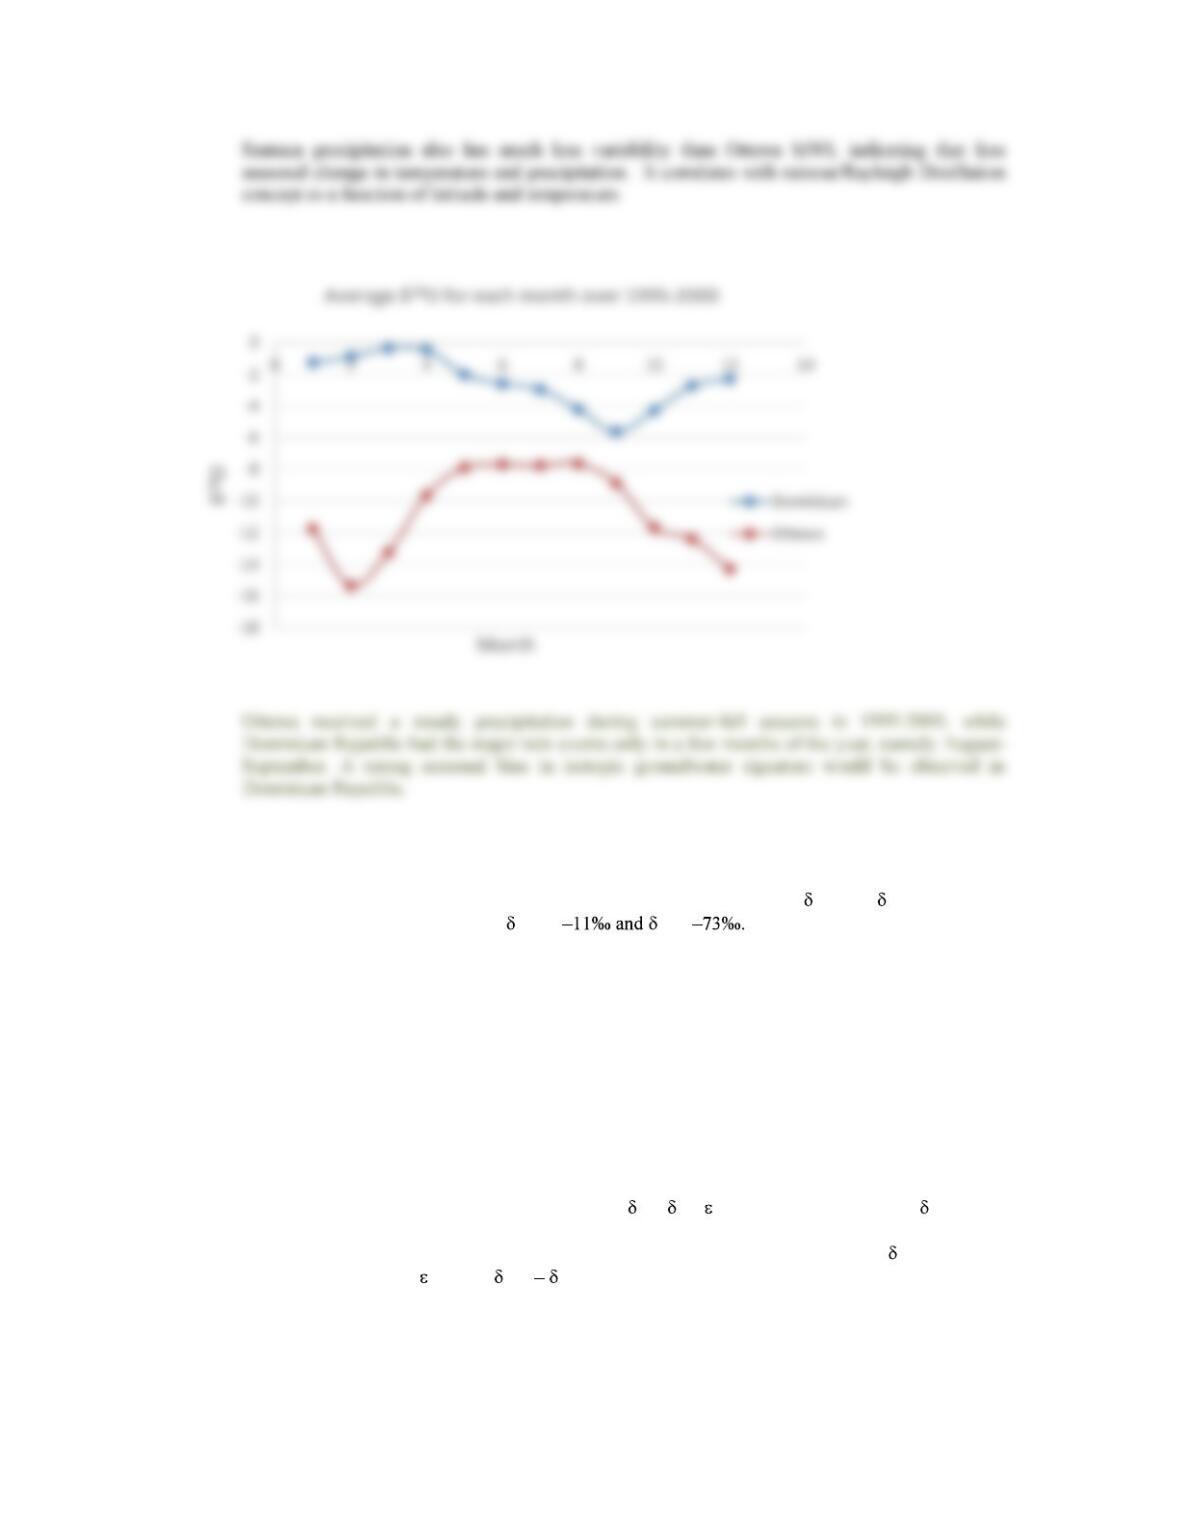
water line for each site. Compare their range, slope and deuterium-intercept. Average the 18O data for
each month and plot for each month of the year. Compare the seasonal effect for these two sites.
5
35
i) Low latitude site: Santana, Dominican Republic, Latitude 18.47N
10
20
SANTANA
Dominican Republic
GNIP 1995-2000
36
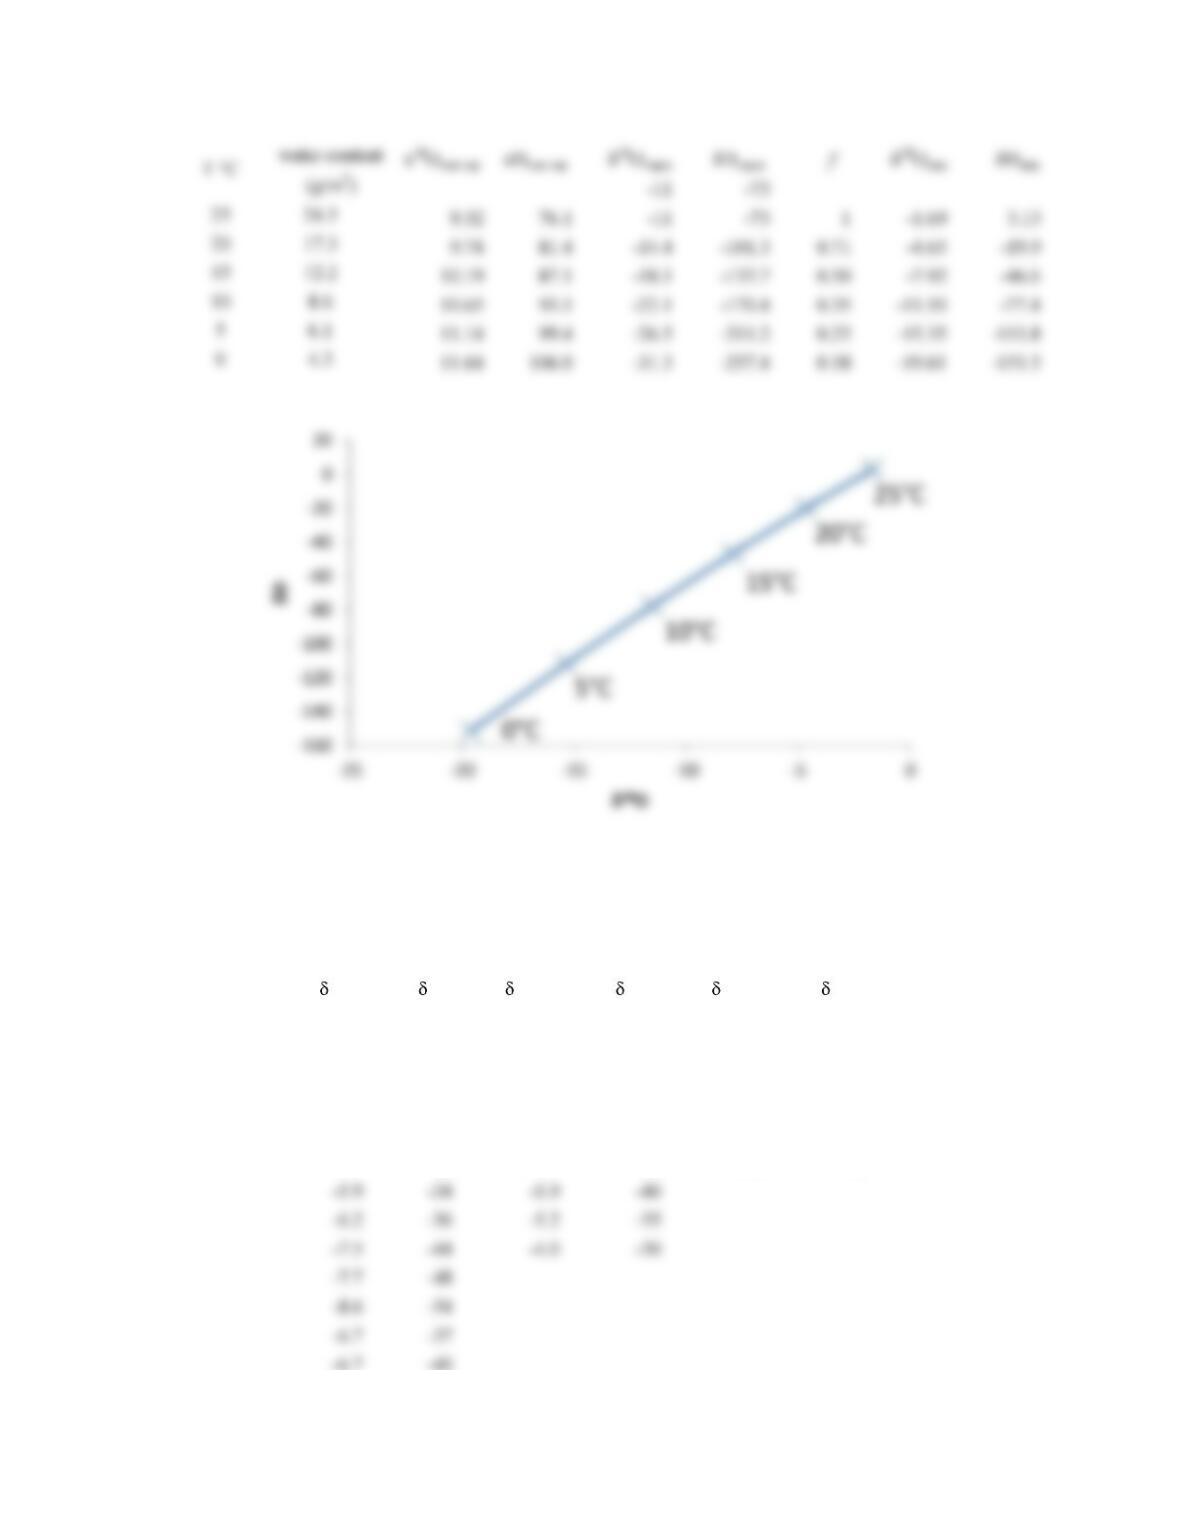
3. Using the equilibrium fractionation equations in Chapter 4, and the moisture content of water-saturated
air for different temperatures given here, calculate the step-wise evolution of 18O and D in rain from
a continually cooling vapor mass with 18O = D =
T °C
water content
(g/m3)
25 24.5
20 17.3
15 12.2
10 8.6
5 6.1
0 4.3
Use the simplified Rayleigh distillation equation, f = o + wat-vap lnf to determine the -value for
the water vapor at each new temperature step. Here, the residual fraction, f, is determined from the
residual water content at the new temperature, i.e. f20°C = 17.3/24.5 = 0.71. The -value for the
rain is calculated from wat-vap = water vap.
37
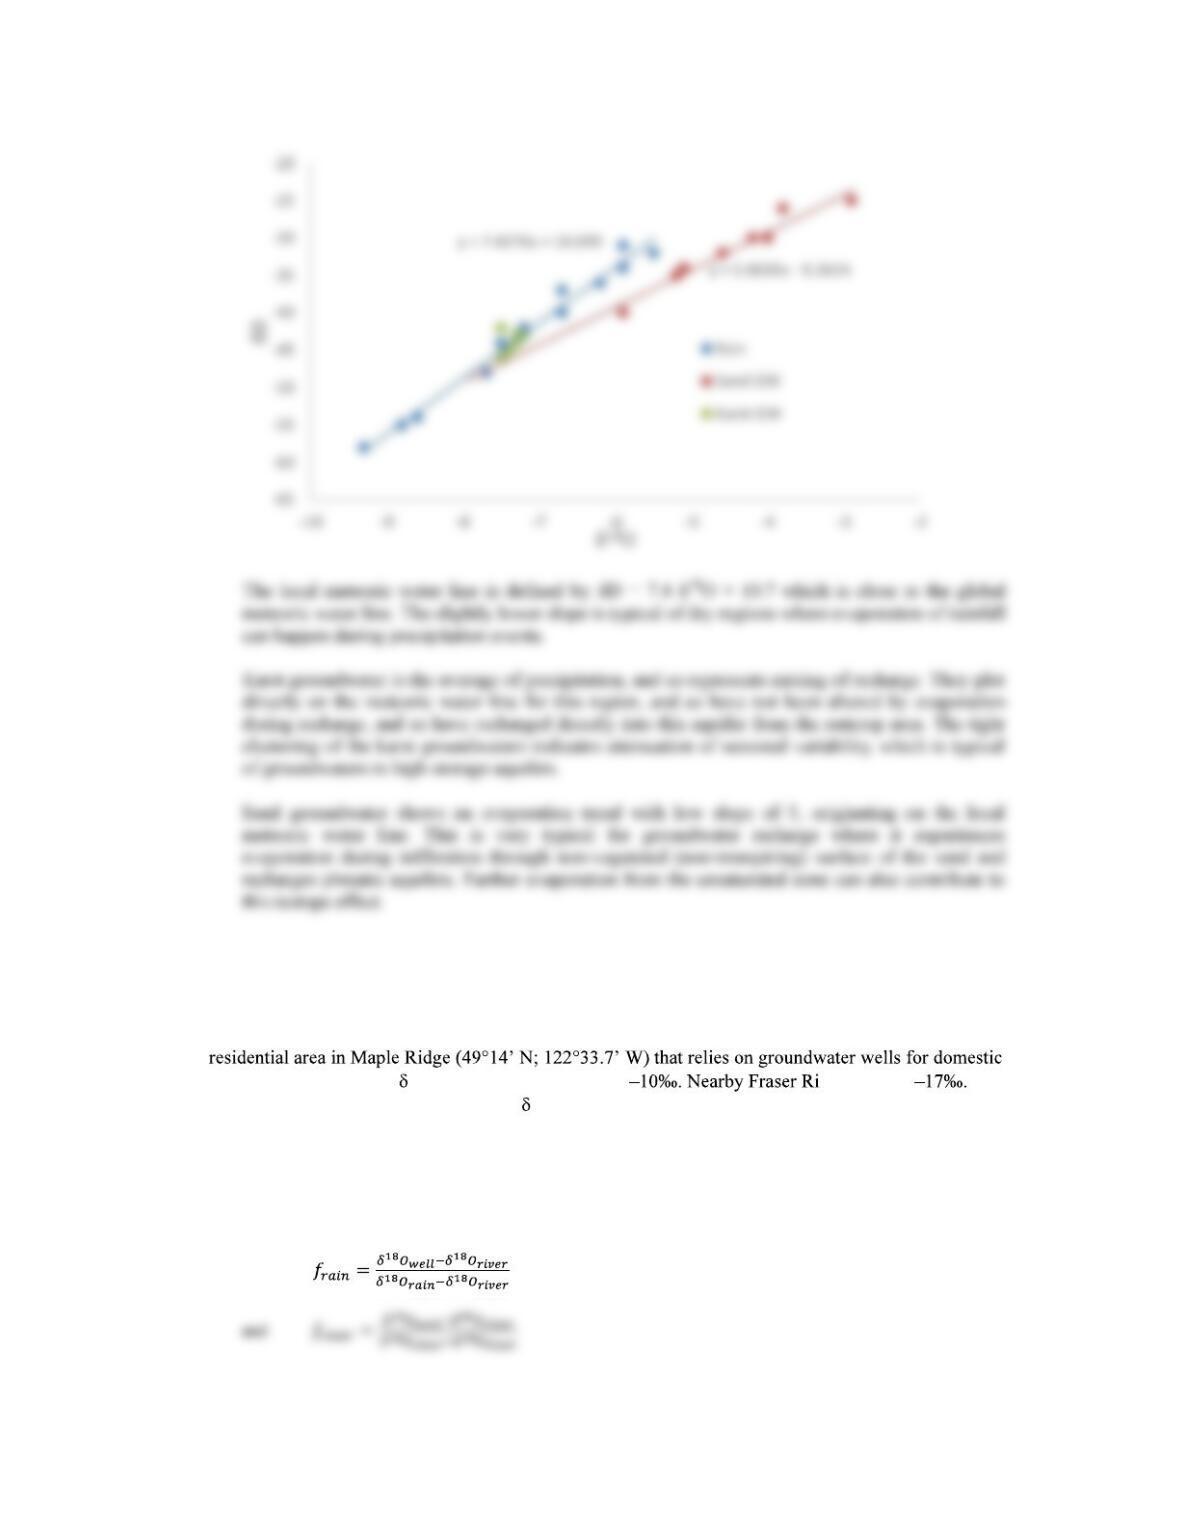
4. The following data were acquired from a precipitation station and groundwaters in a semi-arid region,
where an aeolian sand aquifer overlies fissured limestone bedrock that outcrops in local karst
landscape. Plot these data and discuss what these measurements record about recharge mechanisms for
these two groundwaters.
18O
rain
D
rain
18O
sand gw
D
sand gw
18O
karst
gw
D
karst gw
-9.3 -58 -5.1 -34 -7.3 -44
-8.8 -55 -4.6 -32 -7.2 -43
-8.8 -55 -2.9 -25 -7.5 -42
-7.2 -42 -4.2 -30 -7.3 -43
-5.9 -31 -4.0 -30 -7.5 -46
-5.5 -32 -3.8 -26 -7.4 -45
-6.7 -40
38
5. The Fraser River Delta has extensive alluvial sediments forming a thick phreatic aquifer with semi–
confined zones at depth. The following data were measured in a piezometer nest situated in a
water. The mean annual 18O for local precipitation is ver water is
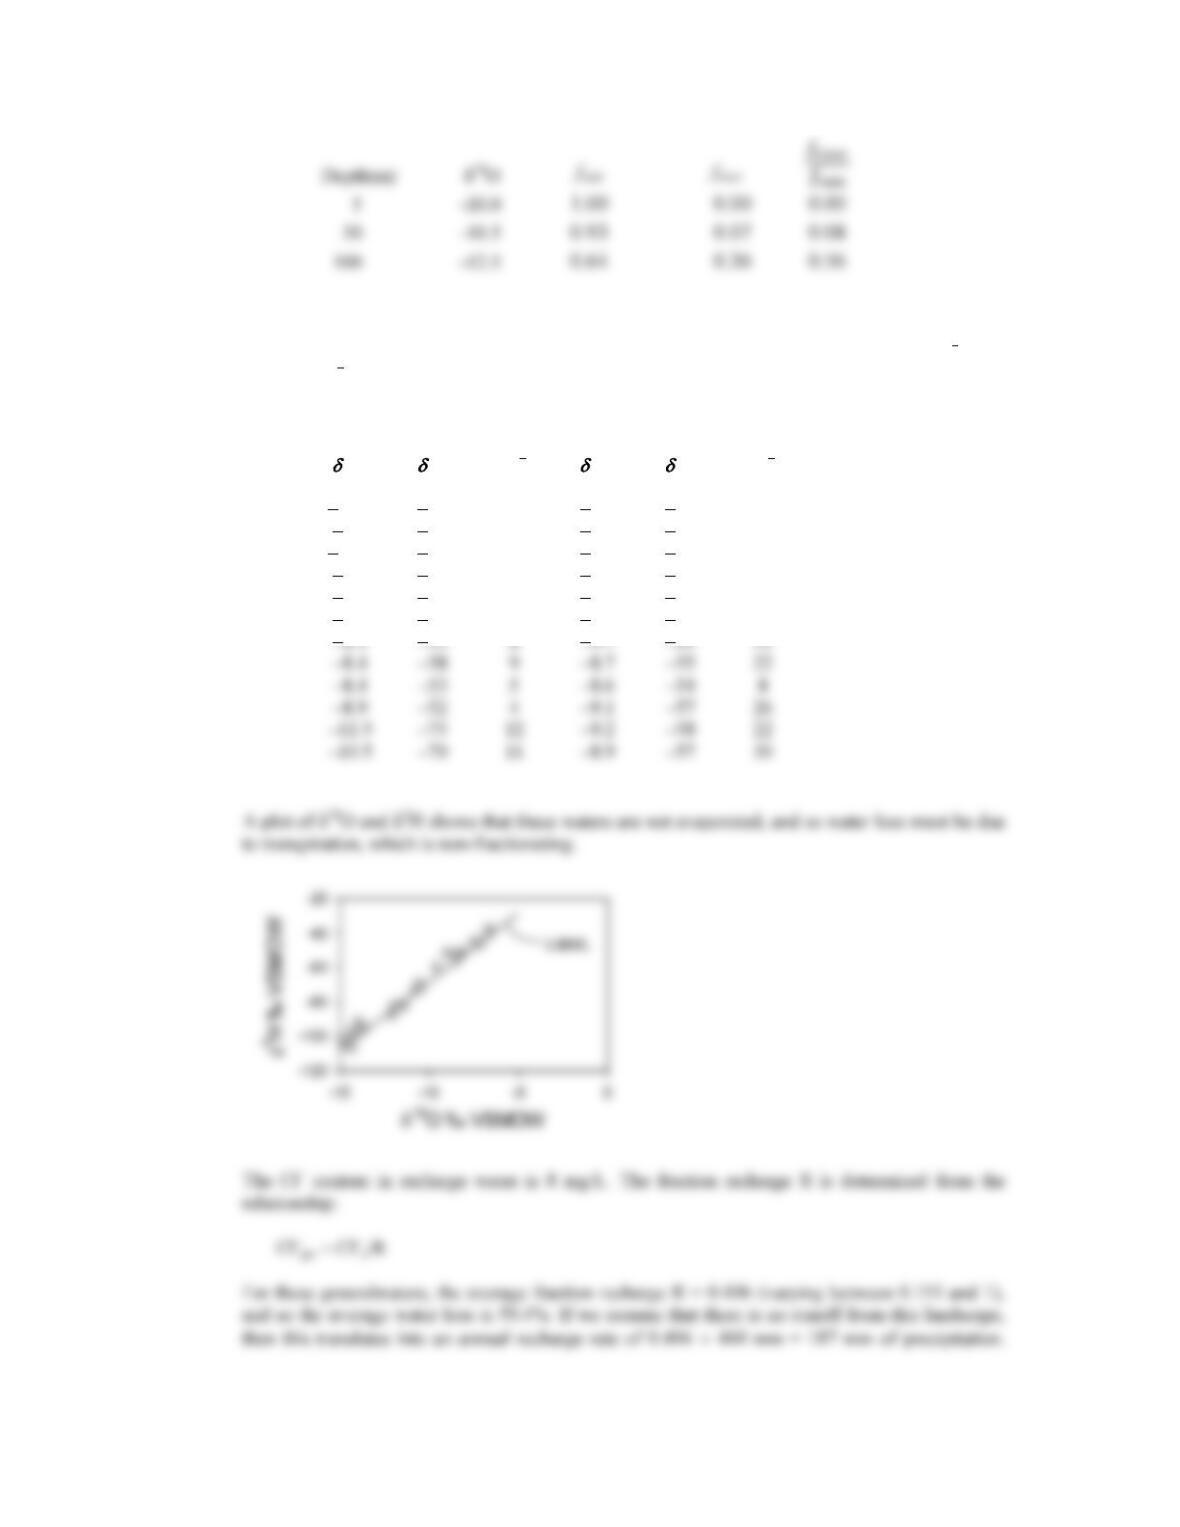
Considering the Fraser to be a source of 18O-depleted groundwater in this aquifer, what is the mixing
ratio of river infiltration to rain infiltration?
The solution is a simple linear relationship between the measured isotope values for the
groundwater and the two mixing endmembers of rain and river water:
39
6. The following data were measured for groundwater in a sand aquifer beneath an agricultural field in a
region that receives 460 mm of precipitation annually. Precipitation has an average of 8 mg/L Cl . The
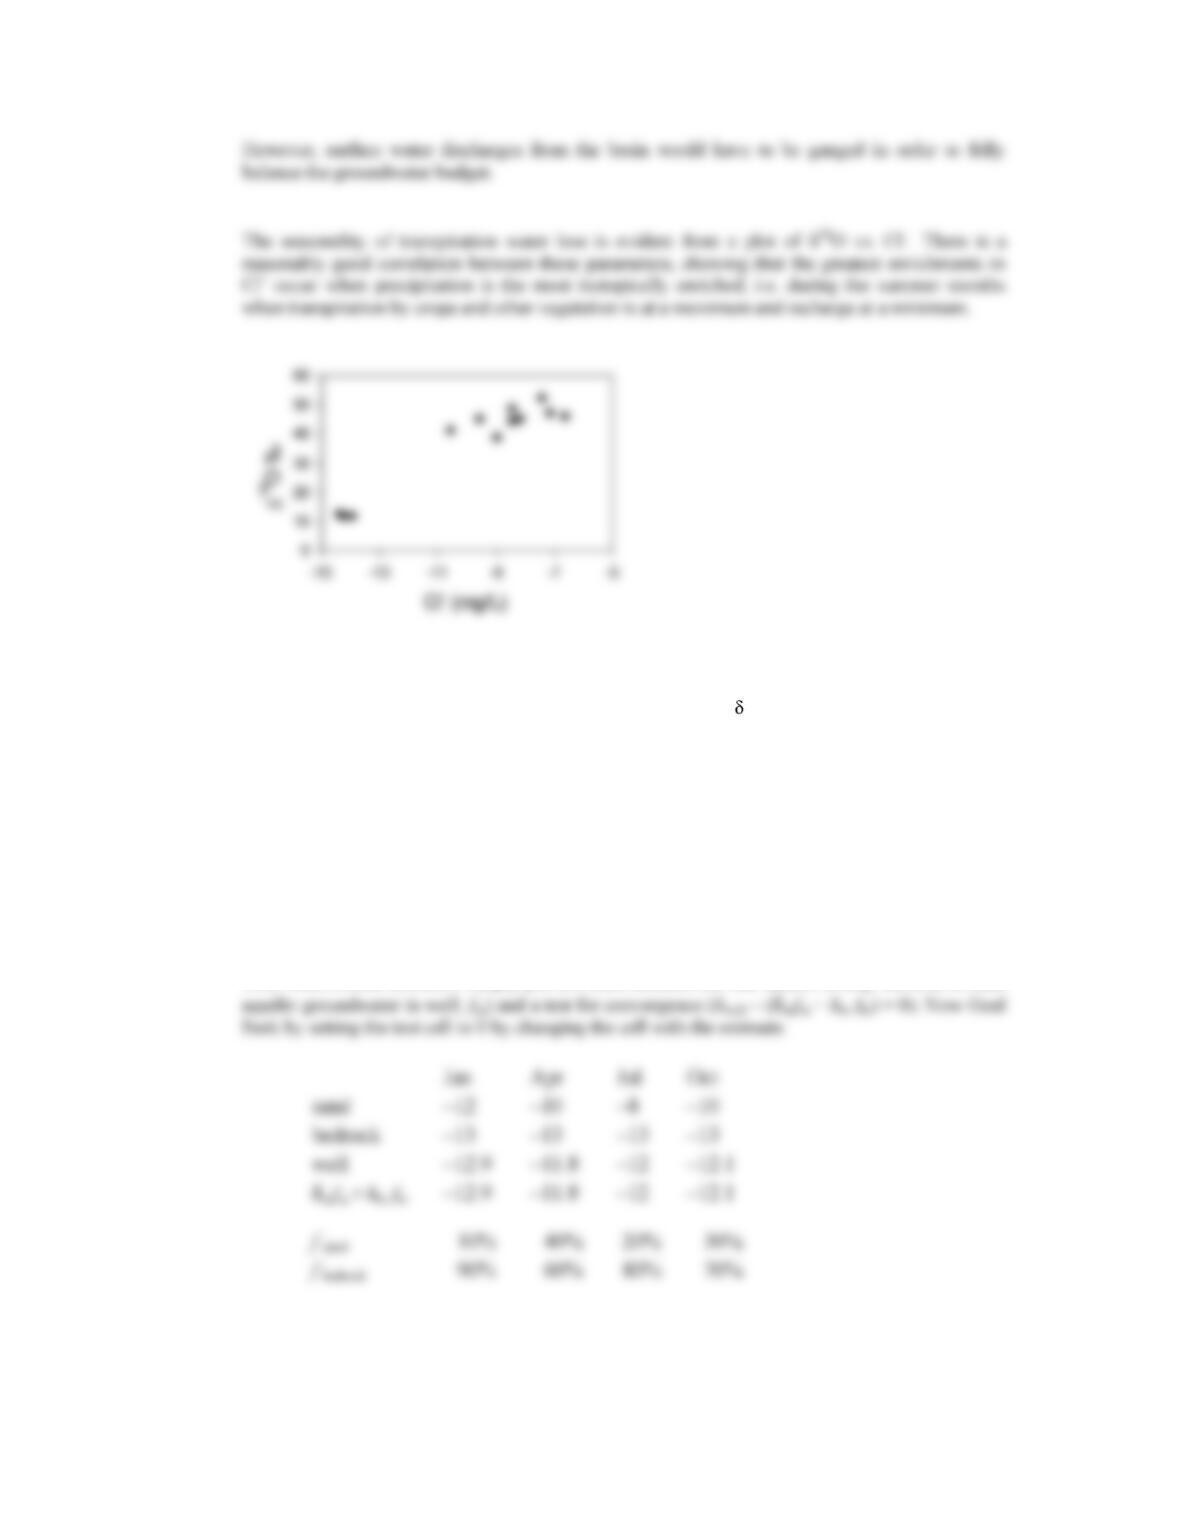
enrichment of Cl in the groundwaters indicates some loss of recharge water during infiltration. Is this
due to evaporation from the soil or transpiration by crops? Calculate the fraction of water lost, and the
annual recharge rate (mm/yr). Comment on the seasonality of any water loss.
18
O
2
H Cl
18
O
2
H Cl
11.9 76 11 8.7 55 8
6.6 40 6 9.4 60 42
12.3 80 10 8.8 57 9
9.5 61 9 9.1 57 7
7.1 48 6 9.1 58 53
7.4 46 5 9.8 63 52
40
7. Groundwater is being pumped from a fully-screened well that includes an upper unconfined sand and a
fractured bedrock zone overlain by clay till. Seasonal monitoring of 18O for the well water and for
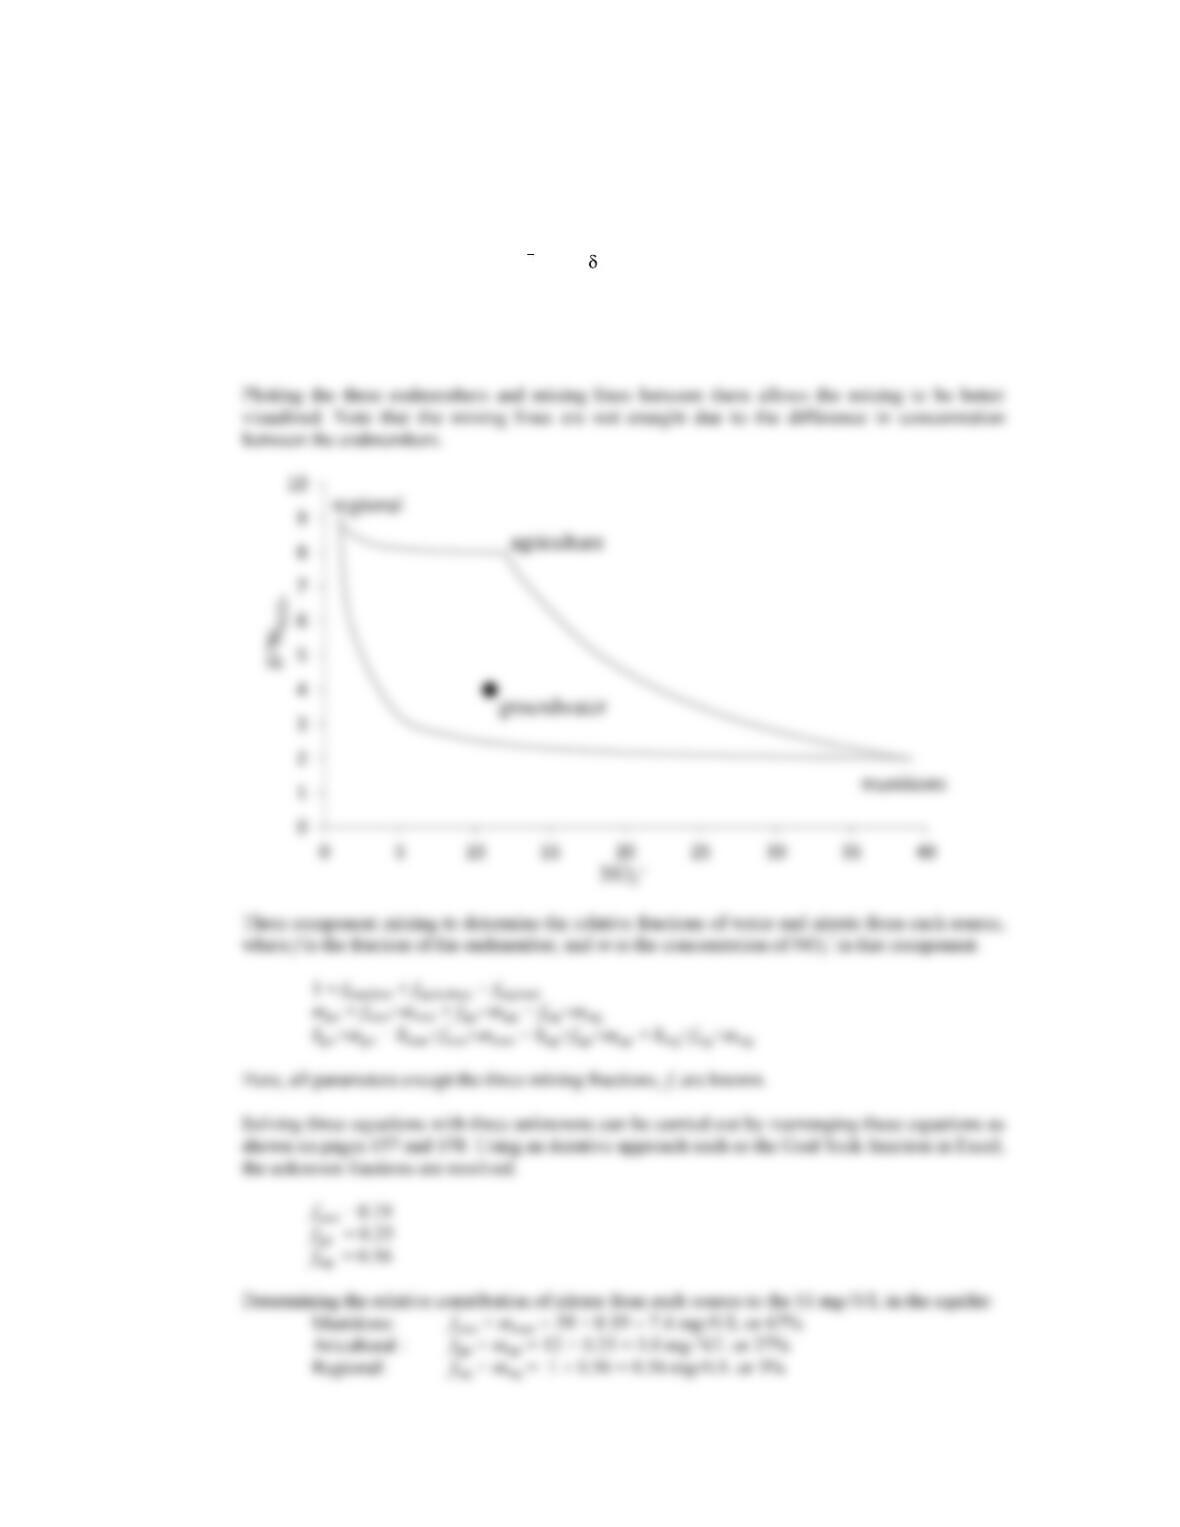
two piezometers completed in the sand and the bedrock are given here. Calculate the percent mixing of
the two sources of groundwater in the well for each month of monitoring.
Jan April Jul Oct
Shallow sand -12 -10 -8 -10
Deep bedrock -13 -13 -13 -13
Well -12.9 -11.8 -12 -12.1
Using the two component mixing formulae on page 154, the following percentages are calculated.
Note that the iterative solution for the two equations and two unknowns is simplified using the
Goal Seek routine in Excel. Simply put in a hard estimate for one unknown (e.g. fraction of sand
41
8. A munitions factory has been discharging nitrate to a shallow aquifer adjacent to an organic
agricultural field that uses only manure as fertilizer. Regional nitrate contributions from natural sources
also exist. The deep aquifer has nitrate concentrations that exceed the 10 mg-N/L drinking water
standard. Who is contributing nitrate to the deep aquifer nitrate problem and what is their fractional
contribution of water and of nitrate?
NO3
15
N
Munitions 39 2
Agriculture 12 8
Regional 1 9
Aquifer nitrate 11 4
42
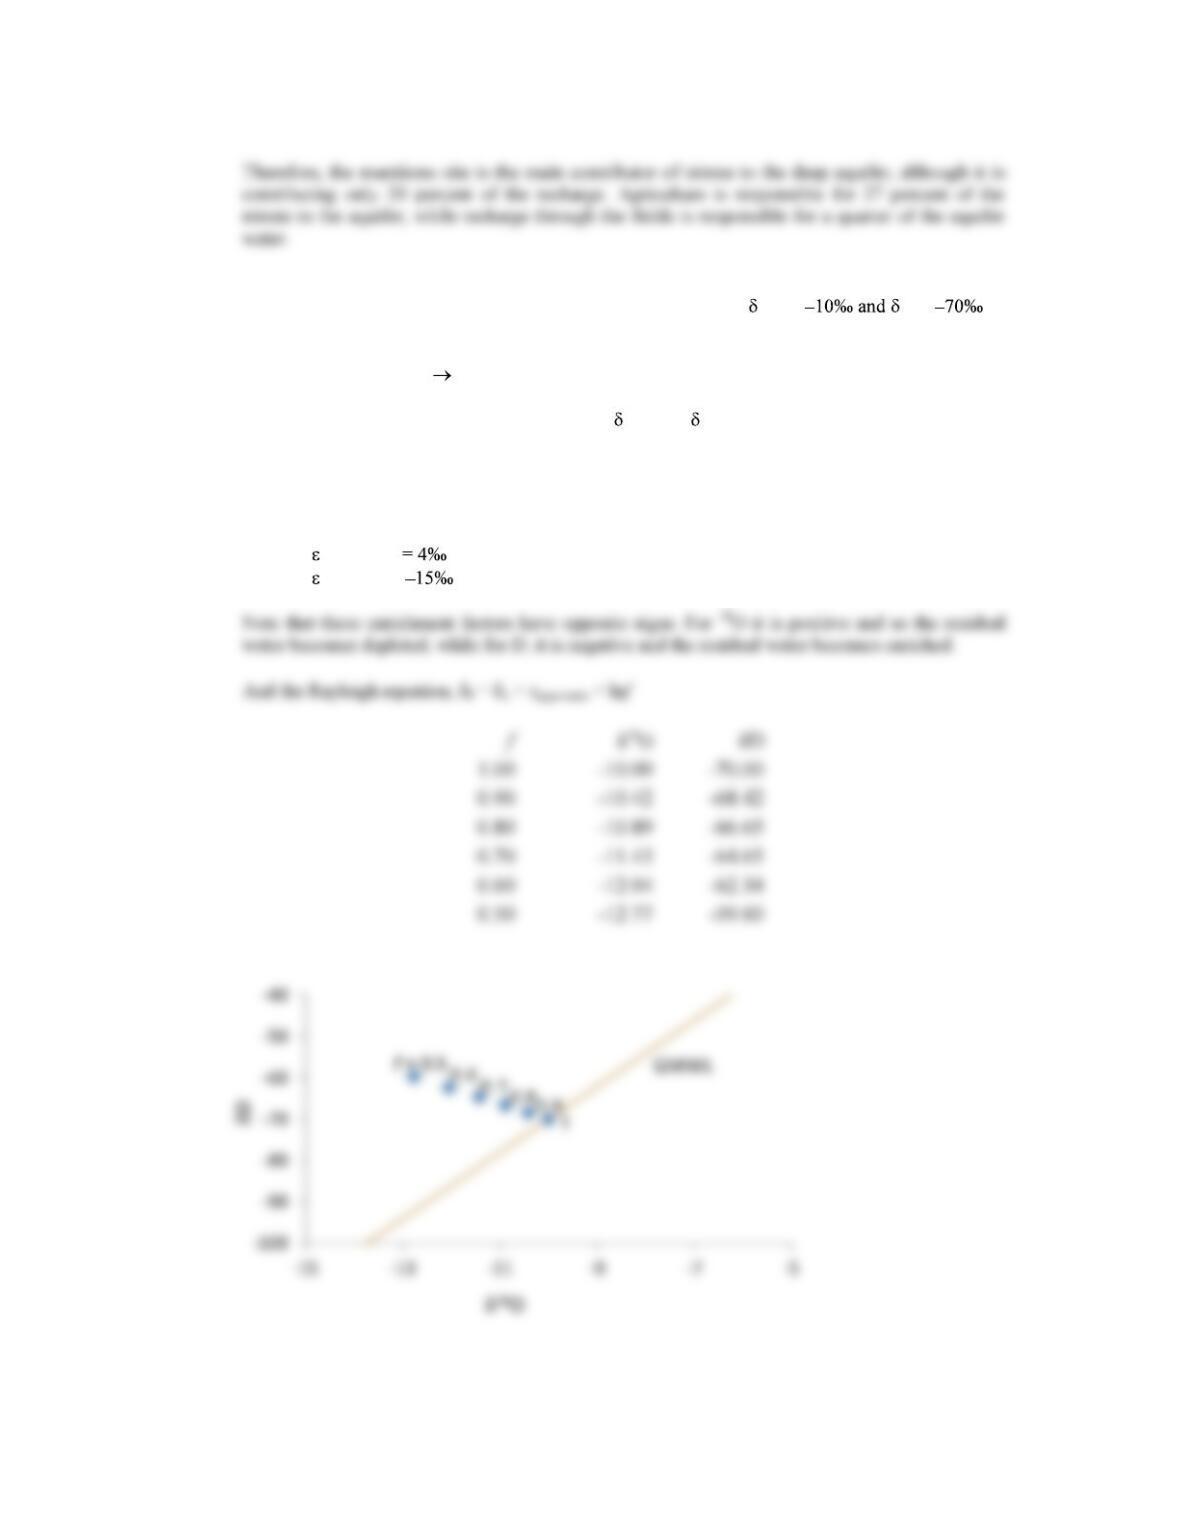
9. Groundwater at an ambient temperature of 25°C with initial values of 18O = D =
penetrates an aquitard rich in anhydrite.
2H2O + CaSO4 CaSO4·2H2O
Using a Rayleigh distillation, plot the trend in 18O and D as the water reacts to form gypsum,
losing up to 50% of its mass to form the hydration waters.
Using the enrichment factors for water and gypsum in Table 4.2,
18Ogyp-water
and Dgyp-water =