6.1 a. A primary standard is an enforceable limit on the concentration of a
contaminant in water or an enforceable requirement that a particular treatment
b. An MCL is a primary standard, whereas an MCLG is a maximum
concentration goal for a drinking water contaminant, which would be desirable
6.2 The CWA sets up a system by which the maximum concentration of contaminants
in discharges to surface waters and in the surface waters themselves are set and
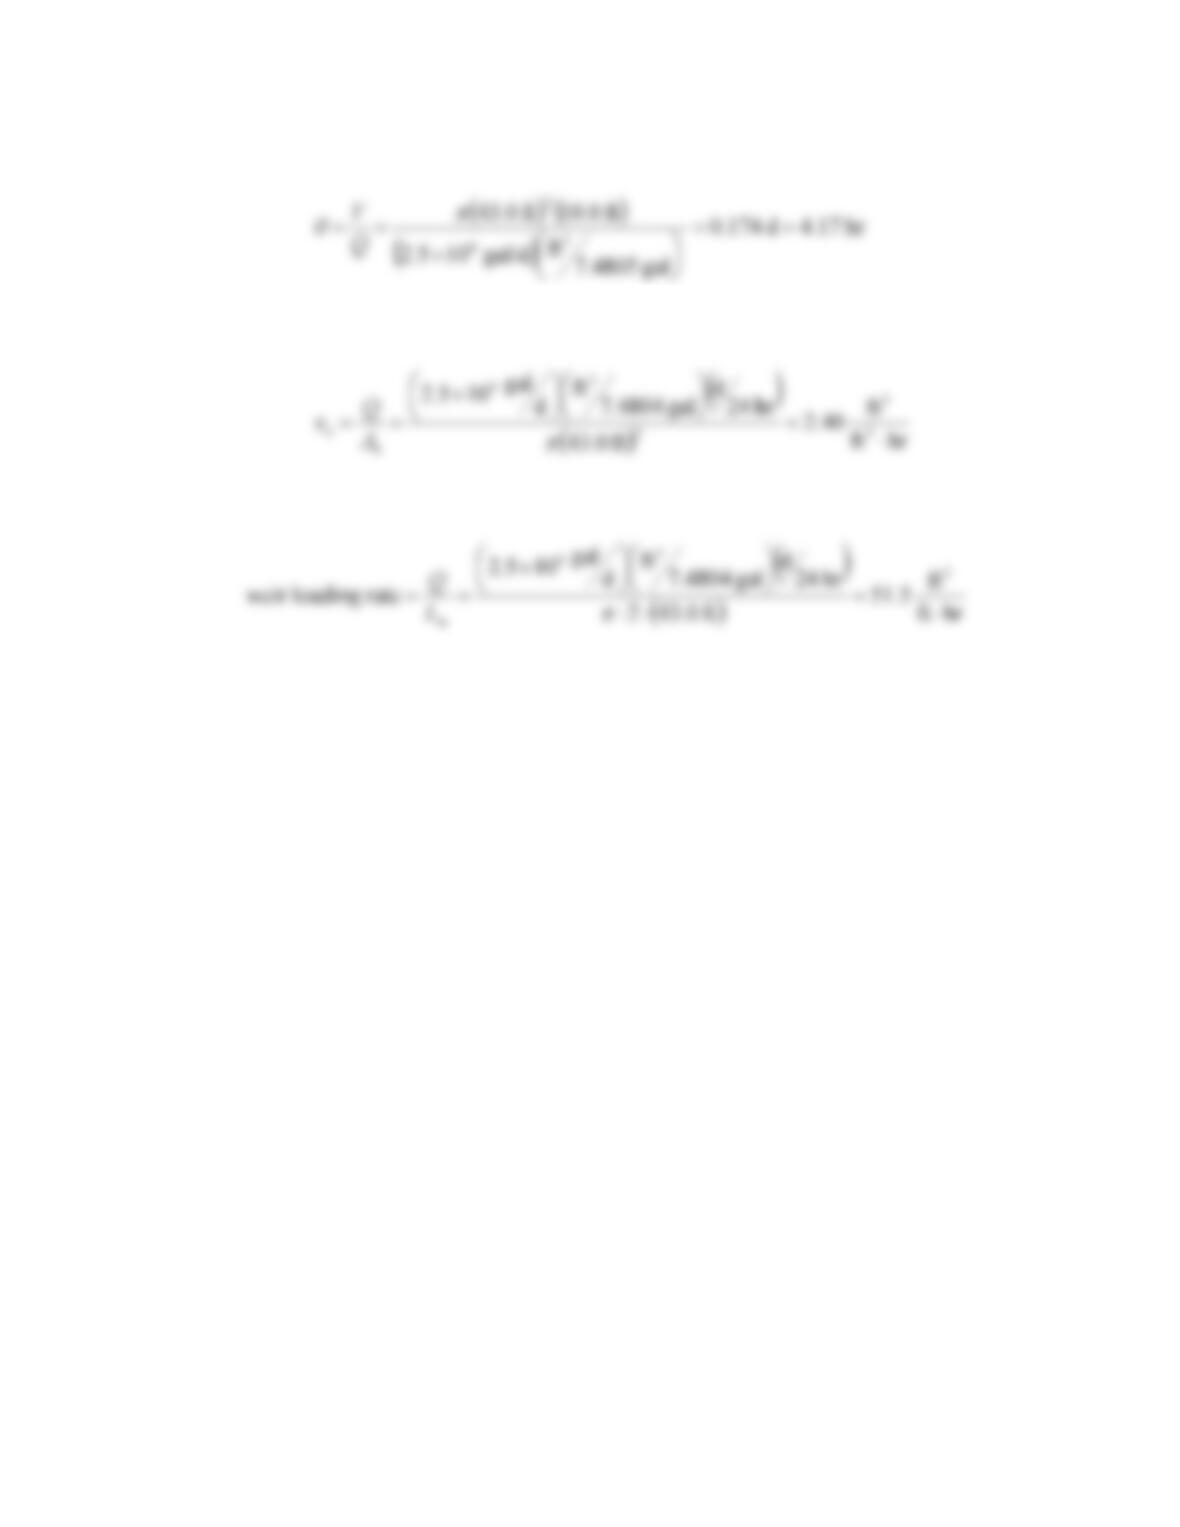
6.3 a. The hydraulic detention time is:
b. The critical velocity is:
c. The weir loading rate is:
6.4 From Appendix C: At 20°C,
ρ
= 998.2 kg·m-3 and
μ
= 0.00100 kg·m-1·s-1
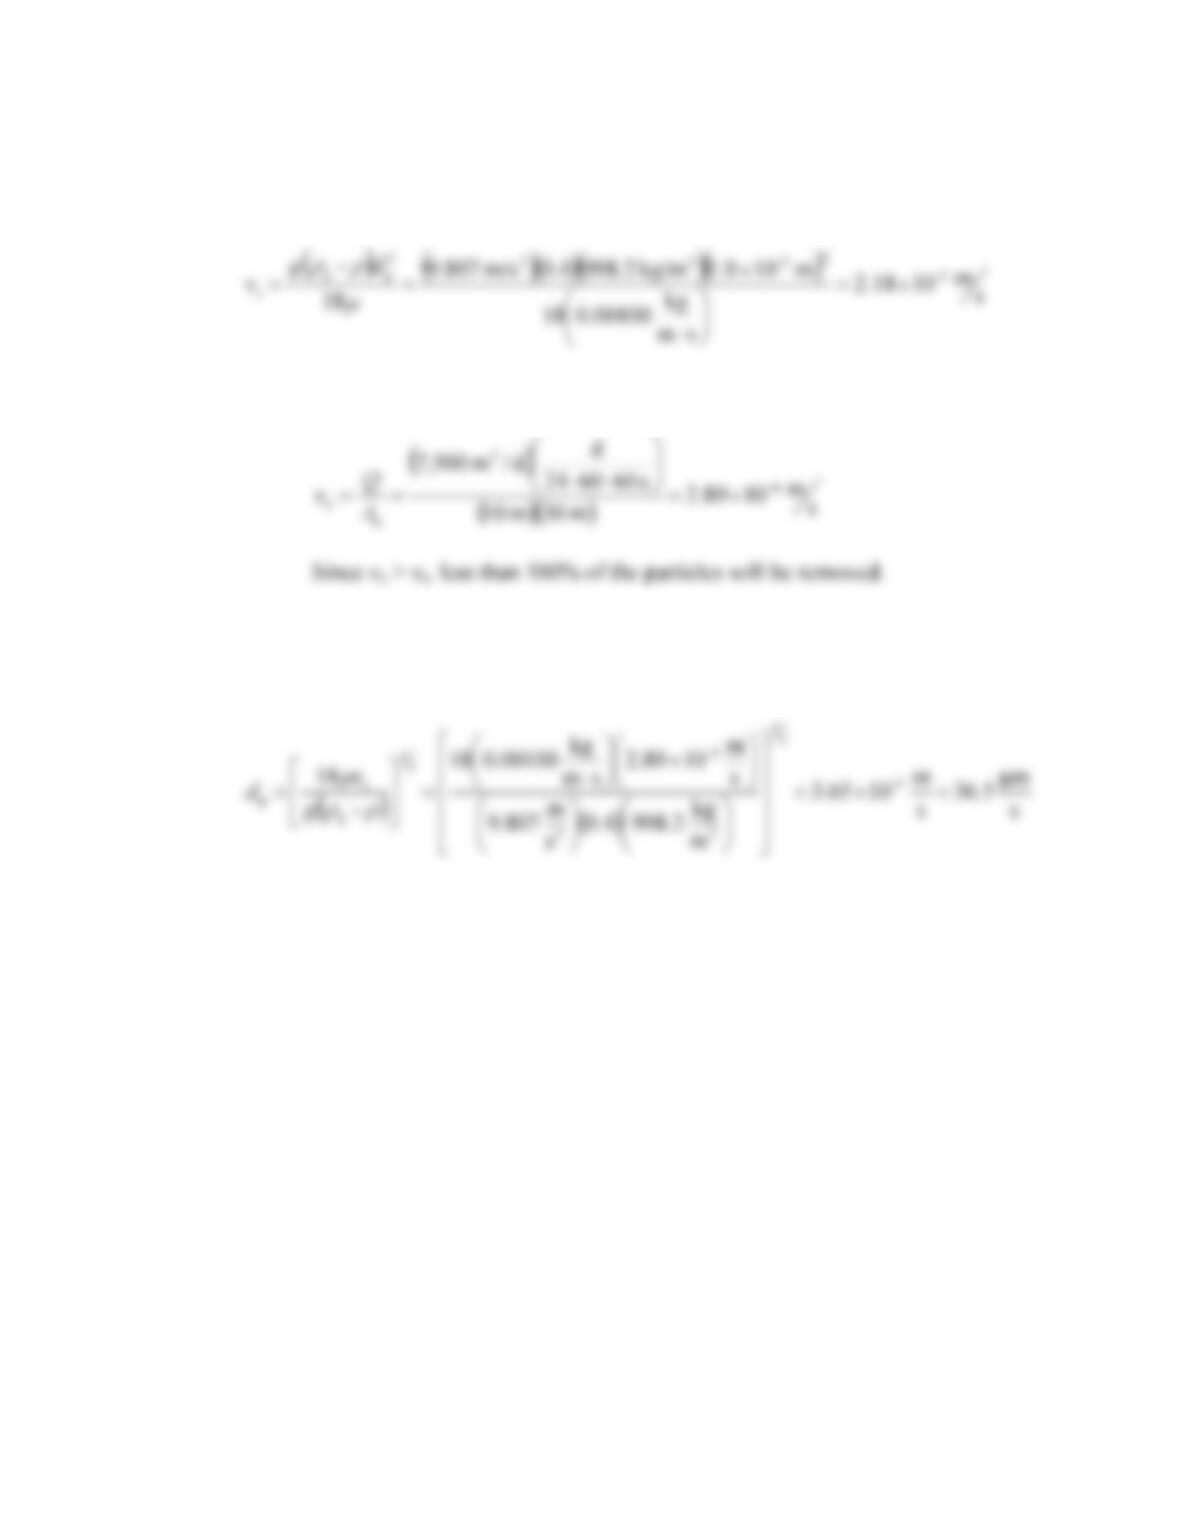
a. The particle settling velocity is:
b.
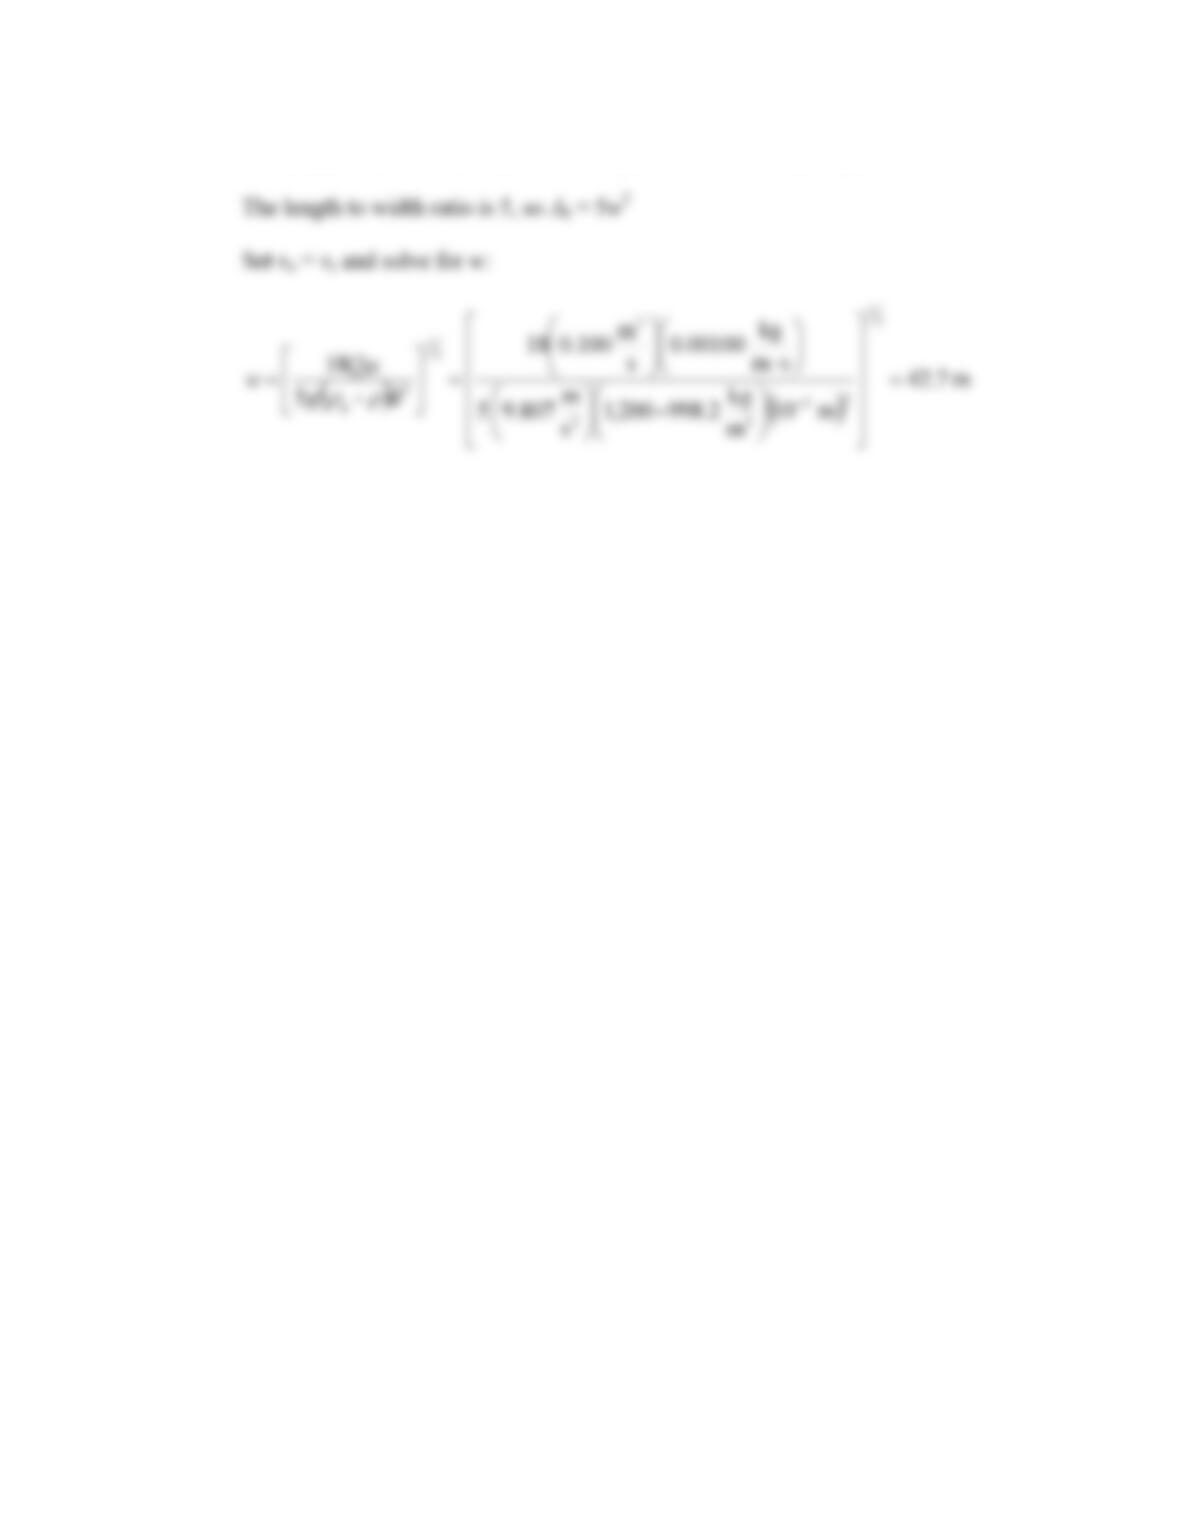
c. The settling velocity of the smallest particle which is 100% removed is equal
to vo. So,
6.5 From Appendix C: At 20°C,
ρ
= 998.2 kg·m-3 and
μ
= 0.00100 kg·m-1·s-1
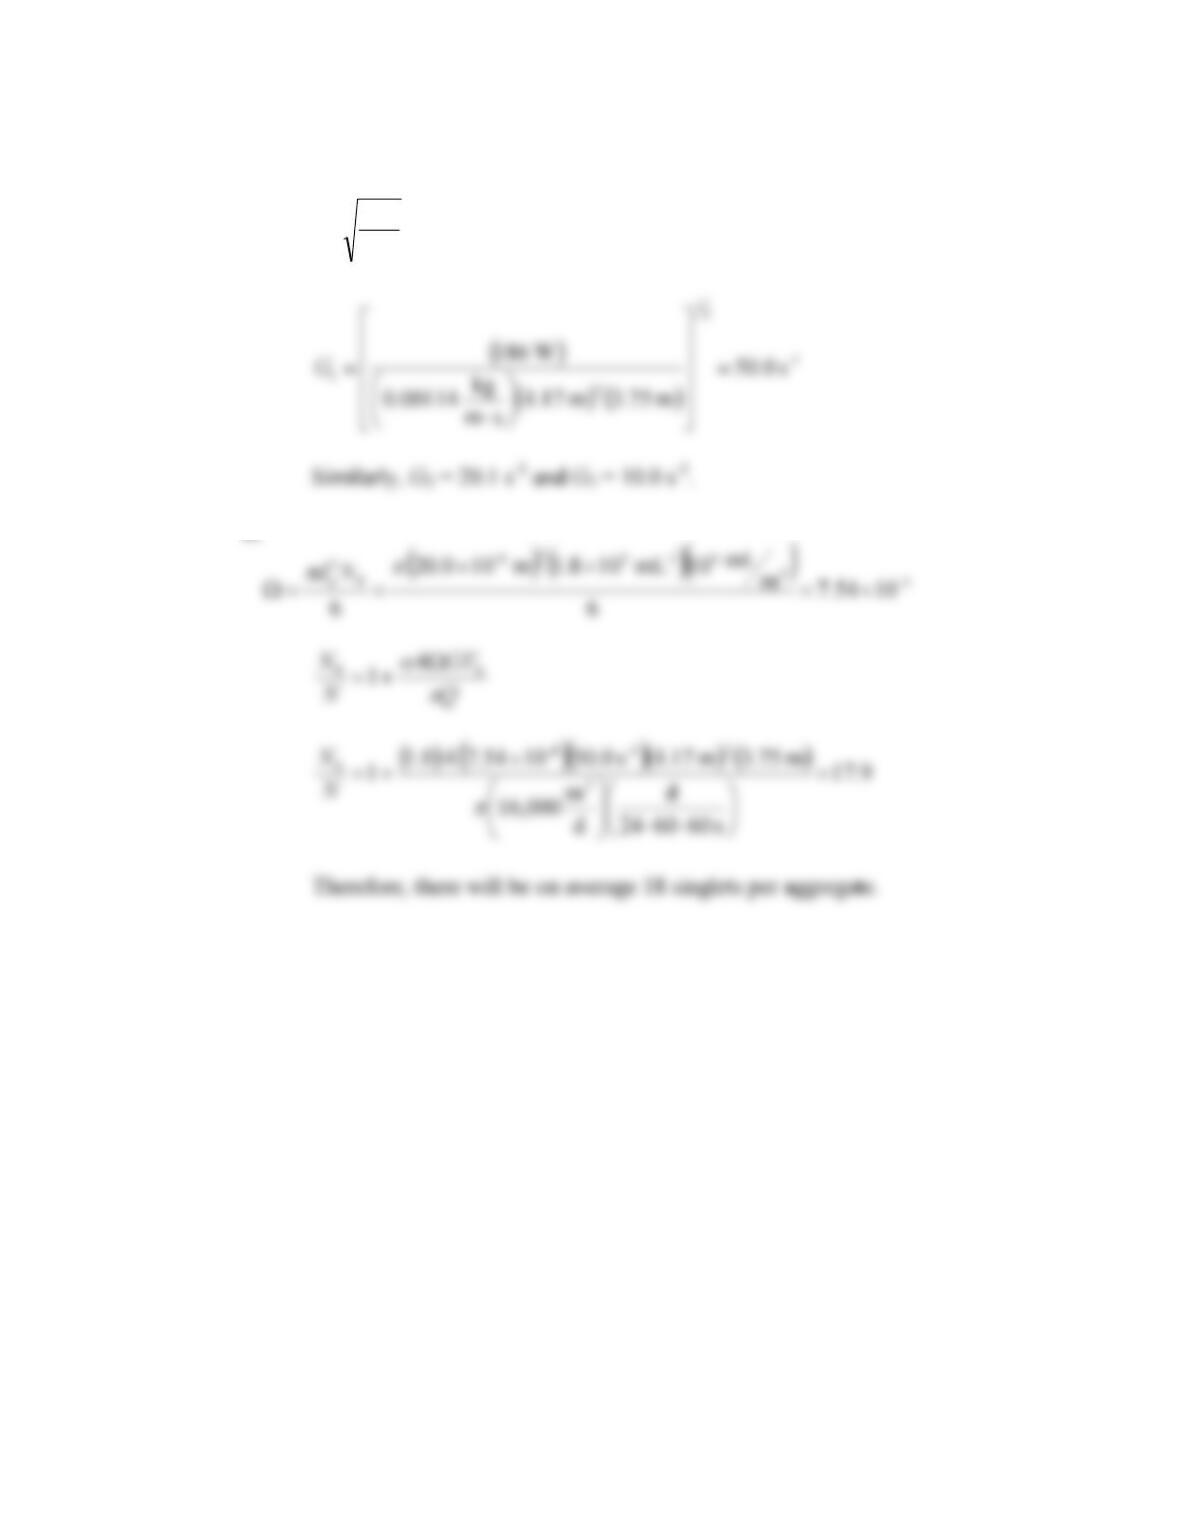
6.6 From Appendix C: At 15°C,
μ
= 0.00114 kg·m-1·s-1
a.
b
V
P
G
μ
=
b.
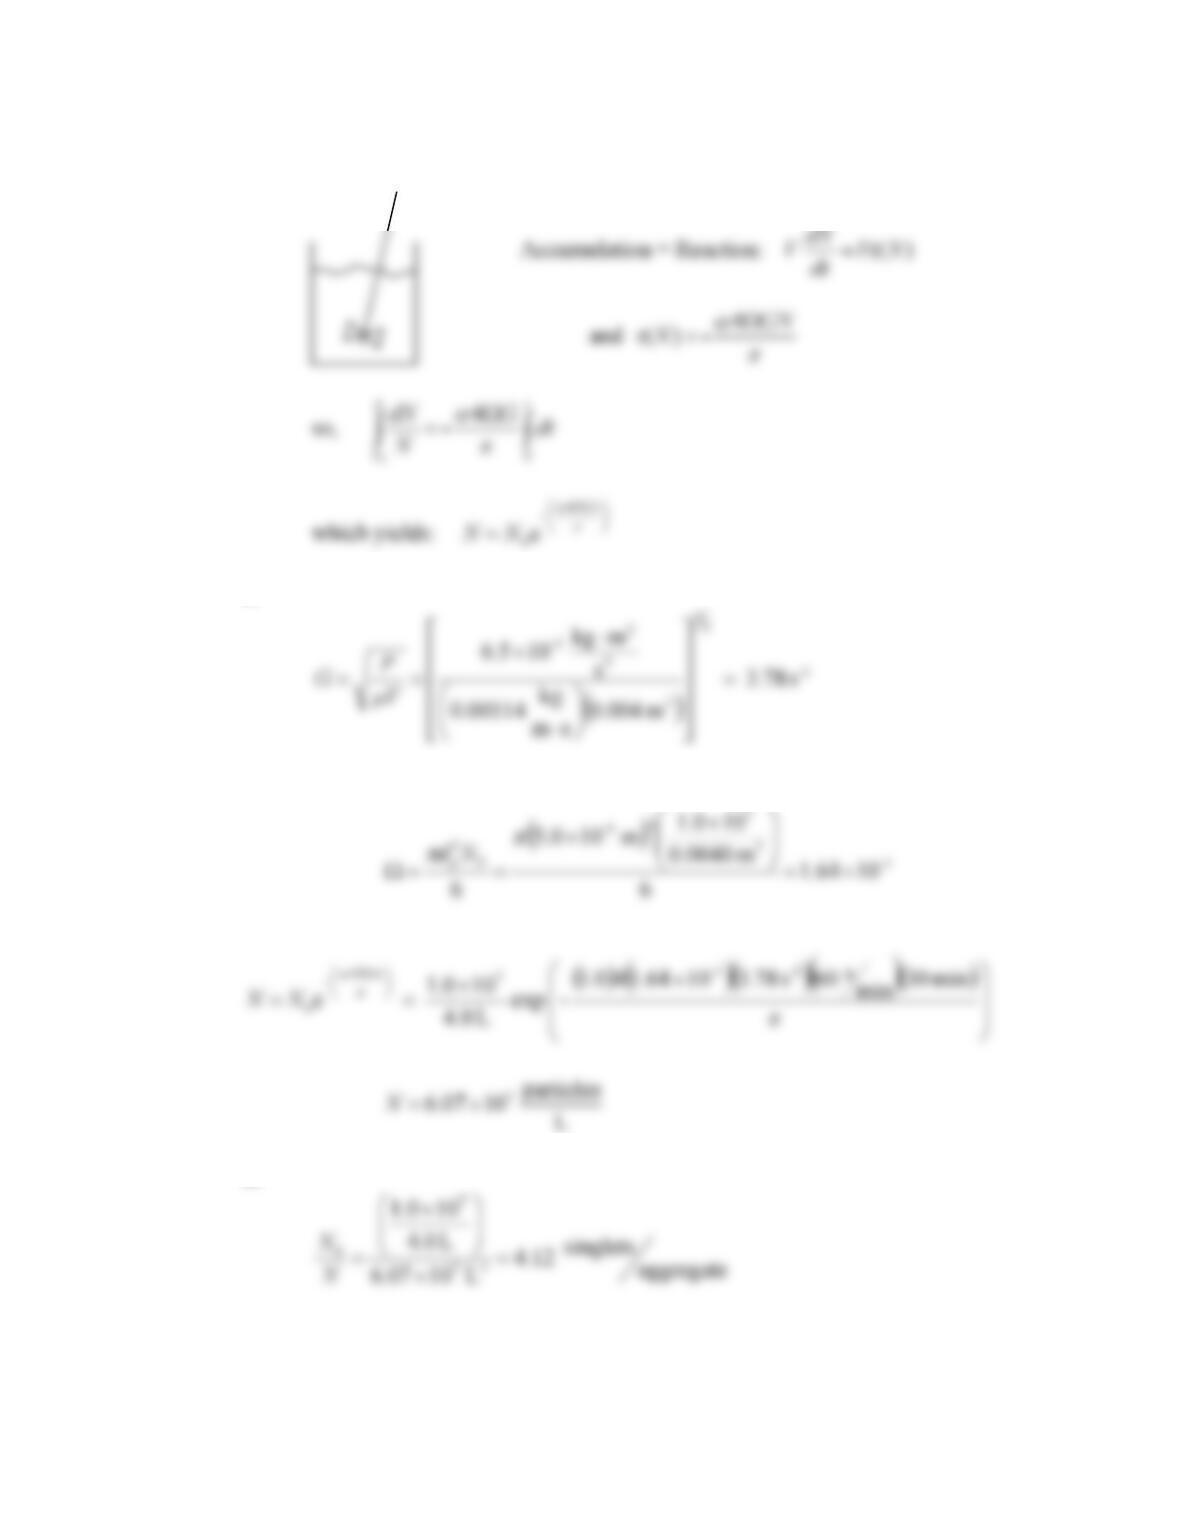
6.7 From Appendix C: At 15°C,
μ
= 0.00114 kg·m-1·s-1
a.
b.
c.
d.
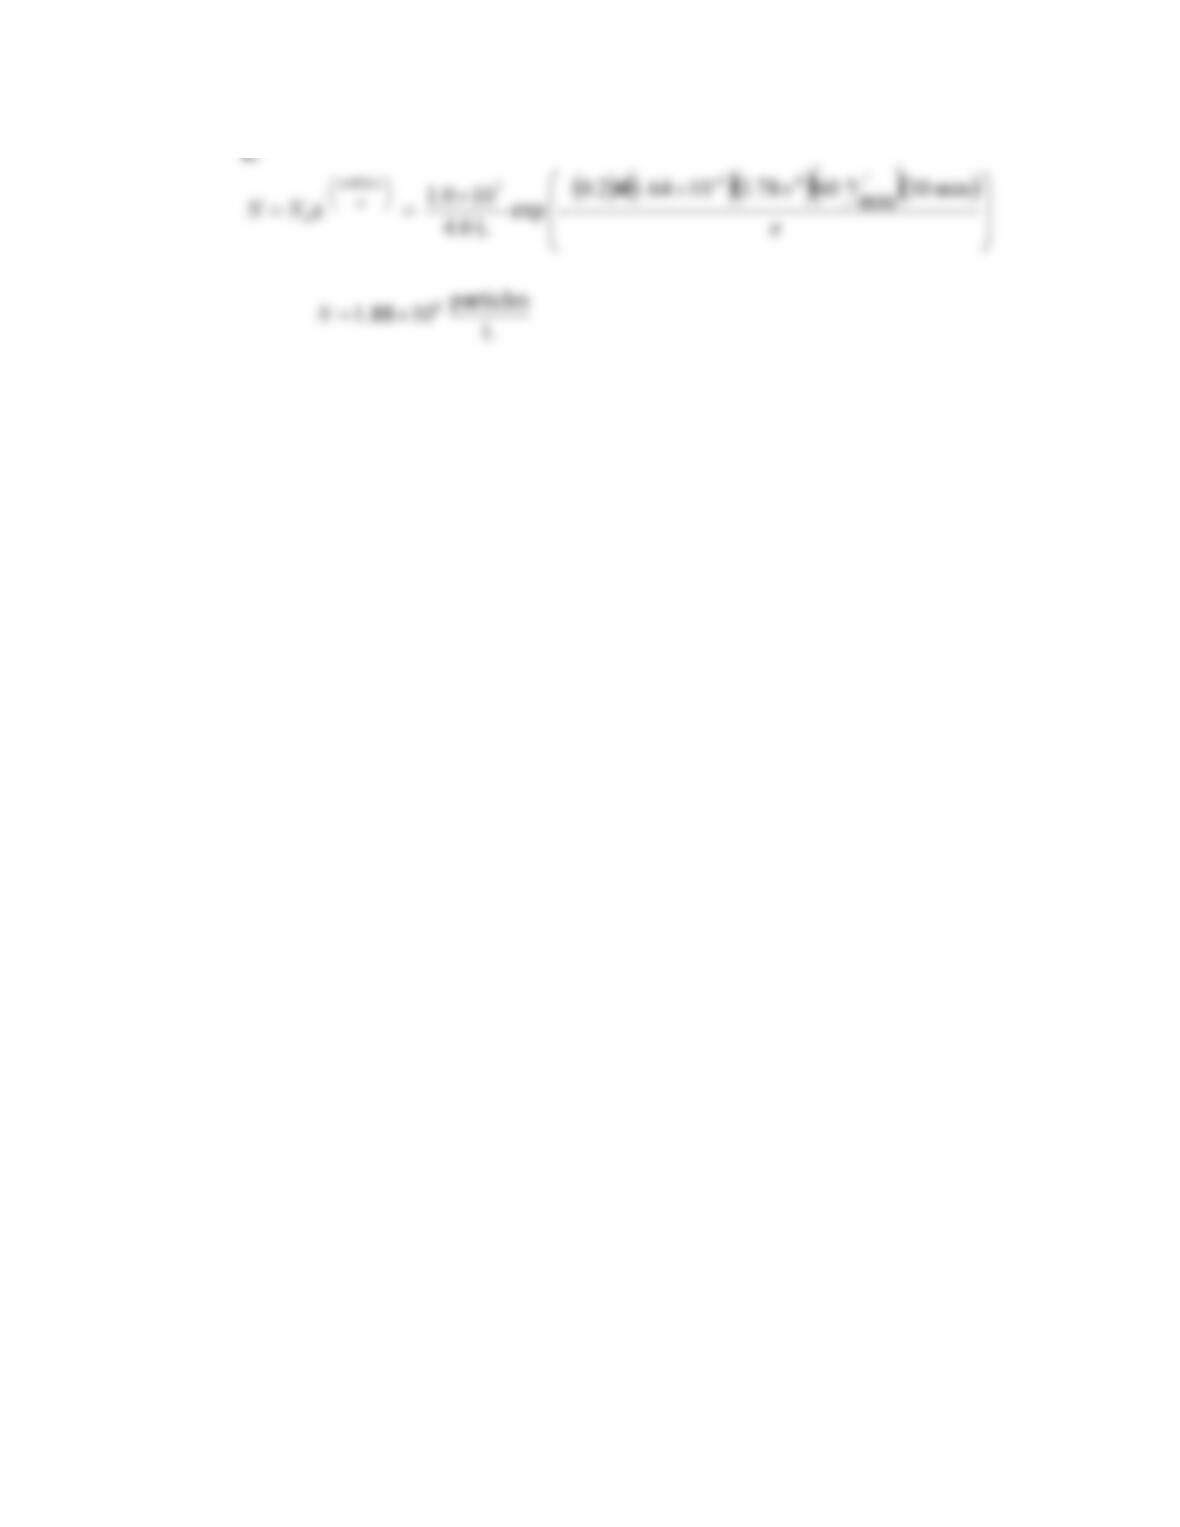
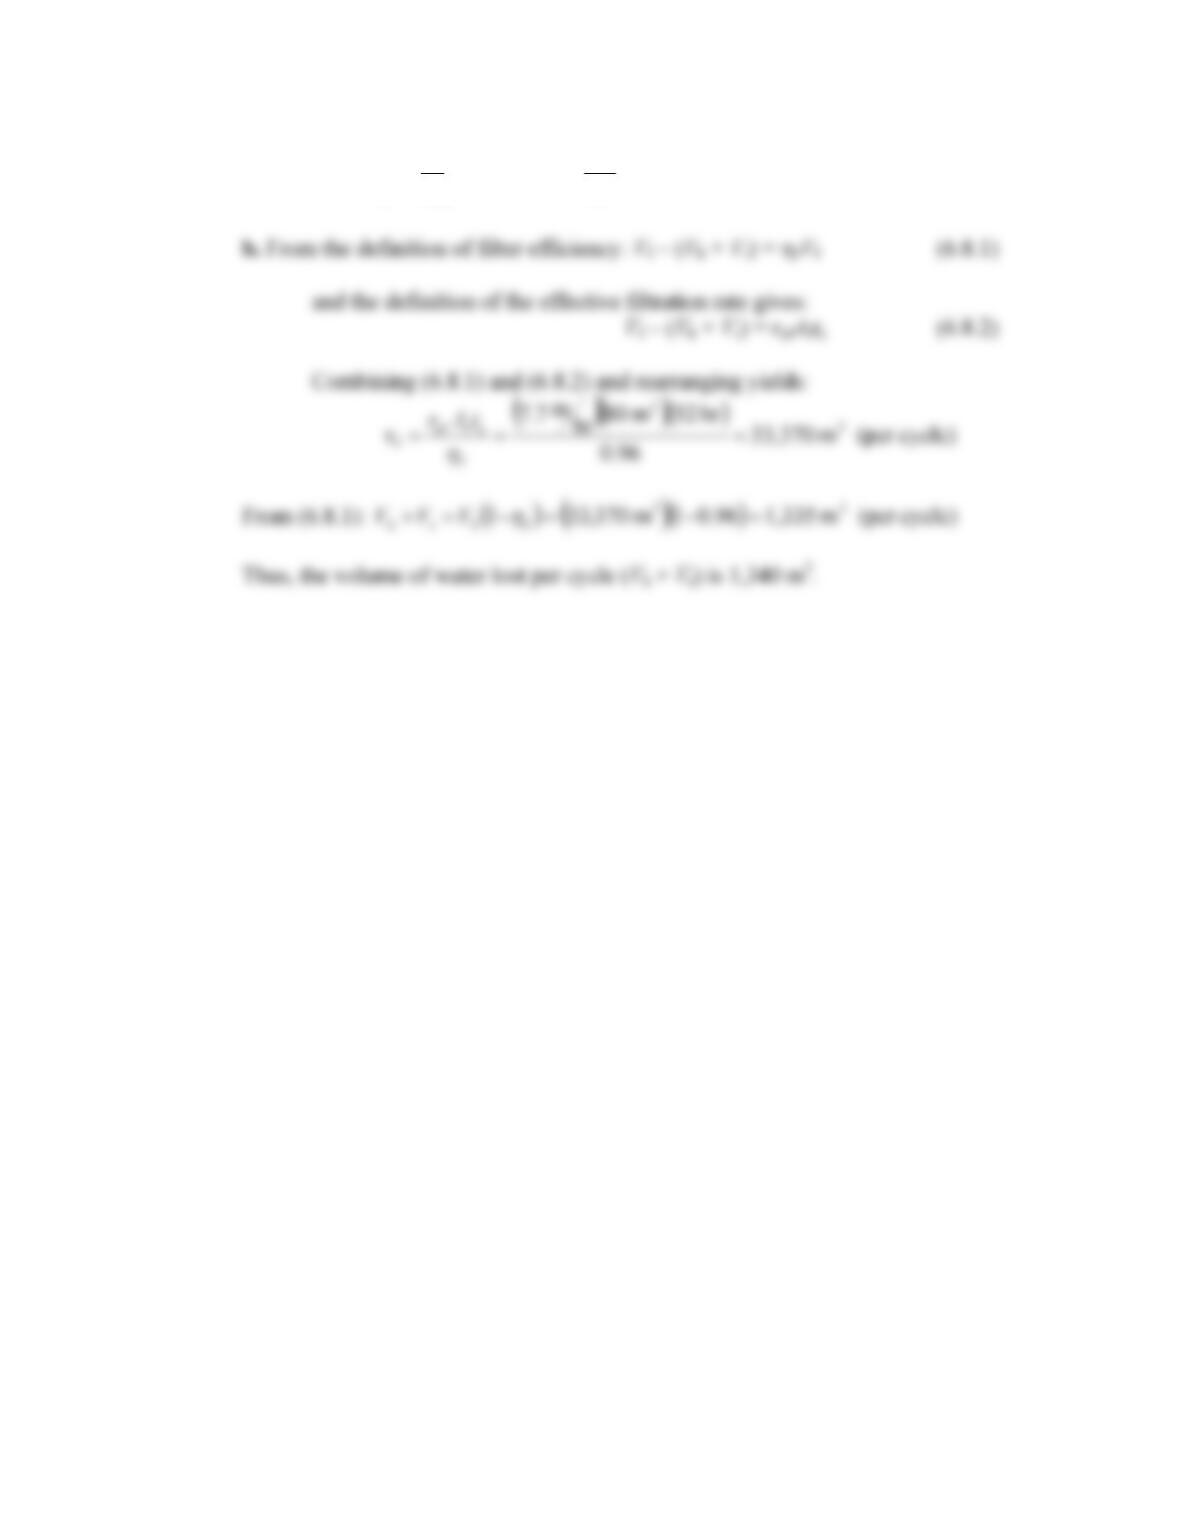
6.8 a.
()
hr
m
640 m 80
hr
m
8.0
3
2
fa =
⎟
⎠
⎞
⎜
⎝
⎛
== AvQ
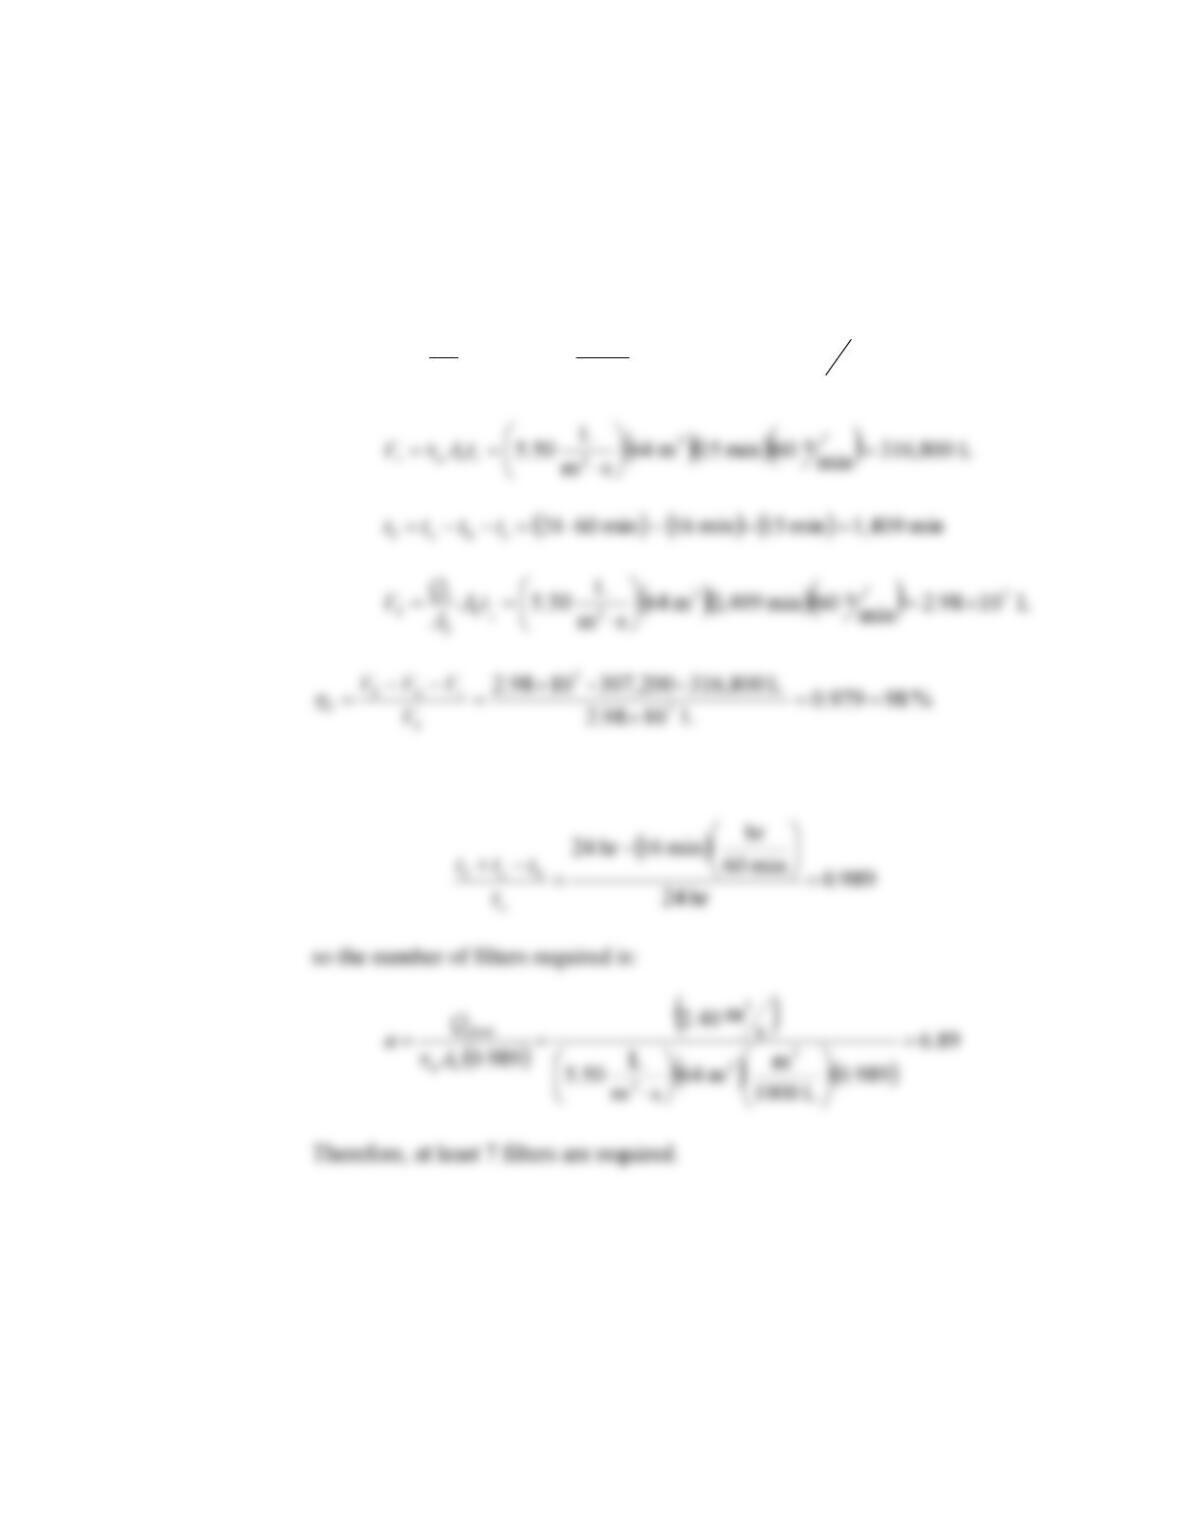
6.9 Note that this problem incorporates a practically realistic, yet possibly confusing,
nuance in that the total backwash time per cycle (tb) is double the total time that
backwash water is flowing through the filter (tb’). Thus, calculation of the water
volume used in backwash is based on 8 minutes of flow per cycle, whereas the
time the filter is off-line for backwashing is 16 minutes.
a.
()
()
(
)
L 307,200
min
s
60min 0.8m 64
sm
L
10.0 2
2
‘
bf
f
b
b=
⎟
⎠
⎞
⎜
⎝
⎛
⋅
== tA
A
Q
V
b. The fraction of a filtration cycle that is not backwashing is:
(
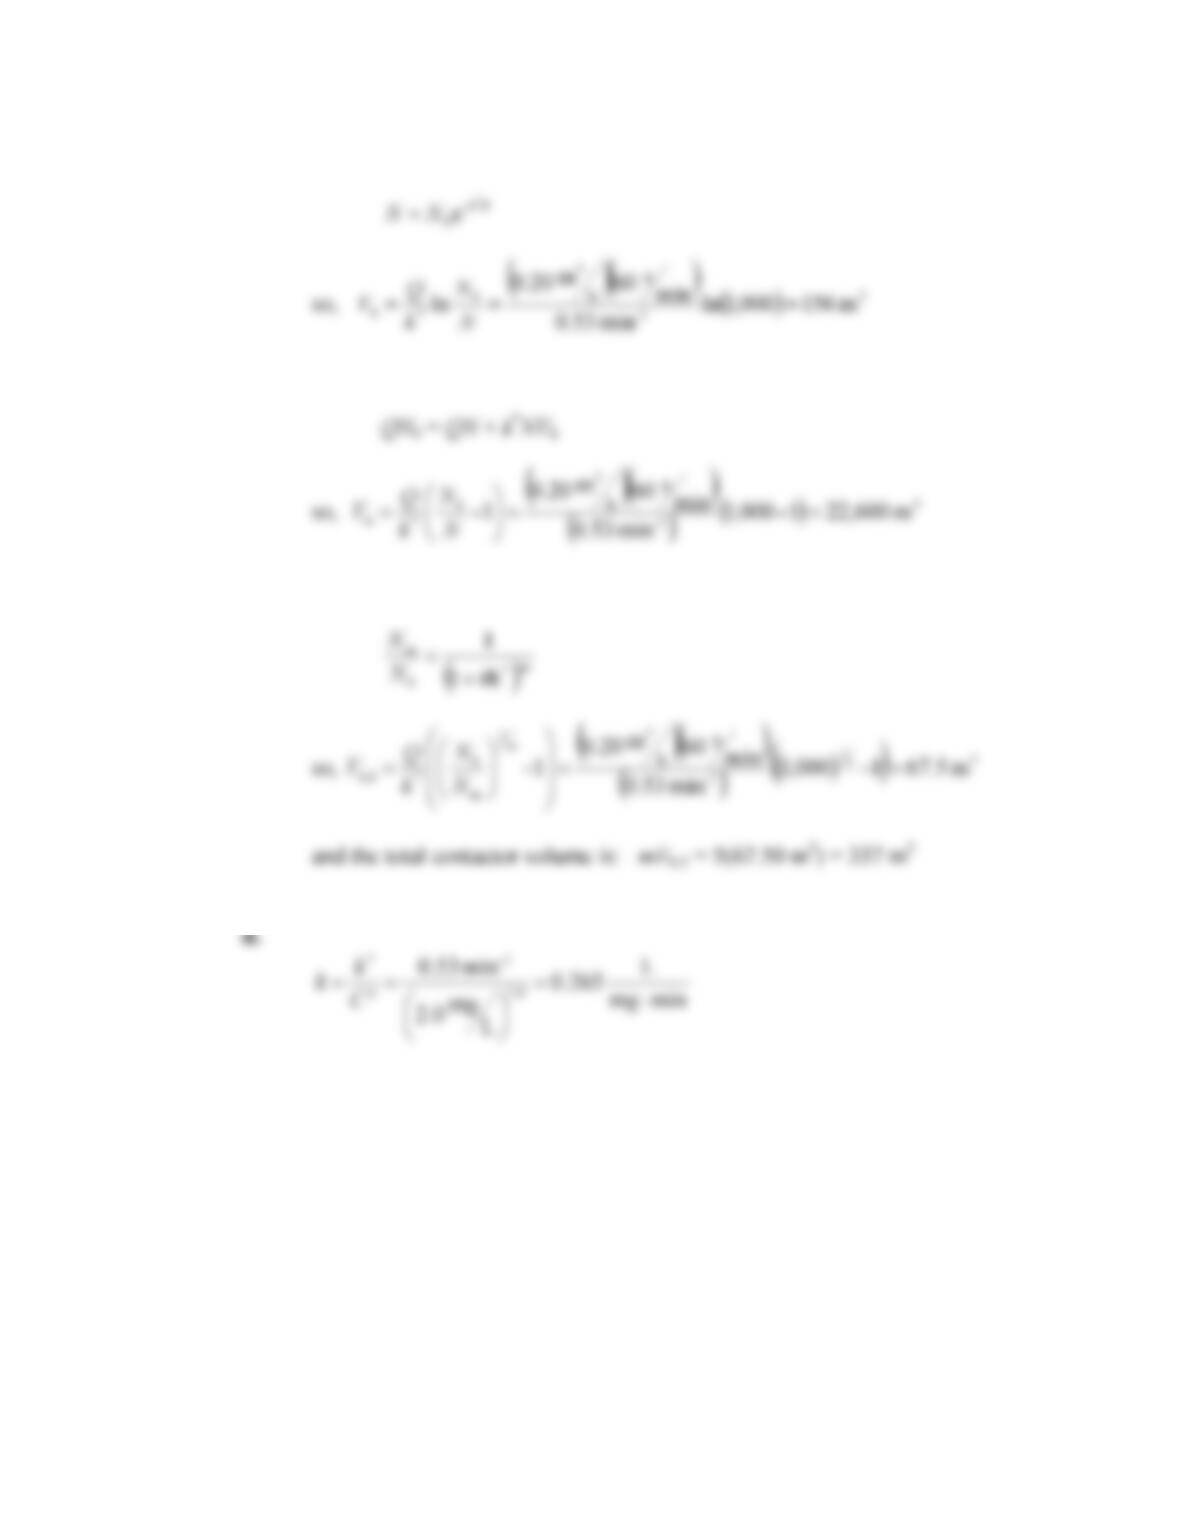
6.10 a. For a steady state PFR, the Giardia concentration in the contactor effluent is:
b. For a steady state CSTR, the mass balance is:
c. For a steady state series of CSTRs, the mass balance is:
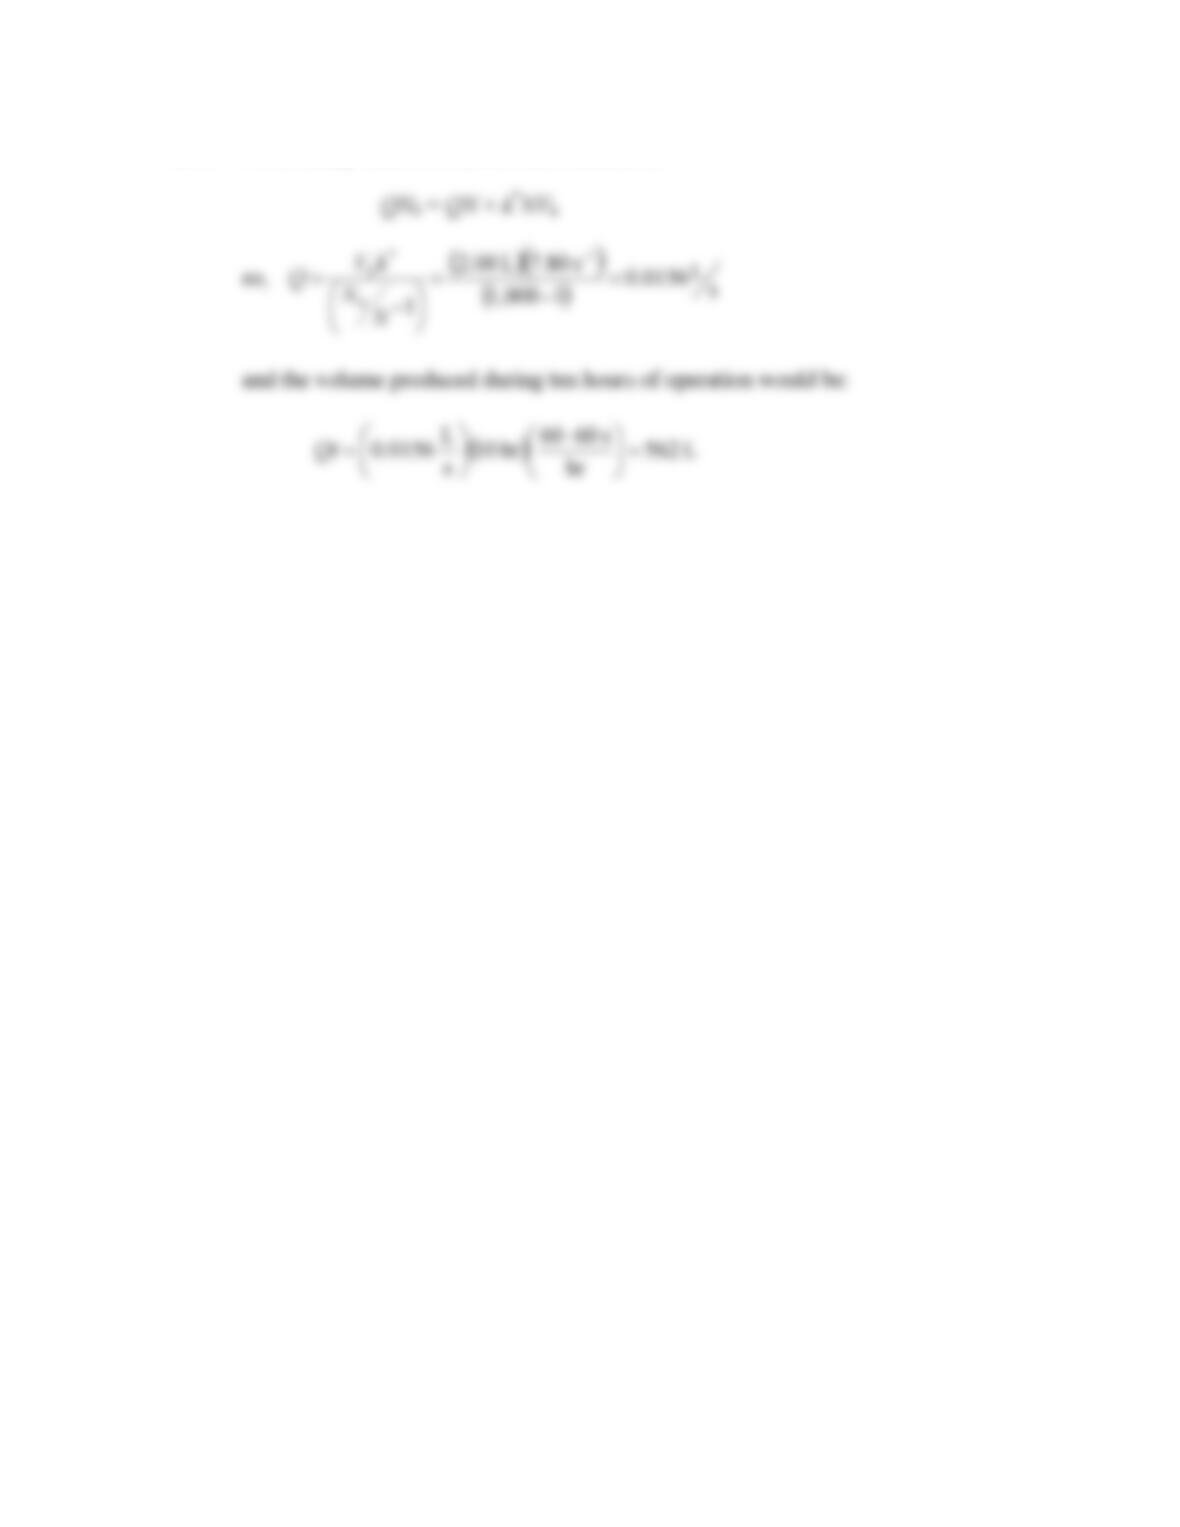
6.11 For a steady state CSTR, the mass balance is:
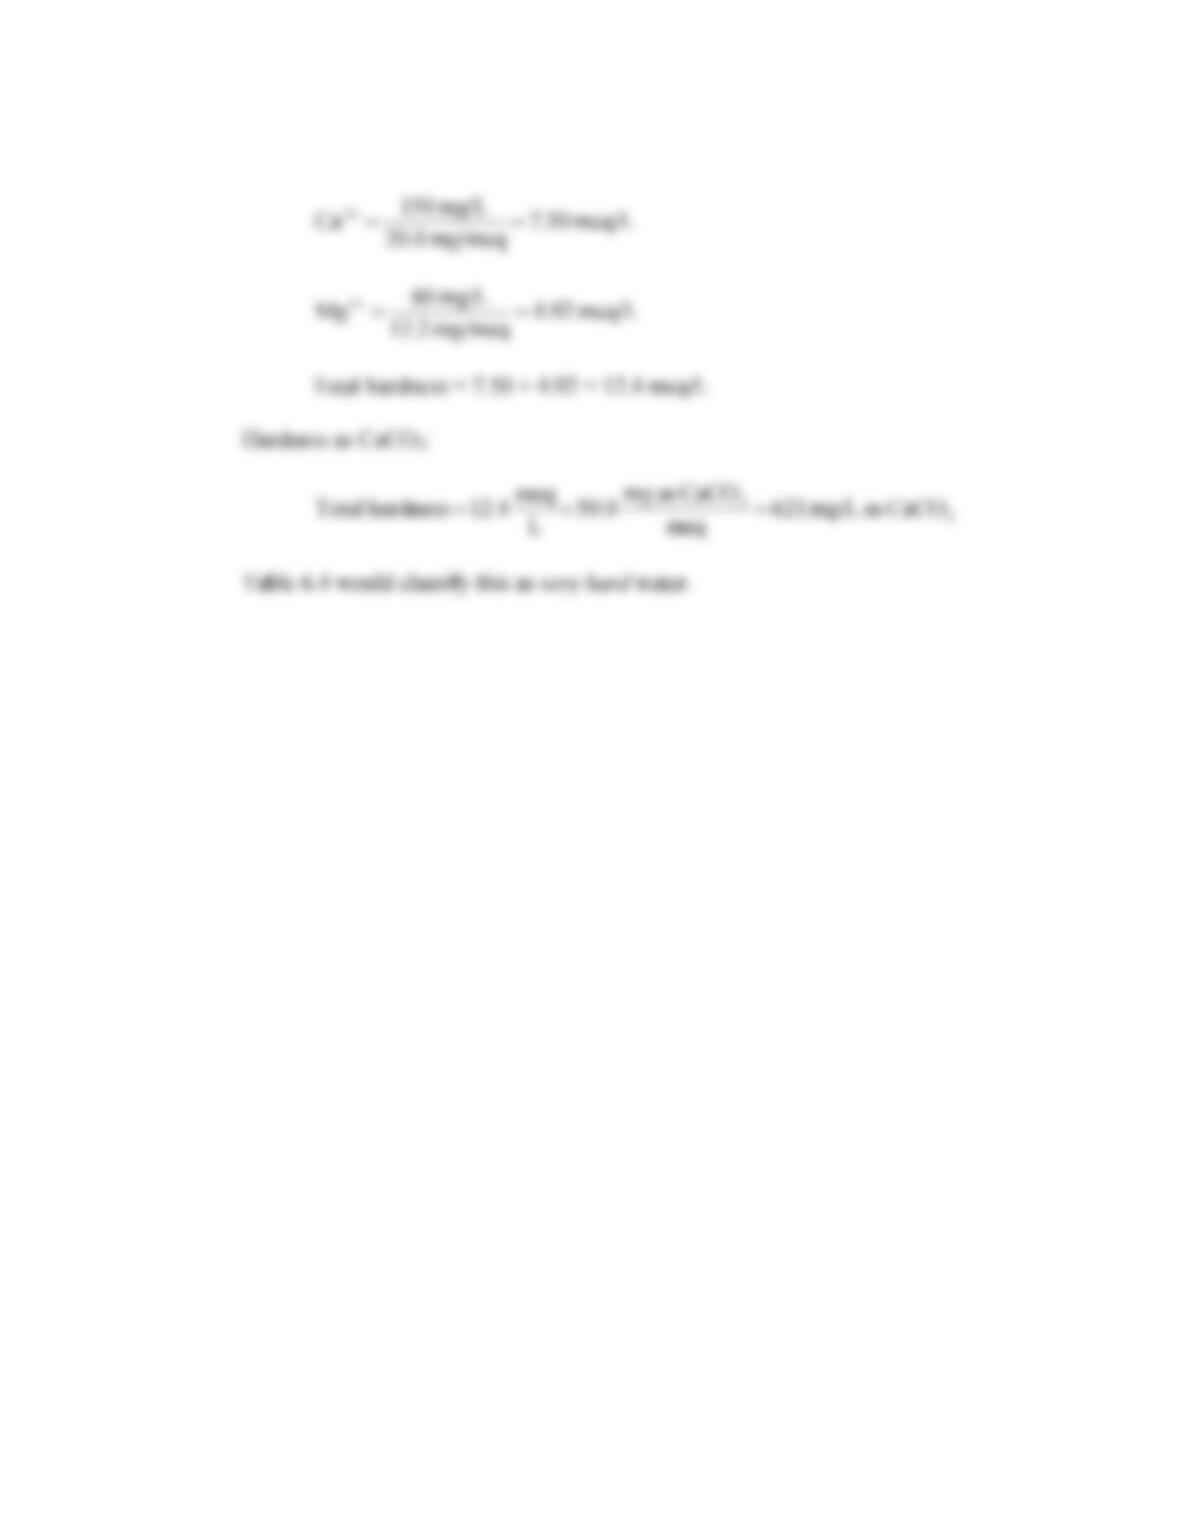
6.12 Hardness in meq/L:
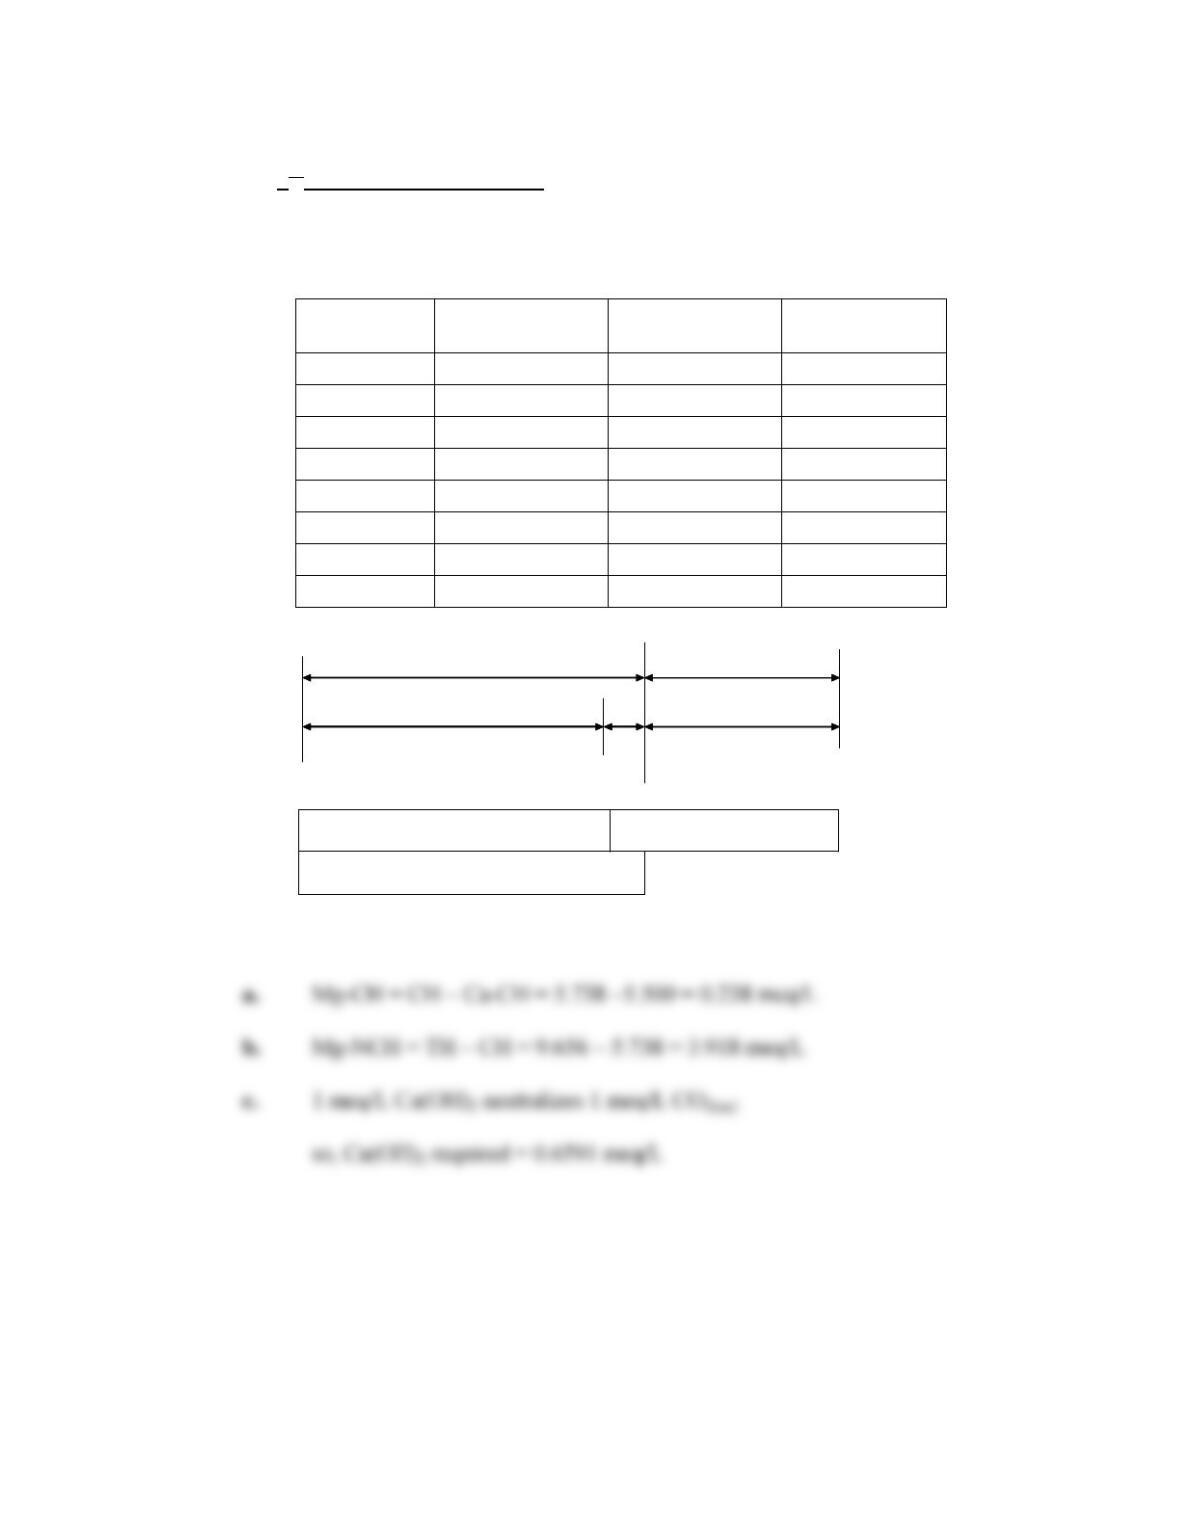
6.13 – 6.16 The solutions for these problems are the solutions for problems 6.2 – 6.5 in
the 2nd edition Solutions Manual.
6.17
Component Concentration
(mg/L)
Equiv. Weight
(mg/meq)
Concentration
(meq/L)
CO214.5 22 0.6591
Ca2+ 110.0 20 5.500
Mg2+ 50.7 12.2 4.156
Na+75 23.0 3.261
HCO3–350 61.0 5.738
SO42- 85.5 48.0 1.781
Cl–16.2 35.5 0.4563
pH 8.2 – –
9.656
5.738
0
5.500
0
Ca2+
HCO3–
CH
Mg2+
Ca–CH
NCH
Mg–NCH
9.656
5.738
0
5.500
0
Ca2+
HCO3–
CH
Mg2+
Ca–CH
NCH
Mg–NCH
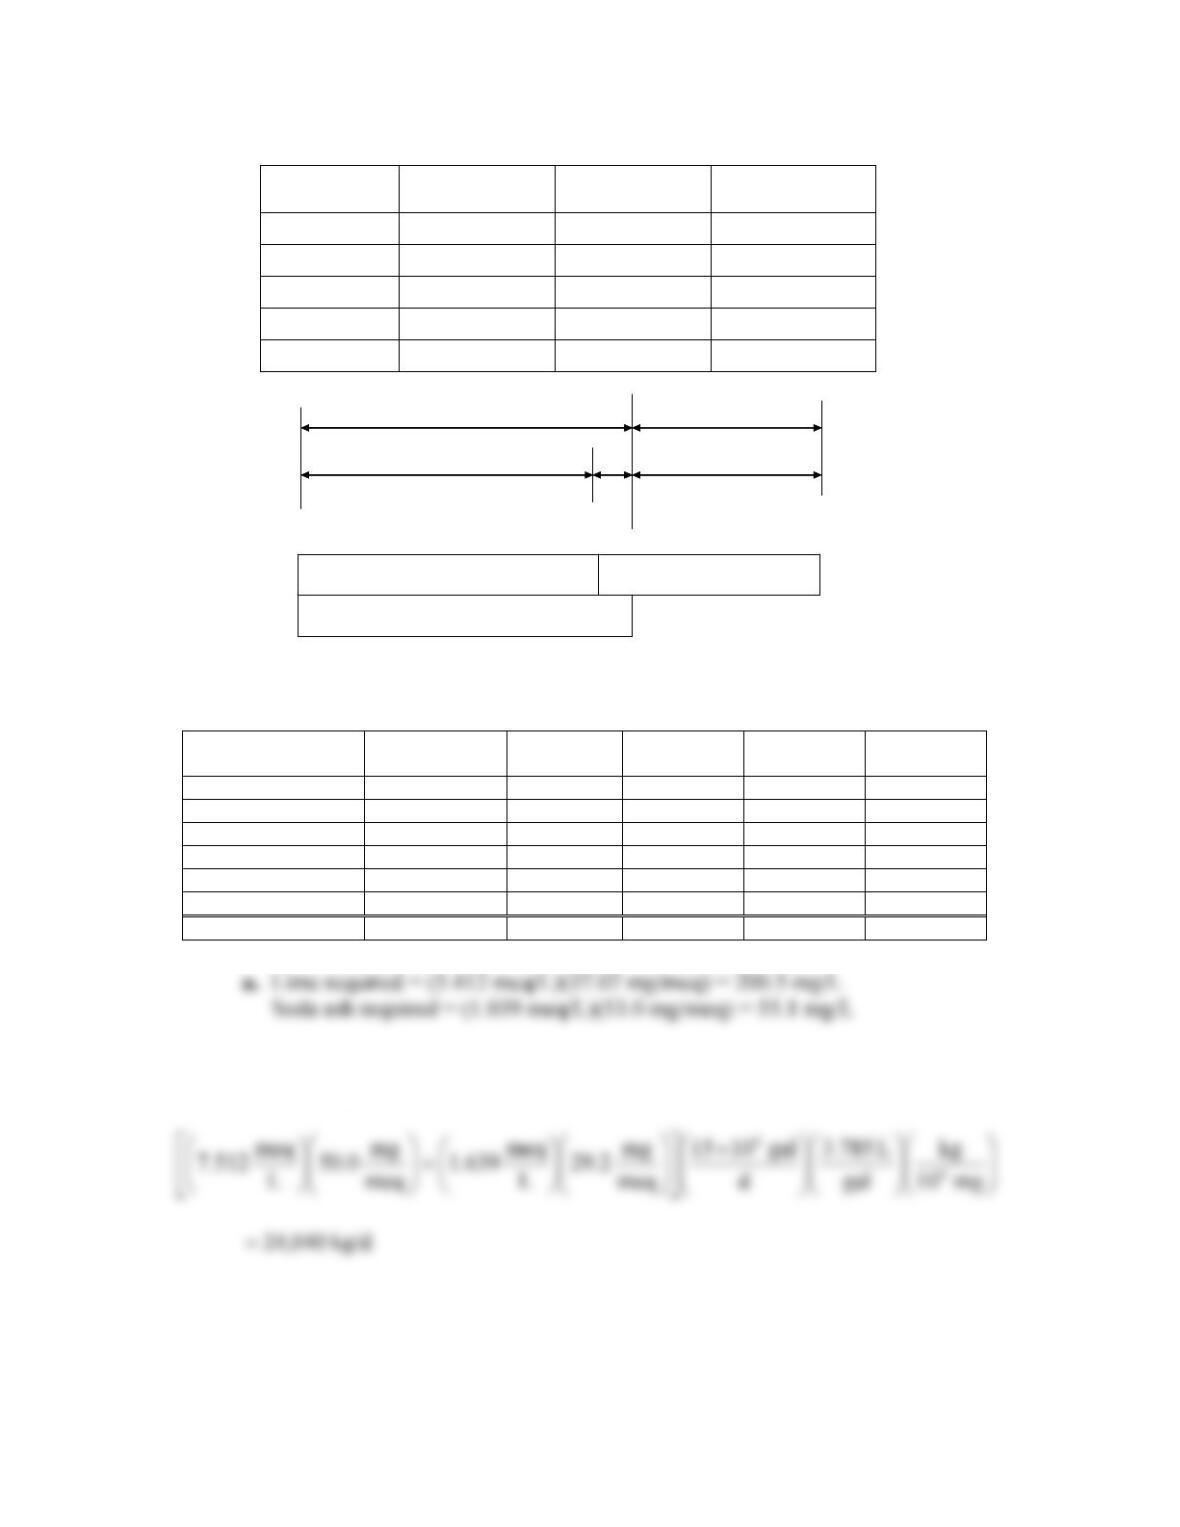
6.18
Component Concentration
Equiv. Weight
(mg/meq)
Concentration
(meq/L)
CO26.0 mg/L 22 0.2727
Ca2+ 50.0 mg/L 20 2.500
Mg2+ 20.0 mg/L 12.2 1.639
HCO3
–3.1 mmole/L 61.0 3.100
pH 7.6 – –
4.139
3.100
0
2.500
0
Ca2+
HCO3–
CH
Mg2+
Ca–CH
NCH
Mg–NCH
4.139
3.100
0
2.500
0
Ca2+
HCO3–
CH
Mg2+
Ca–CH
NCH
Mg–NCH
Table P6.18 Components, lime and soda ash dosage, and solids generated
Component (eq’n.) Concentration
(meq/L)
Lime
(meq/L)
Soda ash
(meq/L)
CaCO3(s)
(meq/L)
Mg(OH)2(s)
(meq/L)
CO2(aq) (6.37) 0.2727 0.2727 0 0.2727 0
Ca-CH (6.38) 2.500 2.500 0 5.000 0
Mg-CH (6.39) 0.600 1.200 0 1.200 0.600
Ca-NCH (6.40) 0 0 0 0 0
Mg-NCH (6.41) 1.039 1.039 1.039 1.039 1.039
Excess 0.400
Totals 5.412 1.039 7.512 1.639
b. Sludge generated: