1
The Atmospheric Circulation System
Learning Objectives
After reading this chapter, students should be able to:
• Know why the incoming solar energy varies with latitude and season.
• Know what buoyancy is and how it is controlled.
• Know what the Coriolis Effect is.
• Know the major characteristics of the atmospheric circulation, why they occur, and
how they affect the transport of energy and material around the globe.
• Have a basic understanding of the various physical processes occurring in the
atmosphere..
• Understand why Earth experiences different seasons throughout the year.
• Understand the concepts of thermal conductivity and heat capacity.
• Know how water vapor and clouds play a dominant role in global energy.
• Know why weather and climate varies across the globe.
Review Questions
1.) What are the functions of the global circulatory system?
Earth’s global circulatory systems help to maintain the planet in thermal and
2.) Explain why the distribution of solar energy varies with latitude.
Due to the curvature of Earth, the radiation reaching Earth at high latitudes is
3.)
a. Draw a graph showing the variation of incoming solar energy and outgoing
infrared radiation with latitude.
CHAPTER
4
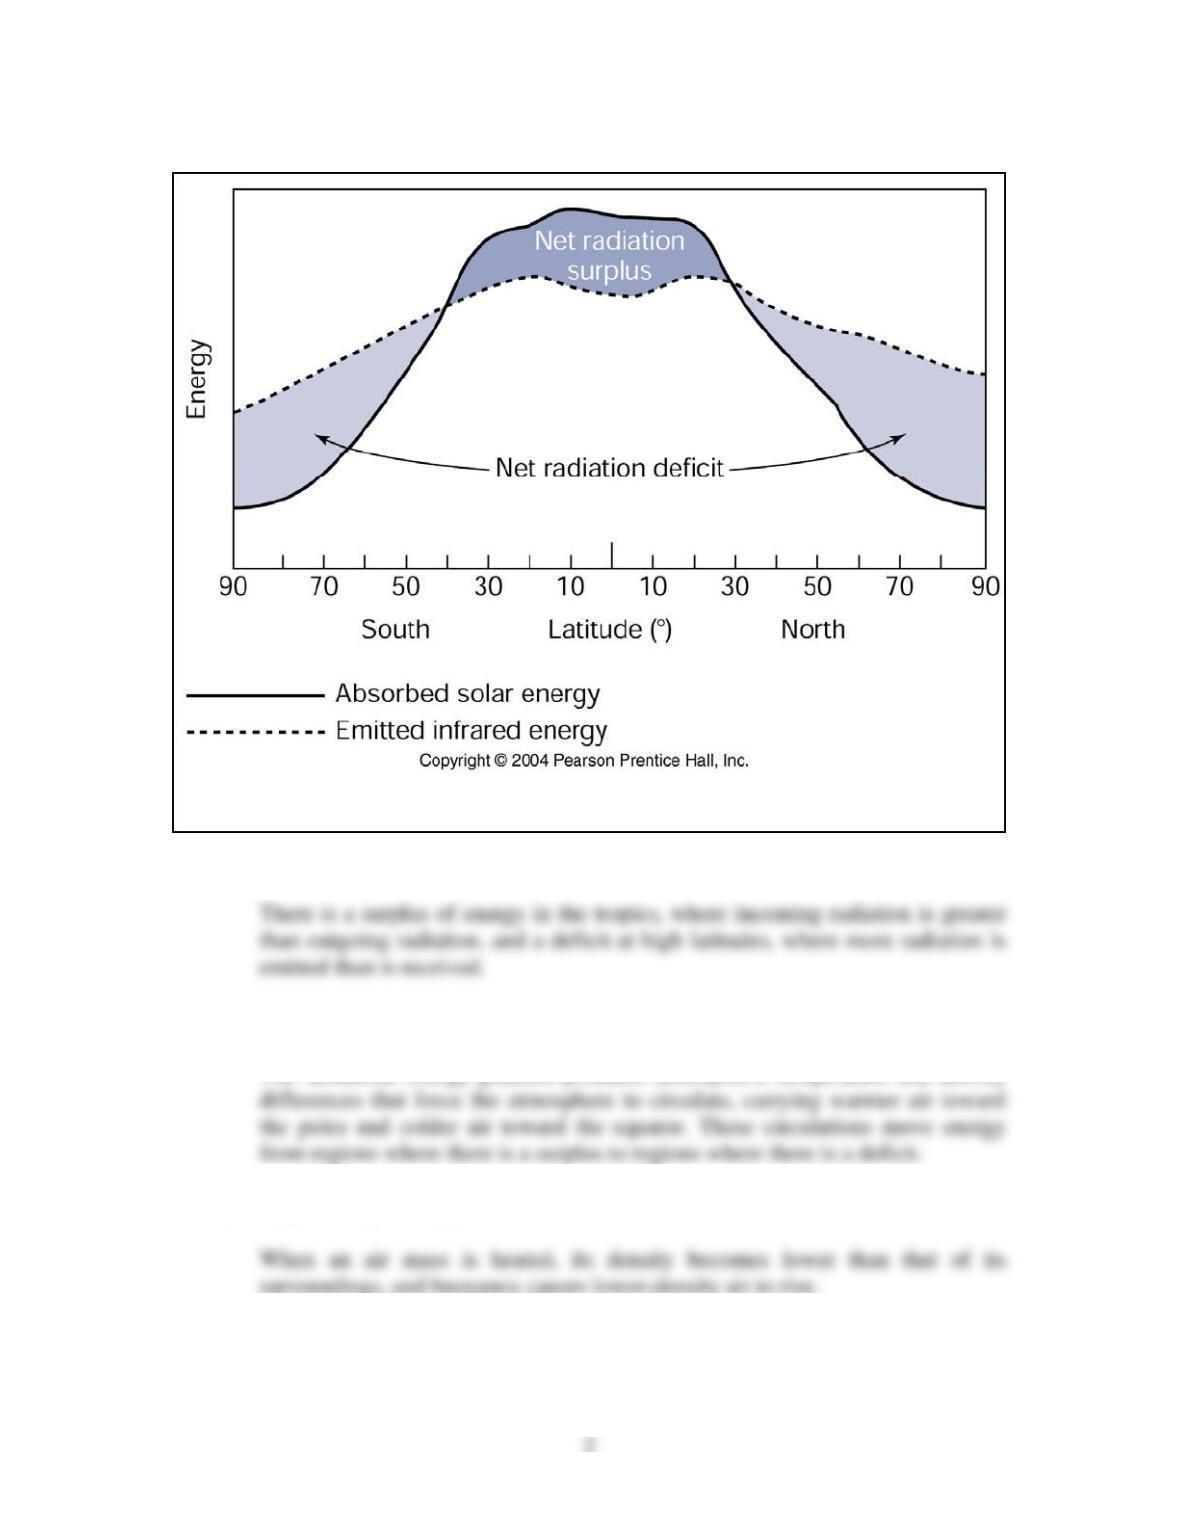
Figure 4-2 from main textbook
b. Indicate the regions of energy surplus and energy deficit.
There is a surplus of energy in the tropics, where incoming radiation is greater
c. Explain why this distribution is important for the atmospheric circulation.
The latitudinal energy gradient produces atmospheric temperature and density
4.) Explain why heating an air mass causes it to rise.
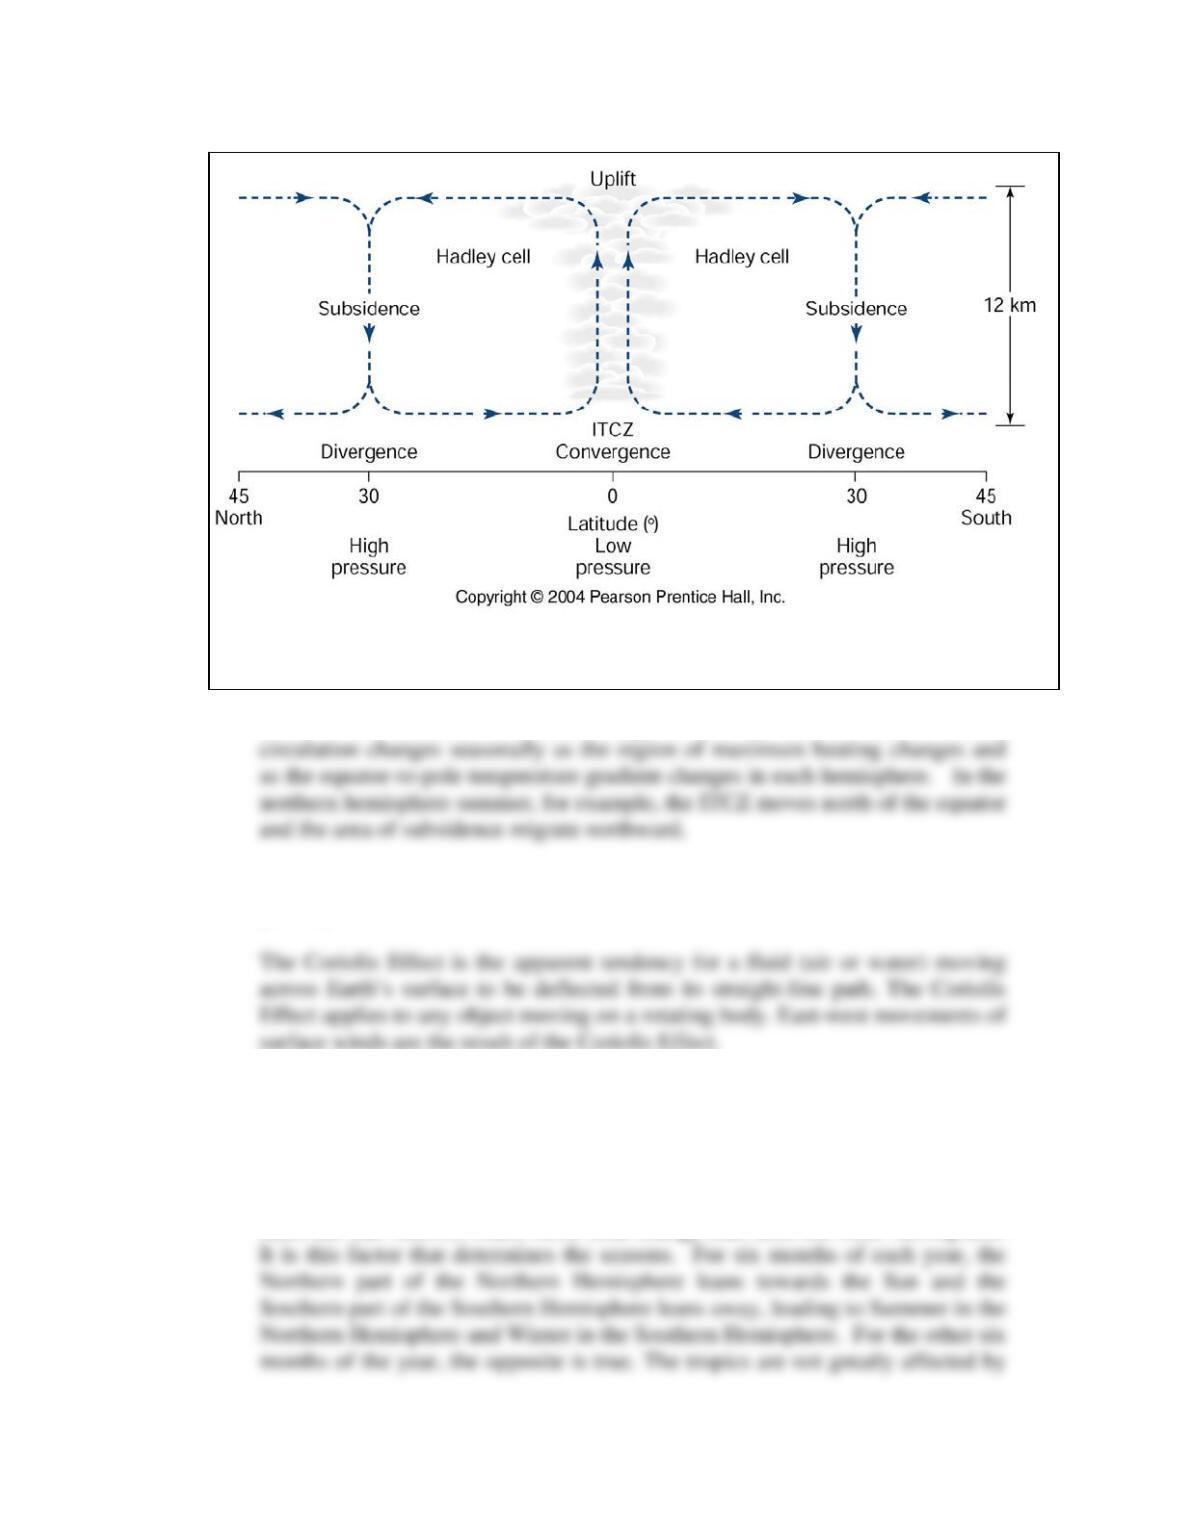
5.) Use a diagram to describe Hadley cells. Why does the Hadley circulation
change seasonally?
3
Hadley cells
Figure 4-3 from main textbook
Because the distribution of solar energy varies with the season, the Hadley
6.) What is the Coriolis Effect? How does the Coriolis Effect help determine the
global pattern of winds?
7.) Explain why Earth experiences different seasons throughout the year. Which
parts of Earth experience the greatest seasonal variability, and which parts
experience the least? Explain why.
Seasonality is caused by the tilt, or obliquity, of the Earth. The hemisphere that
faces the Sun receives much more solar energy than does the other hemisphere.
4
8.) Contrast the different roles of turbulent heat transfers and conduction in
modifying the thermal response of a land surface and ocean surface.
Figure 4-23 from main textbook
Oceans absorb more of the available solar energy than do land surfaces at the
same latitude. An ocean surface rapidly transfers heat downward by turbulent
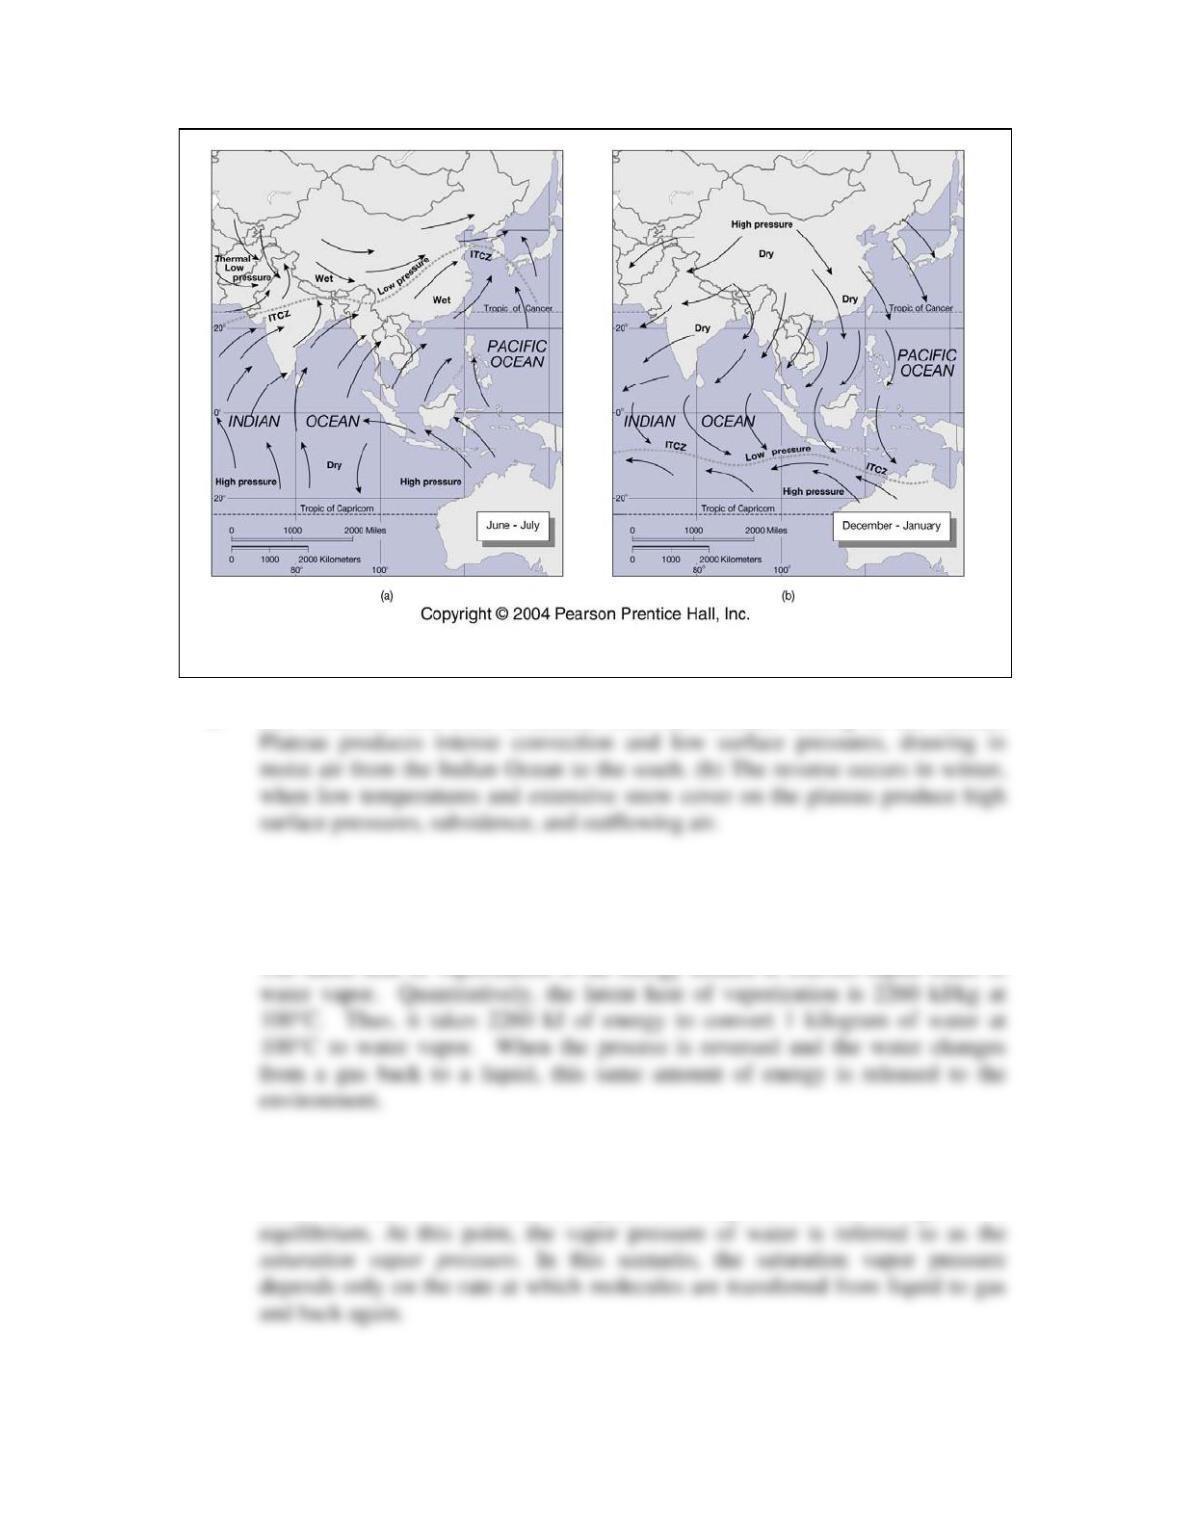
9.) Use map sketches to explain the processes that drive the Southeast Asian
monsoon.
5
Figure 4-2 from main textbook
a. The monsoon flow over Southeast Asia. (a) Summer heating of the Tibetan
10.) What is latent heat? Explain why latent heat is important for the redistribution
of energy.
The latent heat of vaporization is the energy needed to convert liquid water to
11.) What is meant by saturation vapor pressure?
Once the rate of condensation equals the evaporation rate, the gas is at
6
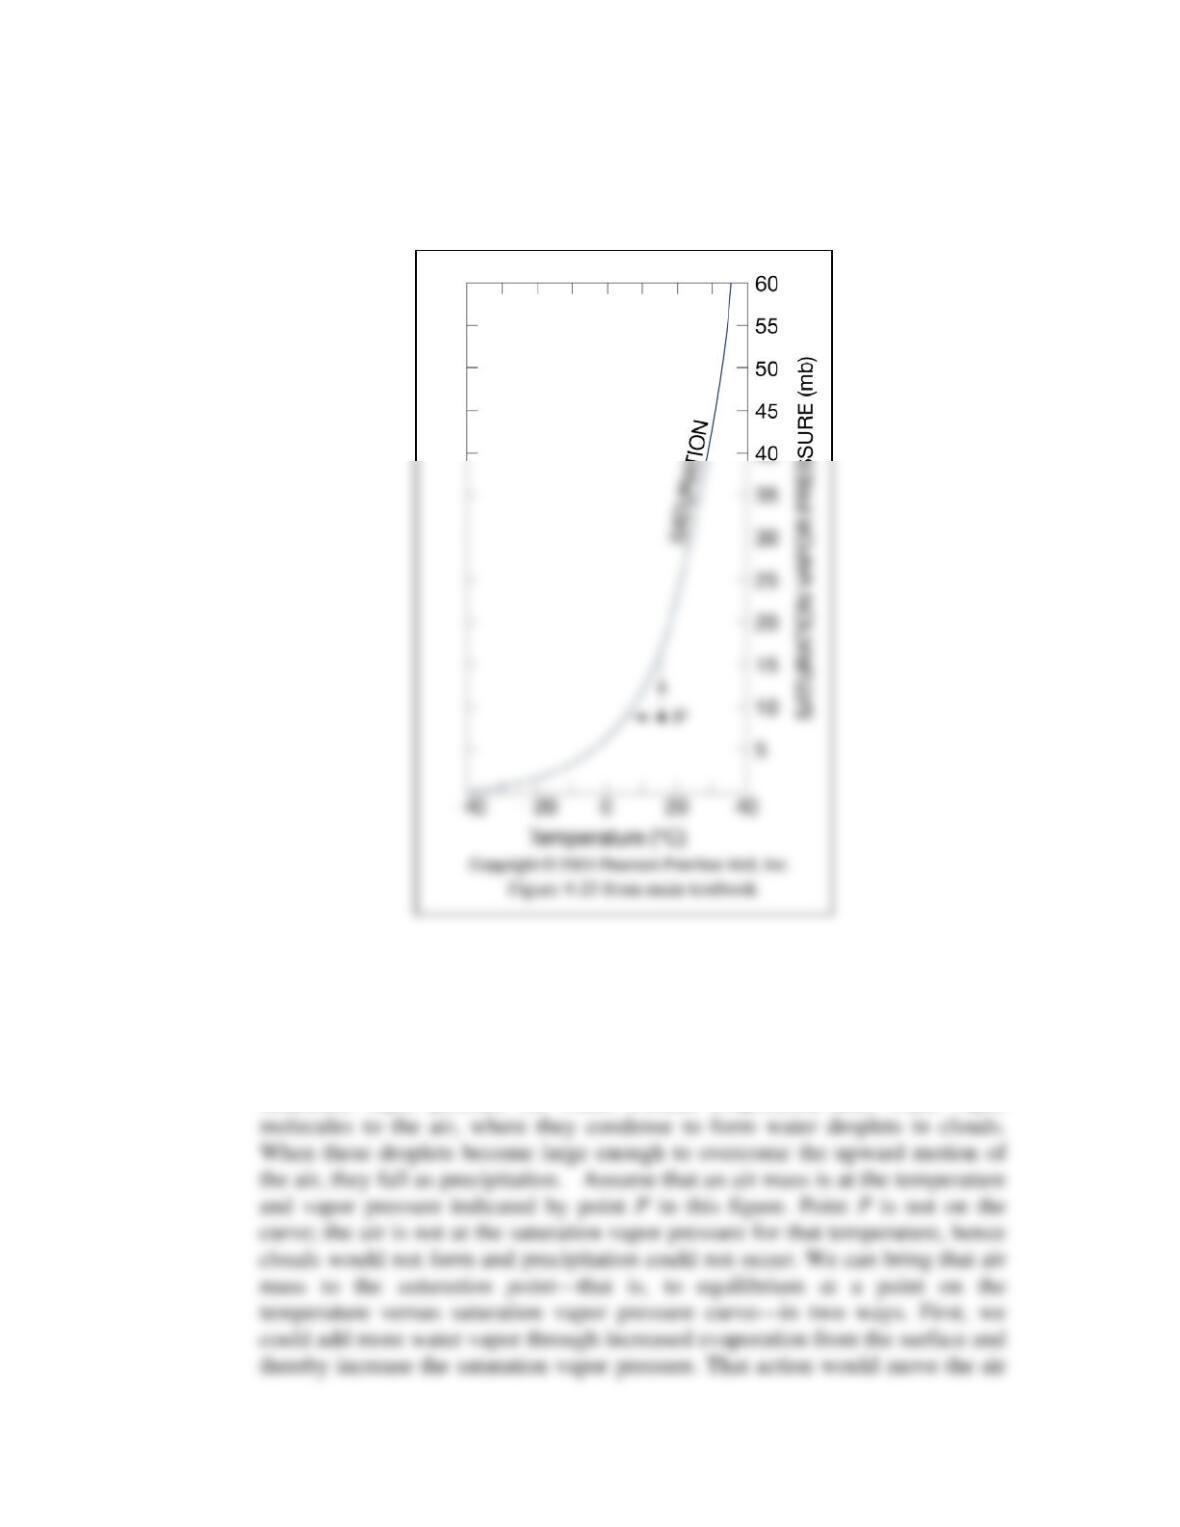
a. Draw a graph that plots saturation vapor pressure as a function of vapor pressure
and temperature.
b. Explain why the information shown in the plot is useful for understanding the
relationships between atmospheric circulation and precipitation.
The figure above is a graph of saturation vapor pressure versus temperature for
water. In general, we can think of clouds as forming when the air is at the
saturation vapor pressure for water. Further evaporation adds water vapor
7
12.) Describe three processes that produce uplift in the atmosphere and are important
in causing precipitation.
i. Mixing of air masses with different densities.
ii. Uplift due to convection causes heavy precipitation along the polar front
zone in the mid-latitudes and in the vicinity of the Inter-Tropical
Critical Thinking Problems
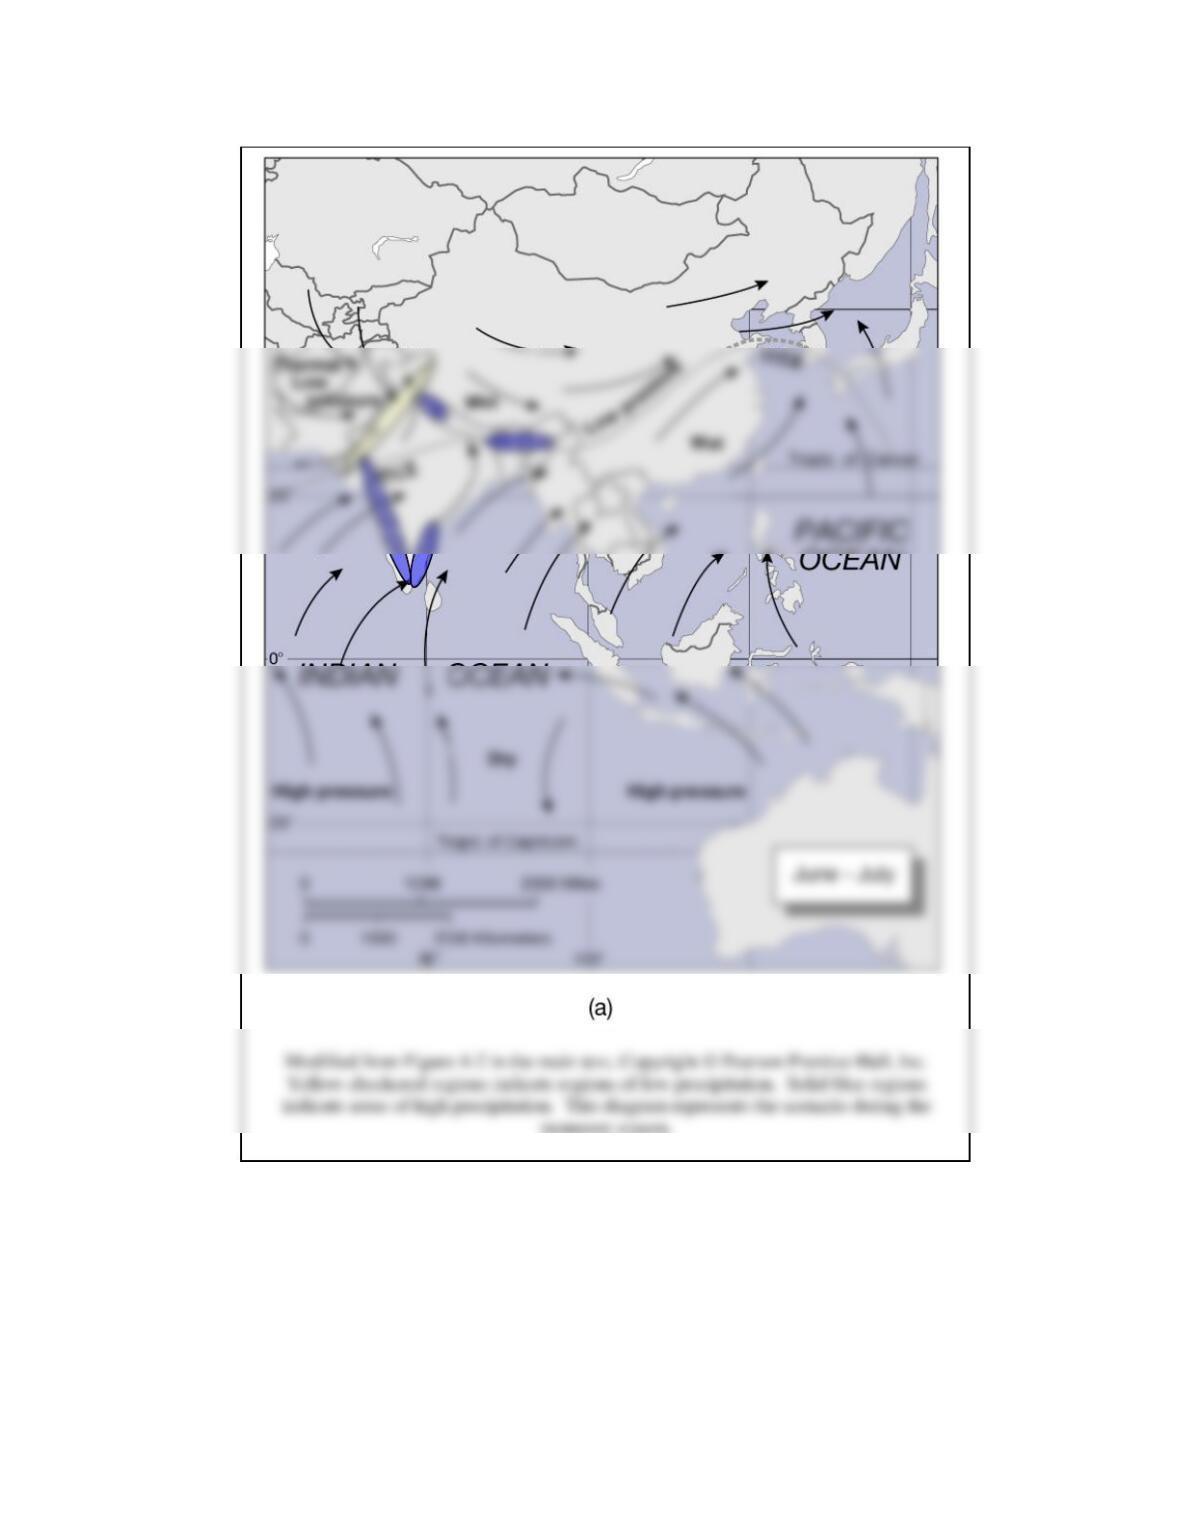
1.) Sketch a map of India. Locate the major mountain ranges. Show which areas you
think would have high rainfall and which areas you think would have low rainfall,
and explain why.
8
2.) In this chapter, we discussed several types of desert, including polar deserts. The
center of the Antarctic ice sheet, for example, receives very little precipitation
each year and is regarded as a desert, although it does not match the customary
idea of what a desert is. From this chapter we saw that:
Precipitation generally decreases as temperature decreases (because saturation
vapor pressure is much lower in cold air than in warm air)
9
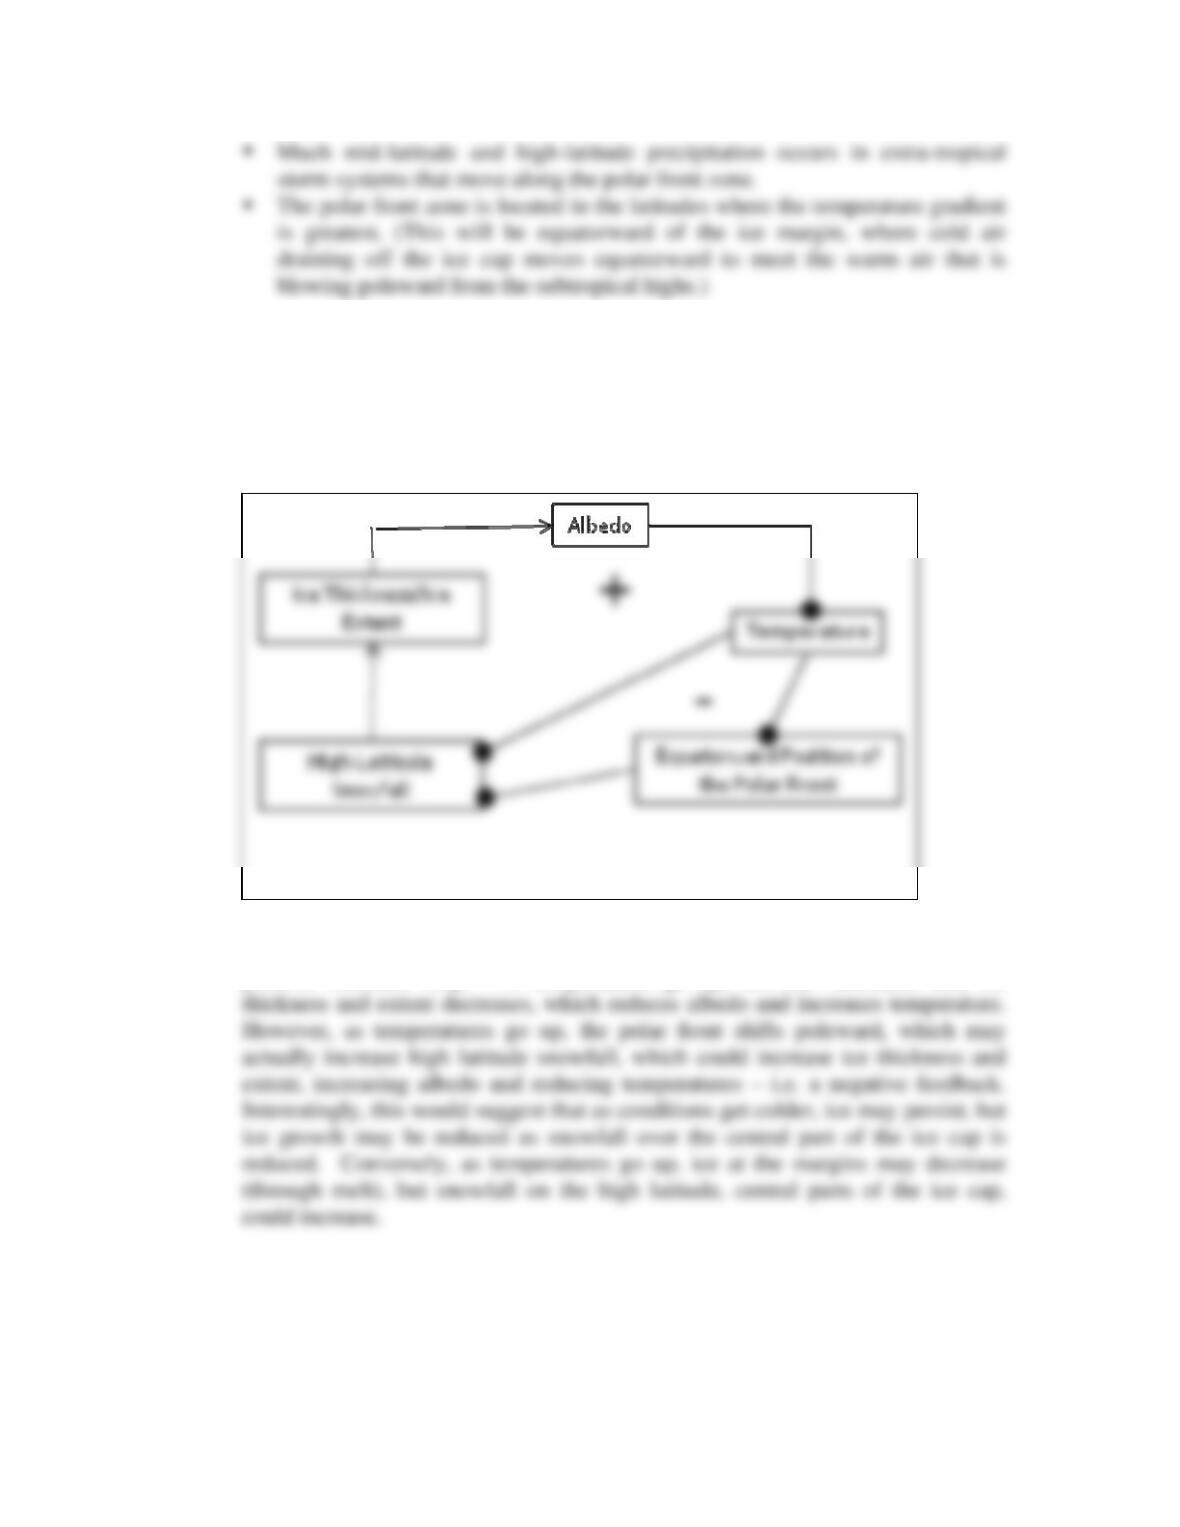
Put this information together in a systems diagram that has two feedback loops:
one that links ice extent, albedo, temperature, and snowfall; and one that links ice
extent, temperature, the location of the polar front zone, and snowfall. Are these
feedback loops positive or negative? What implications do the feedback loops in
part (a) have for the long-term growth of an ice sheet?
The feedback loop between ice extent, albedo, temperature, and snowfall is a
positive feedback loop. As temperatures go up, snowfall decreases and ice
3.) Indicate on two world maps the areas where you would expect to find relatively
high rainfall and where you would expect to find relatively low rainfall, or even
deserts, in (a) July and in (b) January. (c) Explain these distributions.
10
Refer to Figure 4-26 in the main text.
In both January and July, high rainfall occurs along the ITCZ and the PFZ (Polar
Front Zone). Low rainfall amounts are found in the sub-tropical high pressure
zones. In January the ITCZ is south of the equator and the rainfall associated with
Resource Guide
Websites: