QUESTIONS 16, PART A
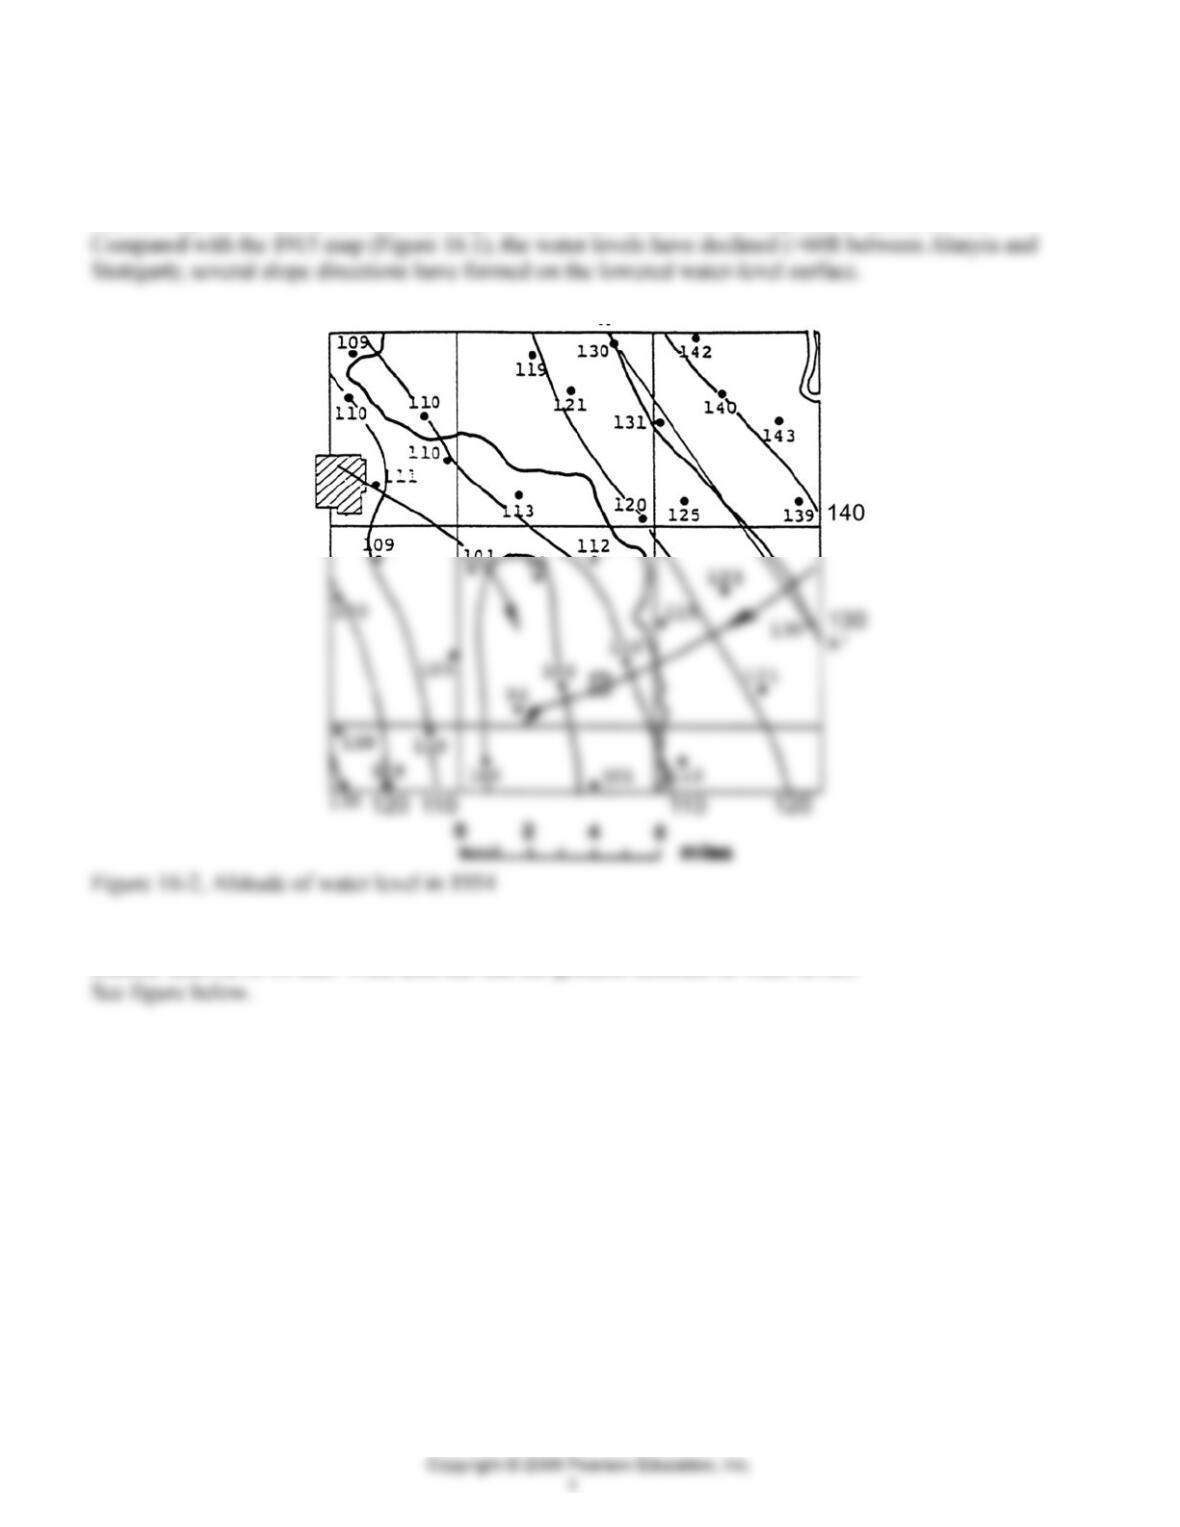
1. a. On Figure 16.2 construct a map that shows the configuration of the water-level surface in March
1954, using a contour interval of 10 feet. Compare this map with Figure 16.1. What are the major
differences?
See the map below. (Note answer-key map has flow lines added later in response to Question 1d.).
b. On Figure 16.3 construct a map that shows the net decline of water levels from 1915 to 1954. Use a
contour interval of 10 feet. What area has had the greatest decrease in water levels?
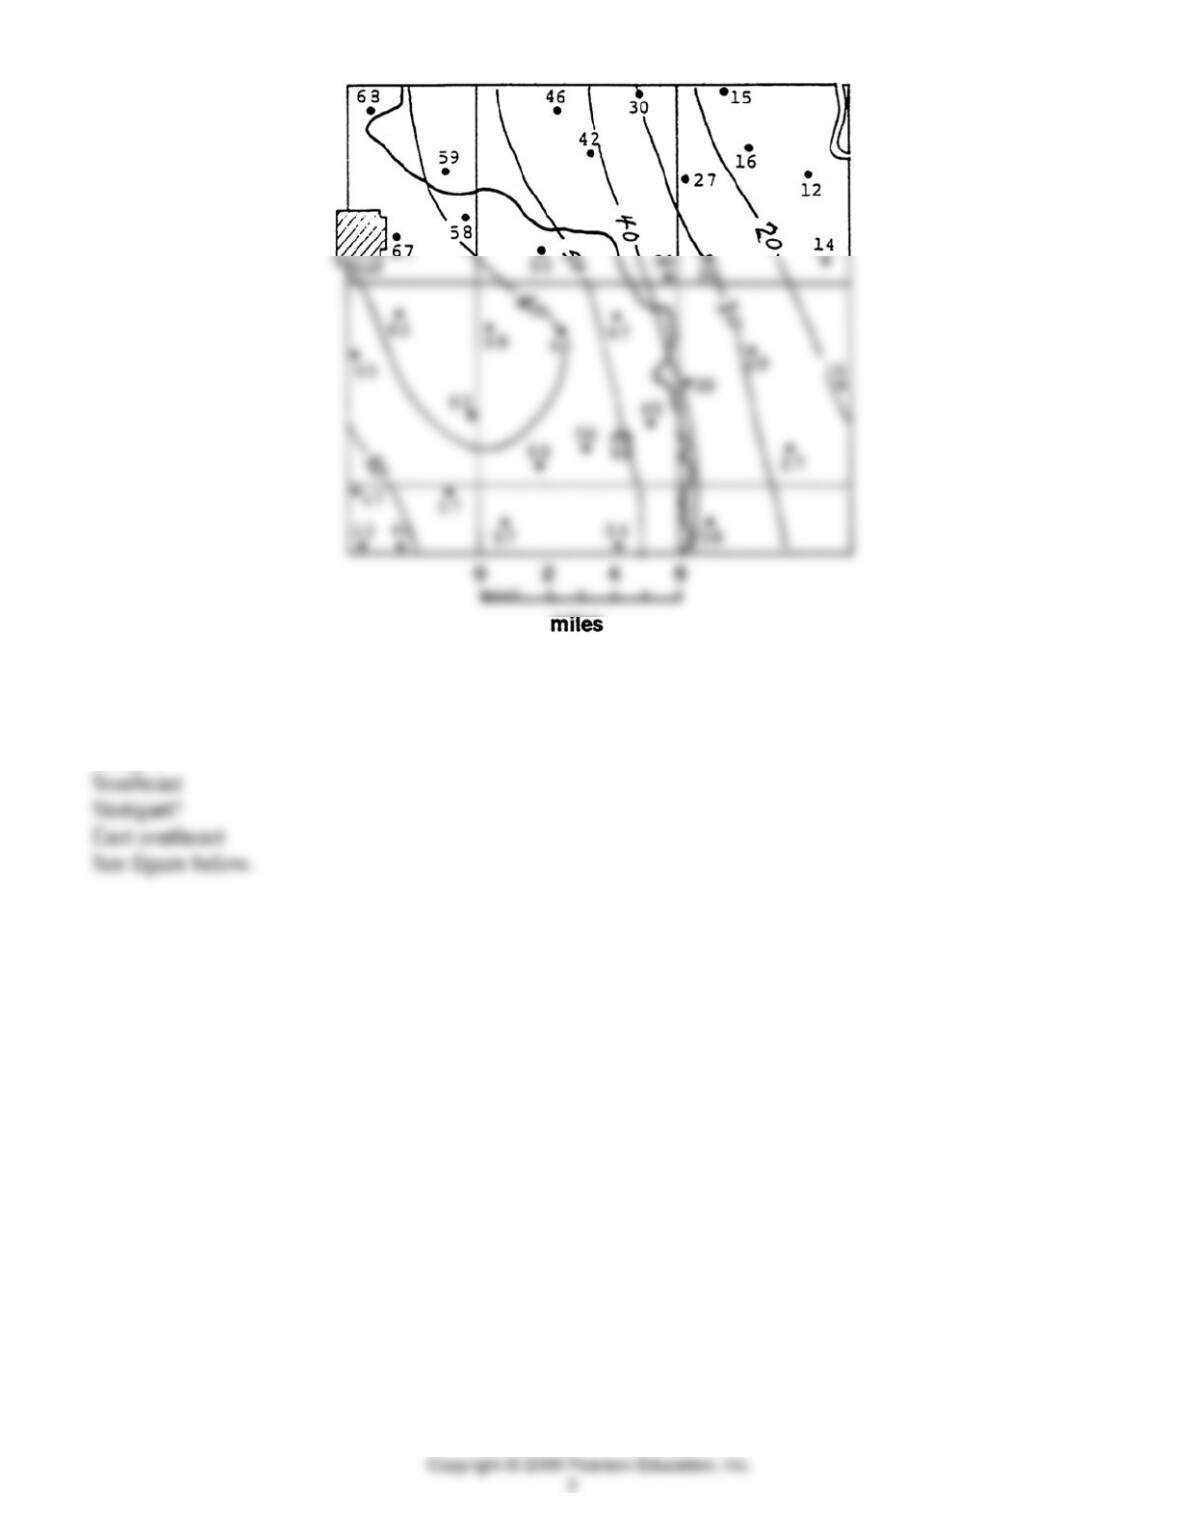
Figure 16.3, decline in water levels (1915-1954).
c. Starting at the east edge of Stuttgart, draw a flowline across the 1915 map (Figure 16.1). Draw a similar
flowline passing through Almyra. What was the general direction of groundwater movement in 1915 at
Almyra?
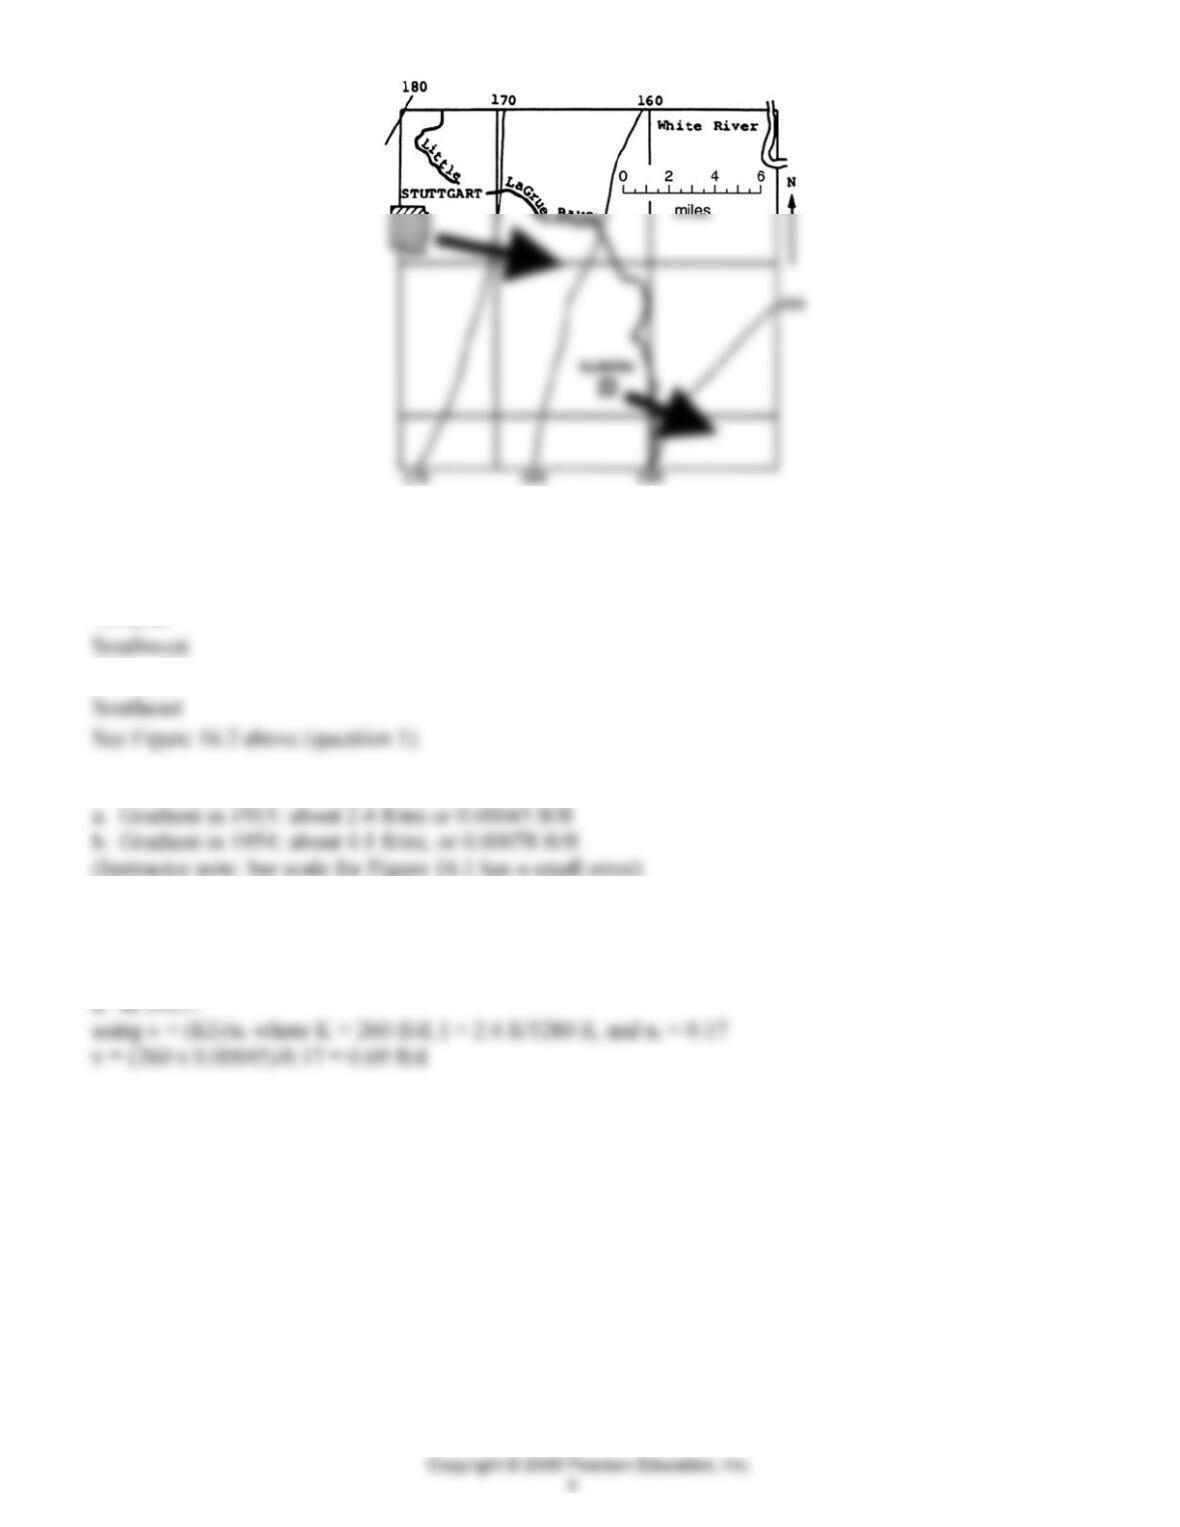
Figure 16.1 with arrows showing flow direction.
d. On Figure 16.2 draw the flowlines passing through Stuttgart and Almyra. What was the general
direction of groundwater movement in 1954 near?
Almyra?
Stuttgart?
2. Calculate the gradients that existed in 1915 and 1954 using the flowlines that pass through Almyra.
3. The hydraulic conductivity of the water-bearing deposits averages 260 ft/day, and the effective porosity
averages 17%. What was the groundwater velocity in the vicinity of Almyra (refer to Exercise 12 for
formula details)
b. in 1954?
4. Assume that the saturated sand in the northeastern part of Figure 16.2 (along line A–A′) is 40 feet
thick. How much groundwater flowed across A–A′ during a single day in March 1954?
Q = KIA
5. Figure 16.3 indicates that there has been a significant lowering of water level. This means that more
water is pumped from the aquifer than is flowing into it. This negative change in groundwater storage is
termed overdraft. What could be done to decrease the rate of decline, maintain the existing level, or cause
the water level to rise?
6. “Ever think you’d run out of water where you live? Neither did the people in the Grand Prairie area of
eastern Arkansas. That’s why this web site has been created so you can understand what the Grand Prairie
Area Demonstration Project (GPADP) is all about.” At the Army Corps of Engineers website you can see
what the area’s response was to a study that predicted the loss of the upper Alluvial Aquifer and the decline
of the deeper Sparta Aquifer. It was estimated that without the project, rice production would drop to 23%
a. List two or three types of structures that are to be built in the Grand Prairie Area Irrigation Project.
1) Above-ground reservoirs on farms. 2) A pumping station on the White River at DeValls Bluff will
supply the on-farm above-ground reservoir network. 3) Canals and pipelines also will be constructed in
this network.
b. What is the purpose of the project?
c. From where will much of the water come for this project?
Most of the water will be pumped from the White River. (At DeValls Bluff the pumps will lift 1,640 cubic
d. List several economic and environmental benefits of the project.
Economically, the project would maintain domestic food (rice) production, jobs in farming and related
e. List several objections that environmental groups have had to the project.
f. Although there have been many starts and stops to the project over decades, what did Judge Bill Wilson
do on July 20, 2006?
The judge ruled against continuing the development and called for a more thorough assessment. (The
What was the name of the bird that was a factor in the decision?

Democrat-Gazette. July 21, 2006.)
g. Why would area farmers not plan to continue expanding their use of the lower aquifer (Sparta Aquifer)
but instead would like to use water from the GP Irrigation Project?
1) The capacity was not there. The lower Sparta Aquifer had a specific yield (~ effective porosity) of
only 0.01 (cf., Alluvial Aquifer at 0.30).
3) The cost of pumping was higher and increasing.
h. Search online to determine the current status of the irrigation project and any economic and
environmental changes that have occurred since 2006 in this area that has been aware of groundwater
McKee, P.W., and Hays, O.D., 2004, The Sparta Aquifer: A Sustainable Water Resource: U.S. Geological
Reed, T.B, 2004, Status of Water Levels and Selected Water-Quality Conditions in the Mississippi River
Valley Alluvial Aquifer in Eastern Arkansas, 2002: USGS Scientific Investigations Report, 2004-5129, 60

QUESTIONS 16, PART B
1. A water-level map of the Savannah area representing conditions that existed in 1880 is shown in Figure
16.5. Construct four equally spaced flowlines showing the direction of groundwater movement in 1880.
Remember that flowlines cross the water-pressure contours at right angles.
See map below.
What was the general direction of flow?
Was groundwater at Parris Island likely to have been salty in 1880? Why or why not?
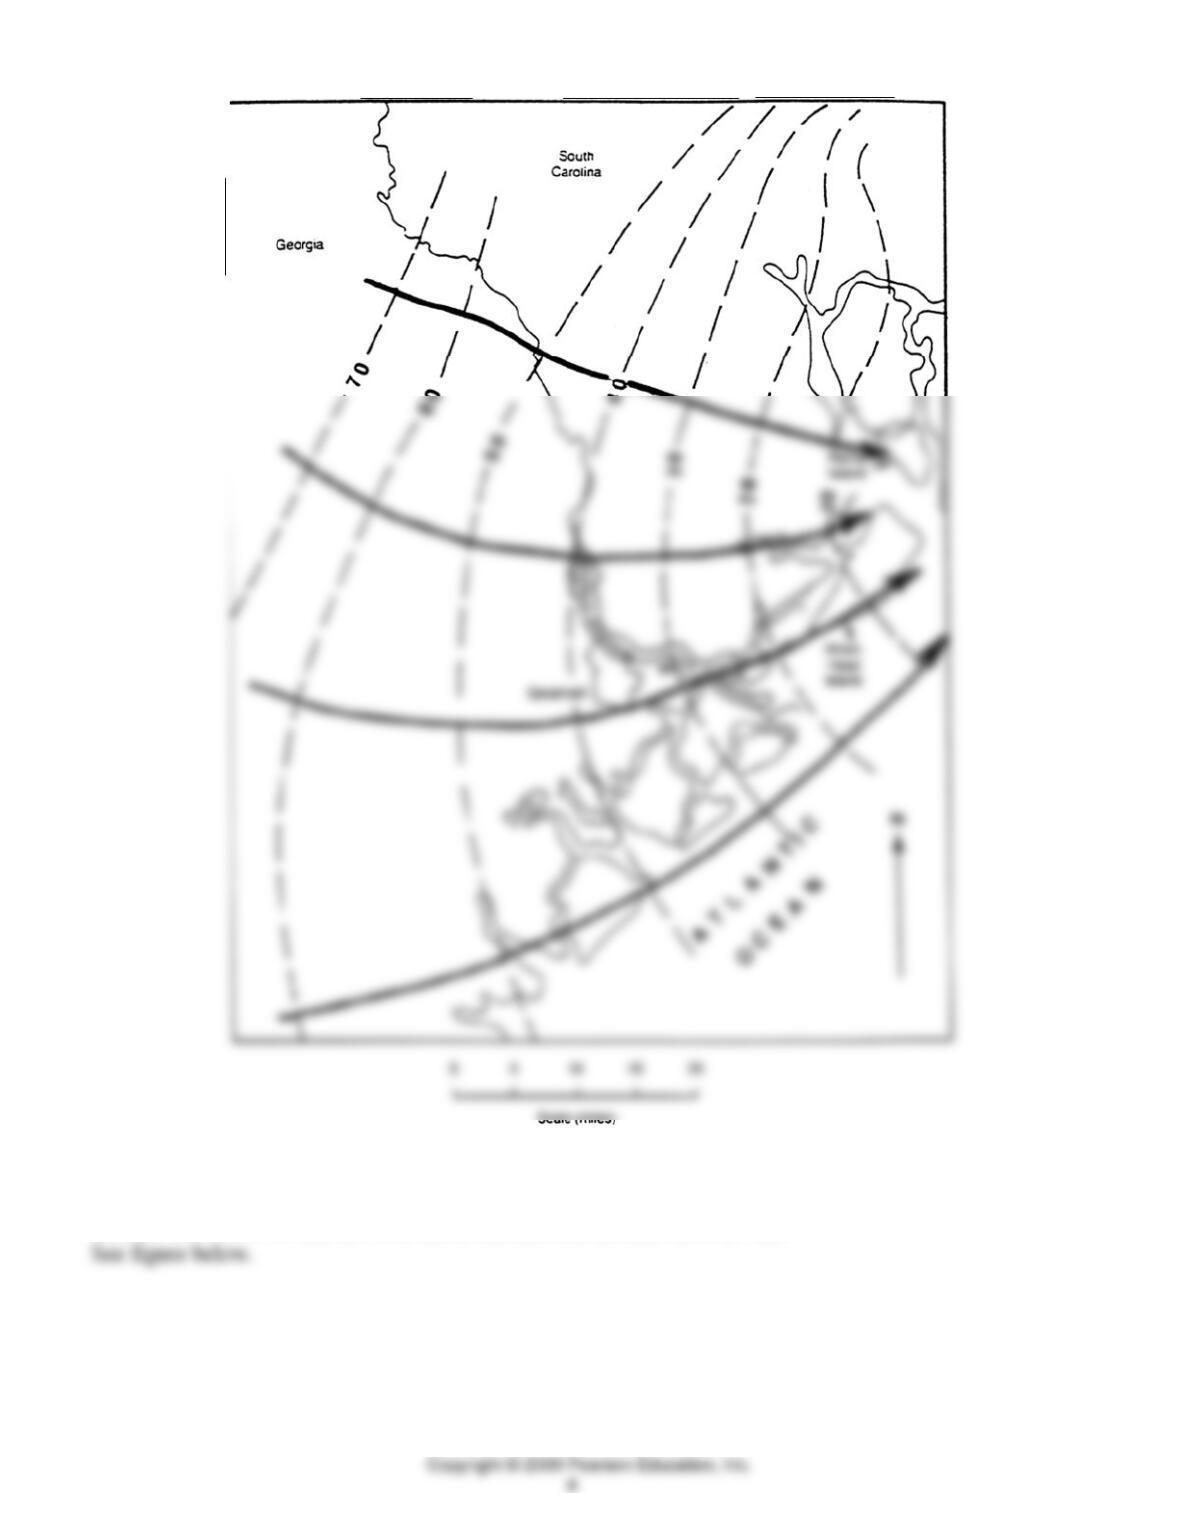
Figure 16.5, flow lines in 1880.
2. Using Figure 16.6, construct a water-level map showing the conditions that existed in 1961. Use a
contour interval of 10 feet down to the level, then use an interval of 20 feet.
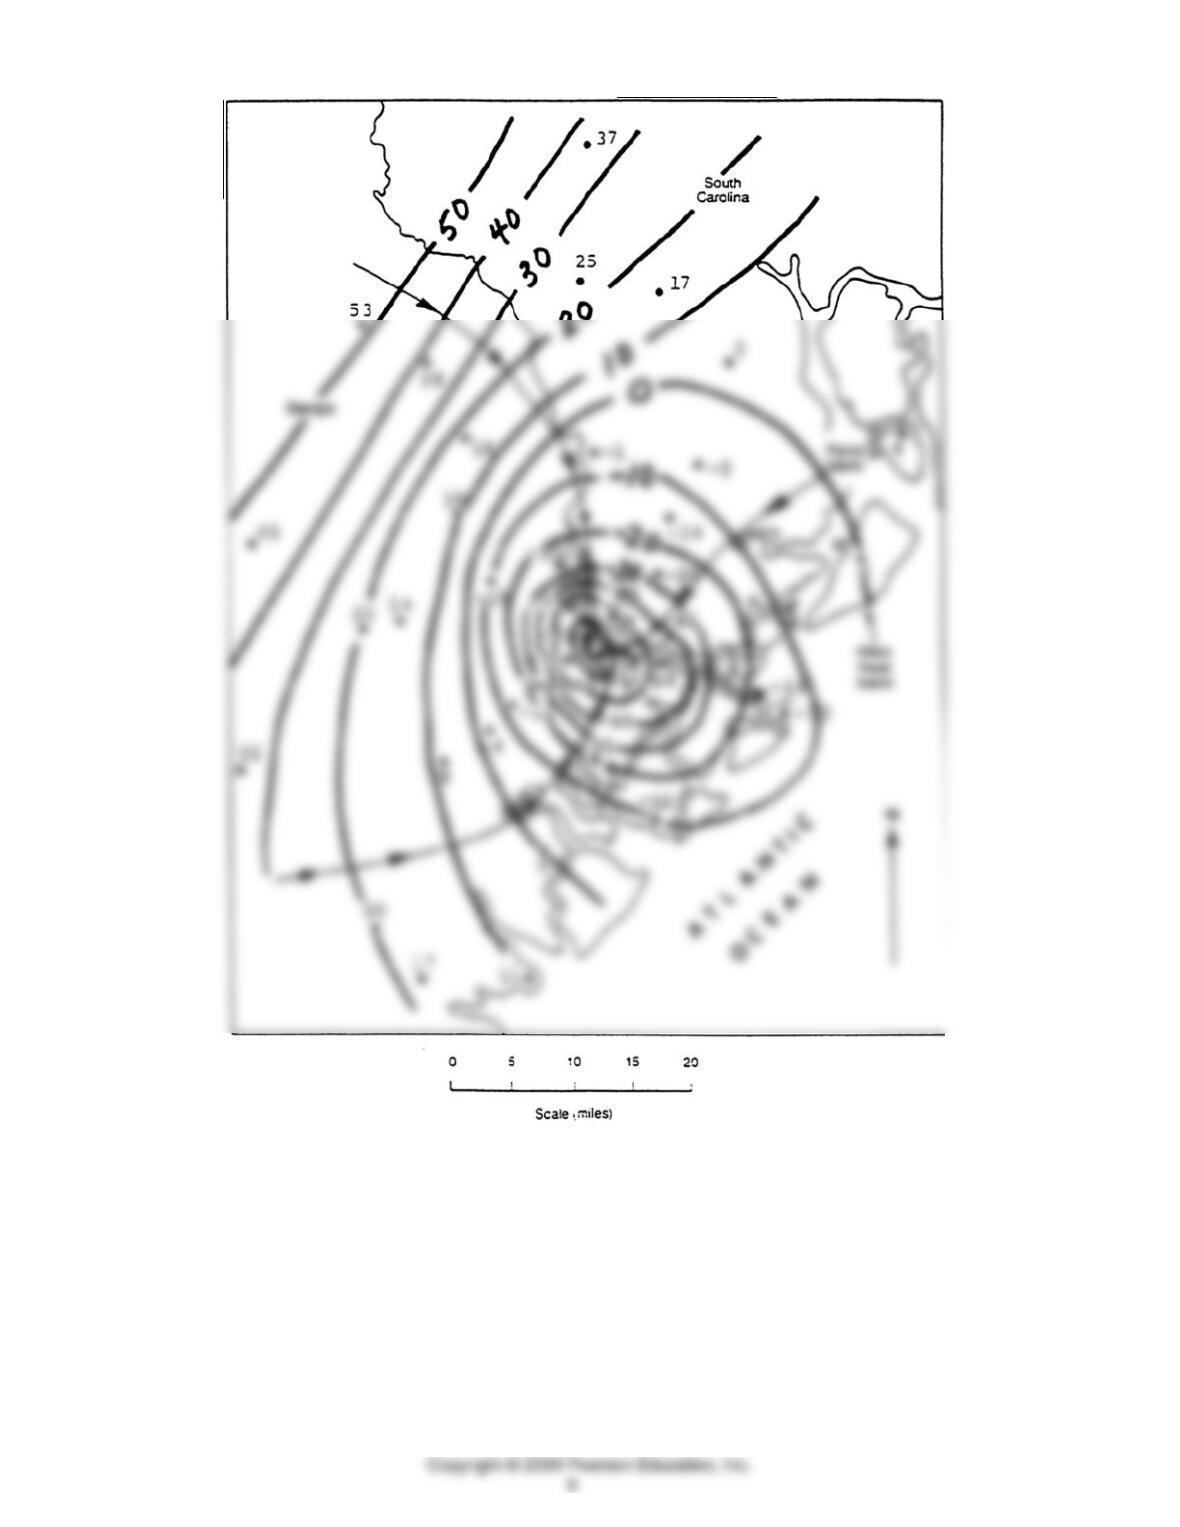
Figure 16.6, water levels in 1961, with flowlines.
3. Starting at the southwest and northwest corners of Figure 16.6, and at Parris Island, construct flowlines
showing the general direction of groundwater movement in 1961.
See map above
In what general direction was the water moving
a. in the southwest corner? East, then northeast
b. in the northwest corner? Southeast, then south
c. at Parris Island? Southwest
4. Study Figure 16.7 and describe the changes from 1961 to 1984 at Hilton Head Island, Savannah,
Georgia, and 25 miles up the Savannah River from the center of the cone of depression. At Hilton
Head, the water level is down to –10 ft, from 0 ft.
5. How much has the water-pressure surface been lowered at Savannah between 1880 and 1984?
6. From what area do you expect the fresh water/saltwater interface to first reach the Savannah area?
SW or NE (circle one) Why? (Hint: Examine the water-level contours, and the variation in depth of the
7. Figure 16.8 is a cross section extending into Port Royal Sound from the NE end of Hilton Head Island
showing simulated changes in the brackish and salt water zones for the years 2000, 2016, and 2032. The
model assumes no change in the rates of groundwater withdrawals on Hilton Head Island or inland near
Savannah.
a. What value is used as the transition between freshwater and brackish water?
b. In the period between 2000 and 2032, how many meters will the brackish/freshwater interface have
moved?
c. What is the average annual rate of projected advance of this interface between 2000 and 2032?
At the top of the aquifer, about 2,000 m in 32 y = 62 m/y.
d. About when will the interface reach the edge of the island?
8. a. What techniques might be used to halt or slow saltwater intrusion into the area of Hilton Head
Island? (Consider engineering and management techniques [Figure 16.4] to stop the advance of the
b. Explain Figure 16.4e or one other provided by your instructor.
Figure 16.4e shows a recharge well that is injecting fresh water between the salt water and the fresh
Read the following information and then answer Questions 9 and 10 below. Groundwater overdraft in the
Floridan Aquifer System of the southeastern coastal region has produced cones of depression in SE Georgia
and neighboring South Carolina. The decline in artesian pressure in this porous limestone/dolostone aquifer
has resulted in saltwater intrusion in the coastal areas. Some of the intrusion is lateral from the ocean or
downward from eroded river channels (as near Hilton Head, SC), or upward
through fractured limestone units in the Lower Floridan Aquifer as at Brunswick, Georgia. Georgia
recognized that the rate of decline in the water pressure surface (water table) and the increasing salinity
posed a threat to sustainable water resources in the region. A 1997 report described the conditions and
9. As a community leader of one of the 24 small communities in the region, you have been asked to join a
team to develop your community’s plan for future water needs. Before the first meeting of this new
committee, all the members of the committee are asked to prepare a list of short statements or items that
should be part of the discussion for planning future water needs. You organize and complete your response
under the following headings:
a. List of data needed to make the plans for future water needs. (Answers will vary; these are examples.)
Current water resource reports, with trends, for household, commercial, and industrial use of water, both
b. List of possible objectives for a sustainable community (for next 50 years) and your preferred objective.
Smart growth based on resources availability or maintaining community characteristics that are and have
c. List of possible options that could be considered for meeting your water needs for the community.
Additional groundwater sources and groundwater recharge.

d. List of factors that might make an unsustainable community with respect to water resources (even with a
plan for sustainable water resources).
10. Now use information from the Sound Science Report (2005) that is available from several sources
online and indicated below to prepare a water supply plan for your community. (Your instructor may
Student answers will vary depending on effort, changing availability of reports, and new data, concepts,
policies and technologies.
a. Will engineered barriers to prevent saltwater intrusion be suitable for your community? (See
e. What are the recommendations that you (or your group) would make to provide (possibly through
several sources) sustainable water supplies for your coastal community. Consider changing populations
and climates in your recommendations. (Optional additional information: