QUESTIONS 15, PART A
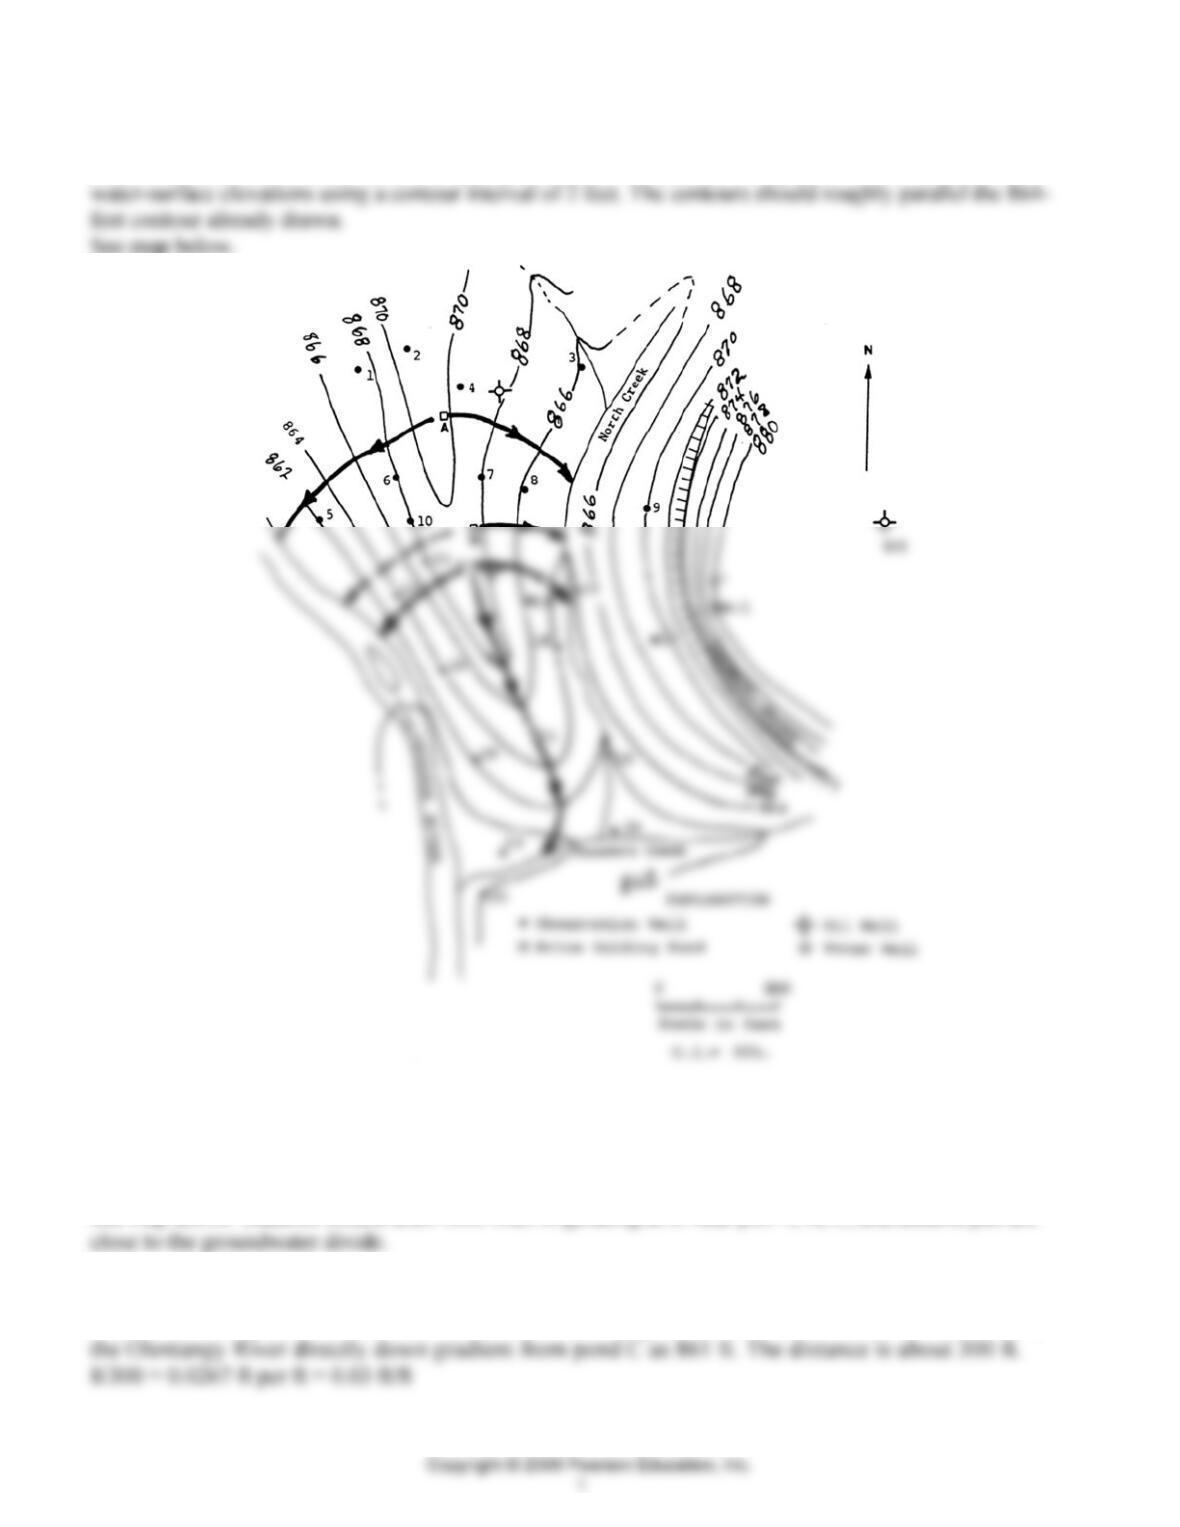
1. Using the data in Table 15.1, construct a water-table map (Figure 15.1). Begin by transferring the water-
table elevations from Table 15.1 to the appropriate test hole locations in Figure 15.1. Then contour the
2. Draw several flow lines originating at the brine holding ponds to the most likely area of groundwater
discharge. Remember that during dry weather streams flow only because groundwater discharges into
them.
See map above. Students should draw flow lines originating at or near pits A, B, C, and assume pits are
3. What is the gradient from pond C to the Olentangy River?
The elevation of pond C is about 869 ft, based on contouring as shown above. Estimate the elevation of

4. What is the gradient from pond C to Saunders Creek?
5. Calculate the velocity of groundwater moving from pond C to the Olentangy River, and from pond C to
Saunders Creek.
v = (KI)/ne
6. If we divide the distance of travel (measured along a flow line) by the rate of flow of groundwater, we
obtain the travel time. What are the travel times for water from pond C to
b. Saunders Creek:
7. On another map (Figure 15.2) construct contours representing lines of equal chloride concentrations
(isochlors). Use the data for October 1966 (Table 15.1) and a contour interval of 5,000 mg/L. Consider the
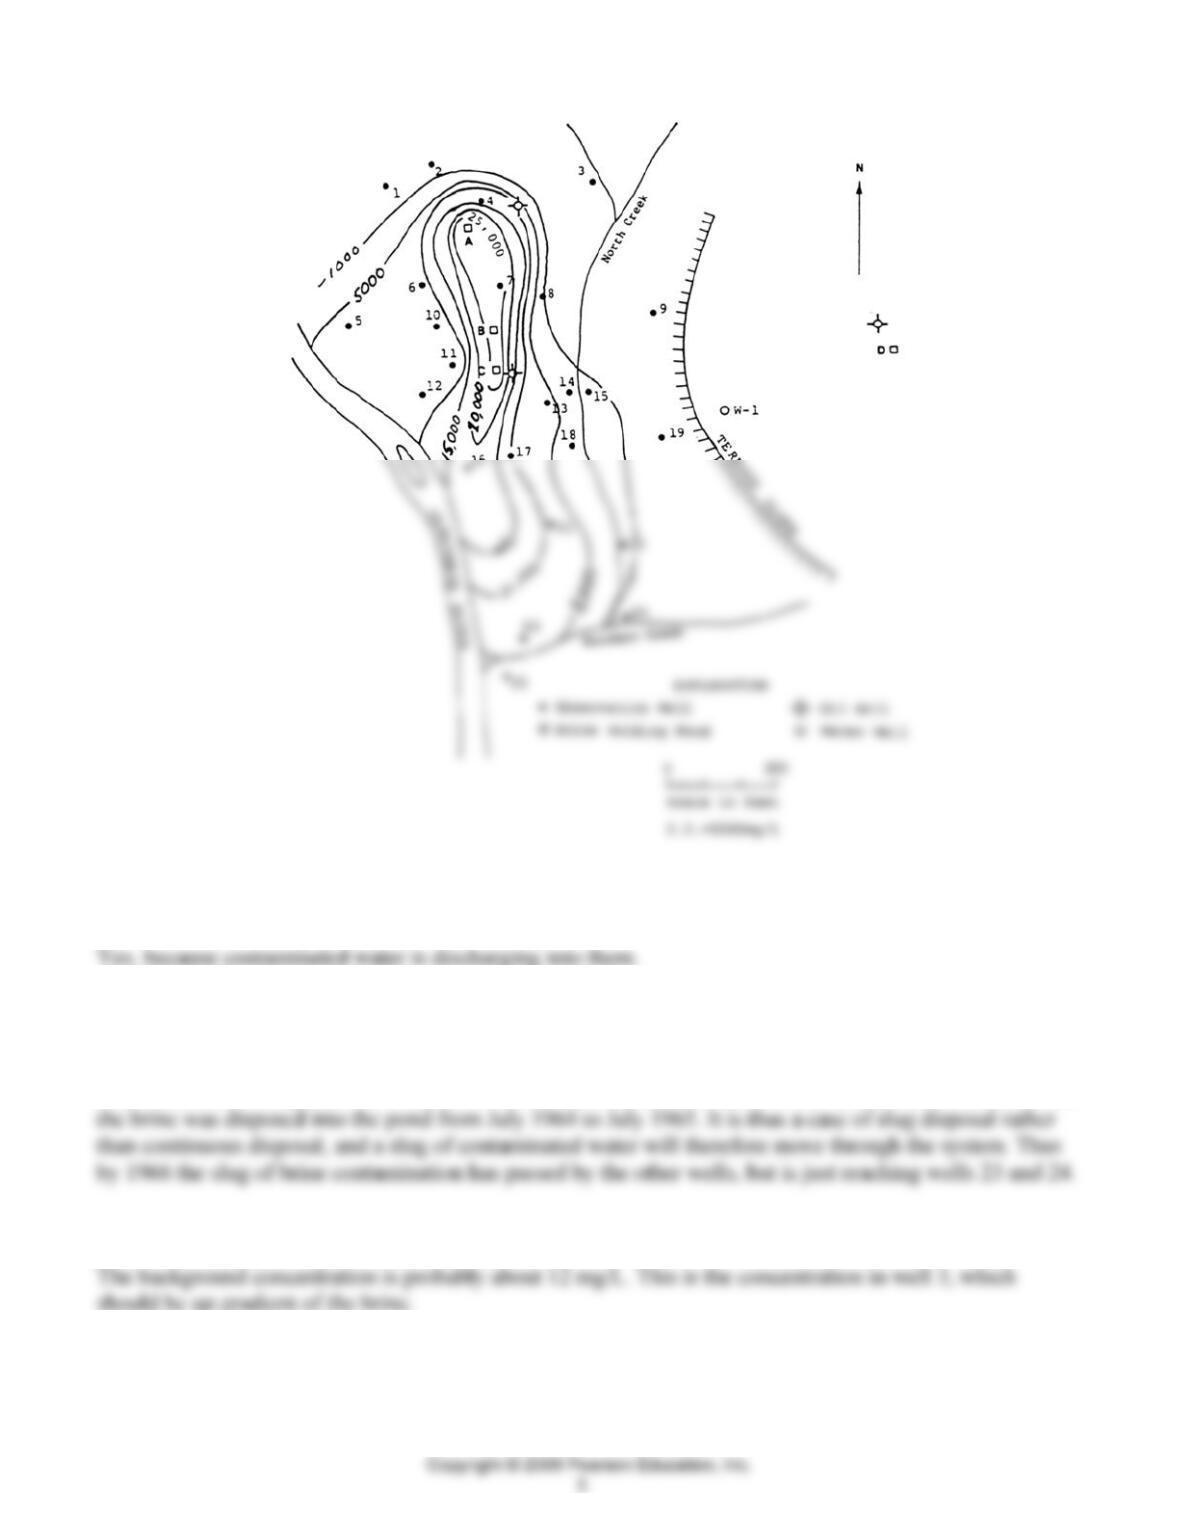
8. Should the Olentangy River and Saunders and North Creeks contain higher than normal concentrations of
chloride in the vicinity of the contaminated area? Why?
9. Wells 23 and 24 (Table 15.1) contain higher concentrations of chloride in October 1966 than in
November 1965, while the other wells contained less. Consider your answer to question 6b in your
explanation of why this happened.
The travel time from pond C to Saunders Creek is over a year. Also refer to the introduction and recall that
10. What do you think the chloride concentration of the groundwater was before brine-pit disposal began
(i.e., what was the background concentration)?
11. What techniques might be used to increase the rate of flushing of the high-chloride water in the areas
of contaminated soil?
Since chloride typically stays dissolved in water and typically does not chemically react with the soils,
12. A second isochlor map, based on the March 1969 data, is shown in Figure 15.3. A contour interval of
300 mg/L was used. This map is useful in determining the change in contamination with time. Compare
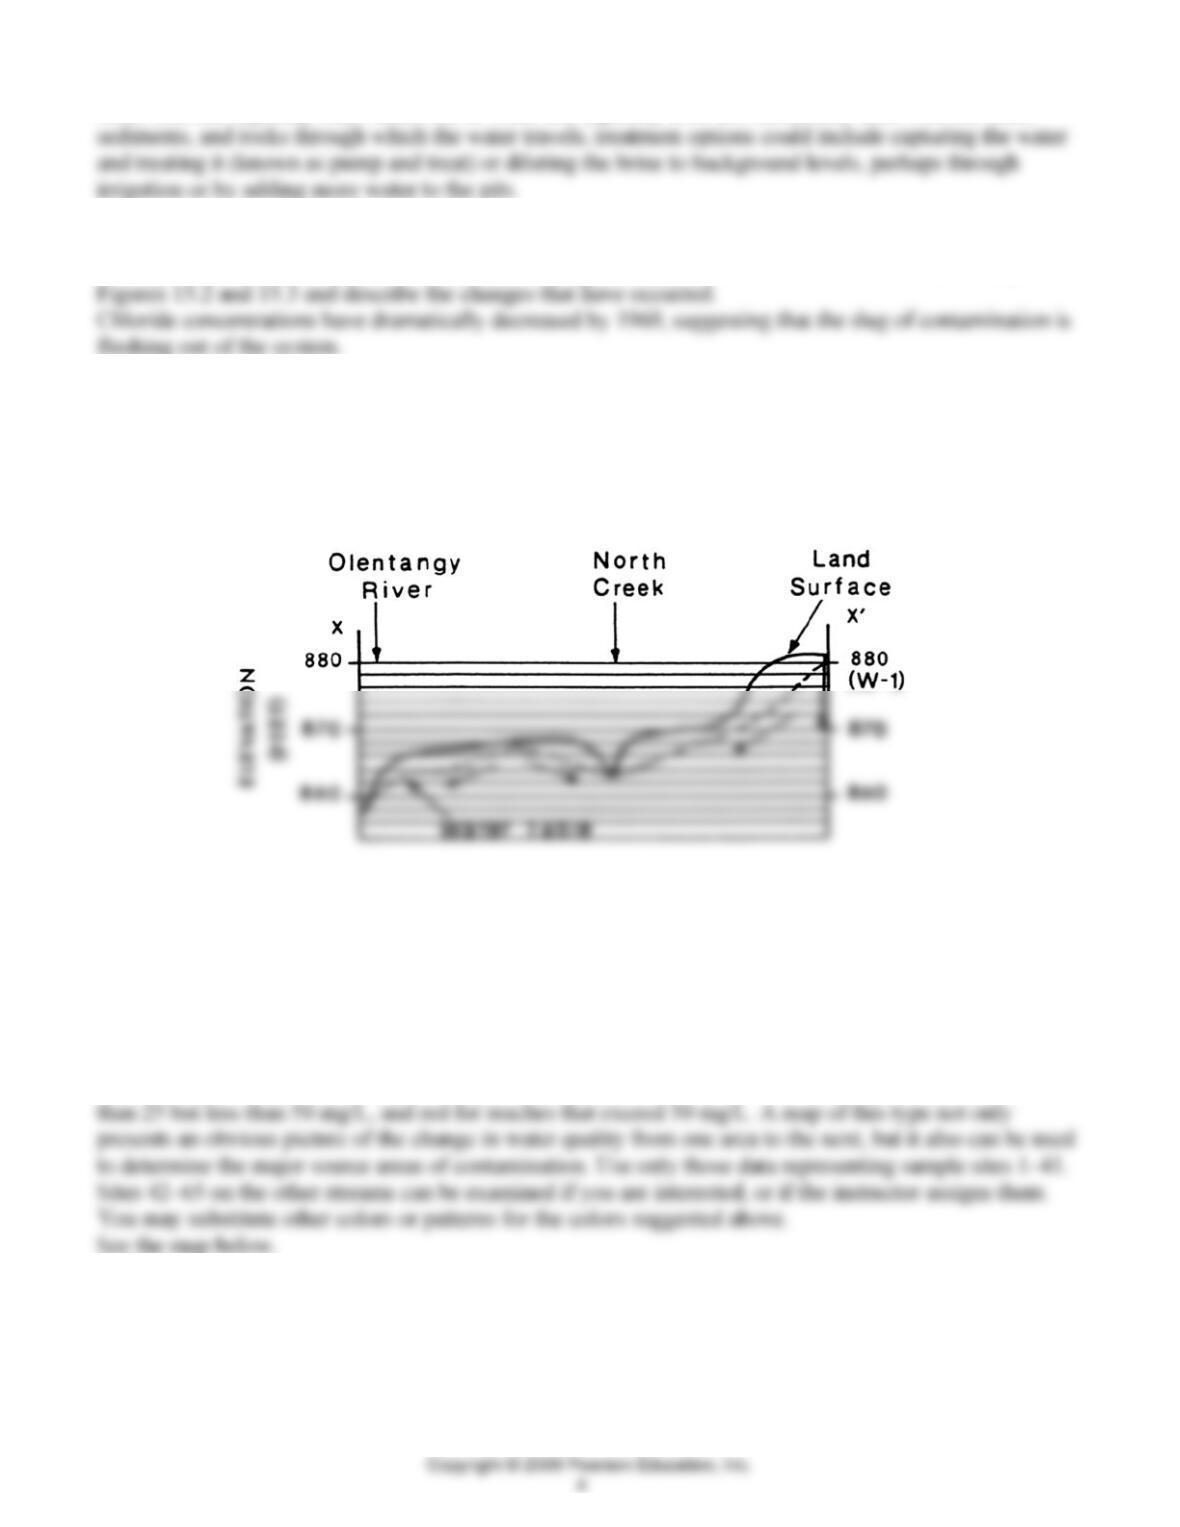
13. The shallow farm well (12 ft deep) at W-1 increased in chloride concentration between 1966 and 1969
(Table 15.1). Has this contamination resulted from brine disposal into ponds A, B, C, or D? Explain your
answer with the aid of the cross-section sketch (Figure 15.4), which goes from points X to X′ in Figure
15.1. Complete the water table and indicate groundwater flow by arrows in Figure 15.4.
See the cross section below.
Well W-1 is up gradient from ponds A, B and C. Contamination in well W-1 therefore must be coming
from pond D.
QUESTIONS 15, PART B
1. Using the data in Table 15.2 and Figure 15.6, construct a surface-water quality map. Assume that the
chloride content at a station reflects the quality between that site and the next upstream station. Mark in
blue the stream reaches that contain 25 mg/L or less of chloride. Use brown for reaches that contain more
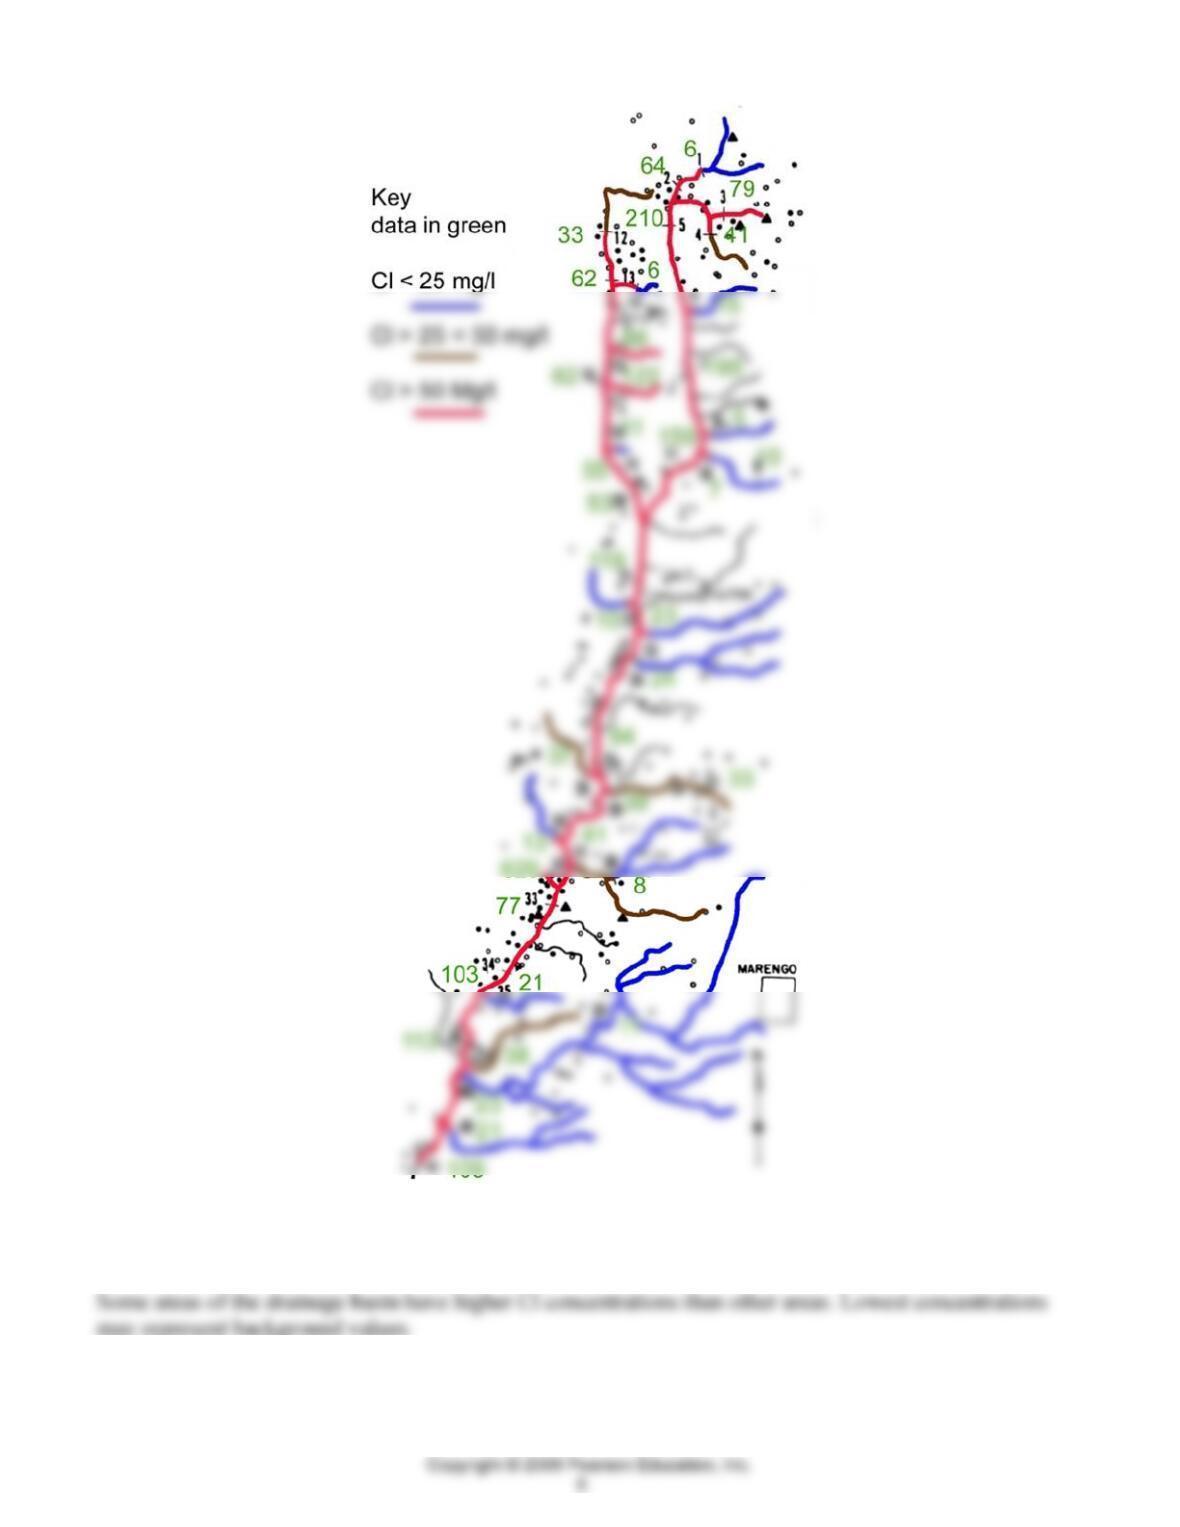
2. Briefly describe the quality of the water in Alum Creek basin using the map you completed in Question
1.
3. What areas are the major sources of chloride contamination in the drainage basin?

4. Why did the chloride concentration decrease between sites 21 and 25?
5. Would you expect the stream’s chloride concentration to be greater or less during the spring? Why?
Probably less, due to dilution from snow melt and water from spring storms. But storms could also
6. Obviously, much of the groundwater in the basin is contaminated, at least locally. Do you think that all
of the groundwater is contaminated? Explain.
7. Outline two areas in Figure 15.6 that should show background concentrations of chloride.
8. What are possible sources of chloride contamination in Alum Creek other than oil field brines?
9. In the upper part of the basin, many of the agricultural fields are underlain by drainage tile. The tiles
intercept groundwater and divert it away from the fields. This causes the water table to remain at a lower
elevation in fields with tile than in fields without tile. Ultimately, drainage from these tiles flows into a
stream. How could you use data from water-quality samples taken from field tiles to aid in determining the
QUESTIONS 15, PART C
1. Examine Figure 15.7 and Table 15.3. Sample sites 6, 9, 10, and 14 are in uncontaminated areas. What
are the background concentrations of the following elements in surface water?
2. In Figure 15.7 mark in red (or use a pattern [e.g., dots] that you identify in the explanation) the stream
3. In Figure 15.7 mark in green (or with a dash pattern) the stream reaches that exceed 0.011 ppm of zinc.
See figure below. Note: although the background value for zinc was 0.010 in Question 1, this question calls
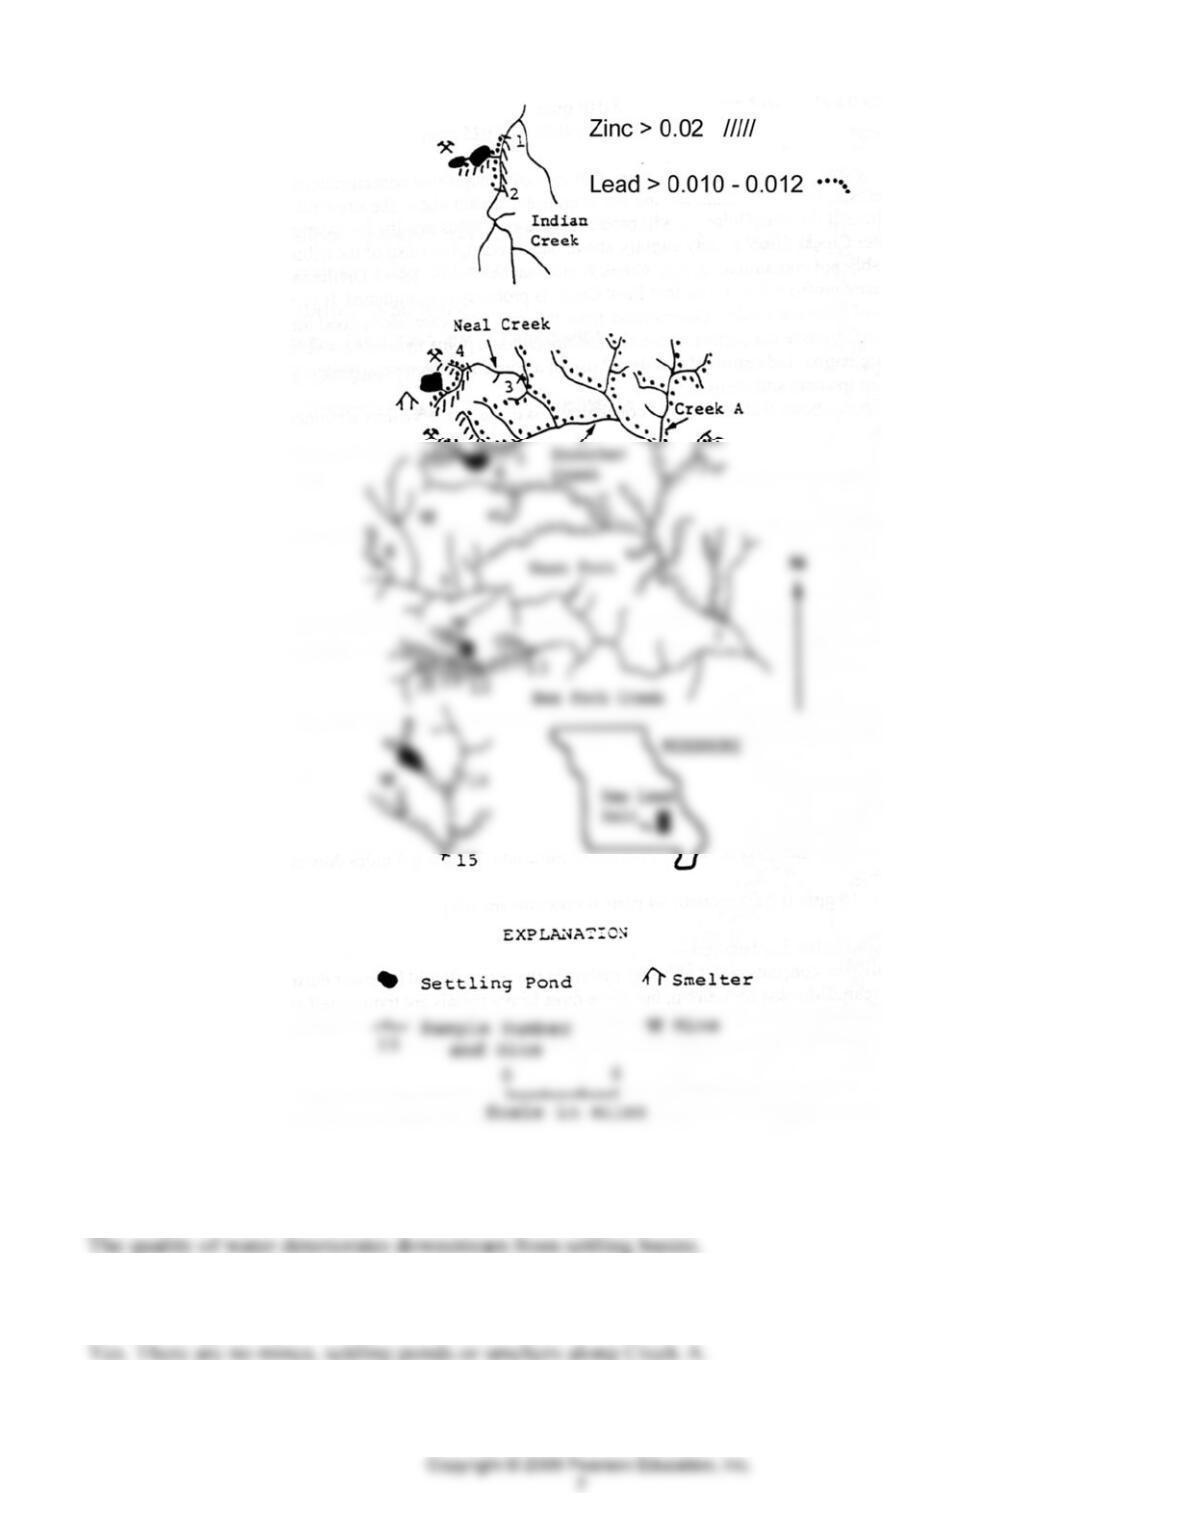
4. What relationship appears to exist between settling basin location and the quality of water in the
stream?
5. On the basis of available data, would you expect background concentrations of the contamination in
Creek A? Explain.
6. Examine the Mn concentrations in aquatic organisms in Strother Creek as shown in Table 15.4.
a. What general relationship is evident?
b. Similar but less obvious trends exist for Pb, Zn, and Cu; however, Pb in tadpoles exhibits the opposite
trend. What might account for this different trend?
There may be influence of lead from Neal Creek. Note that zinc, copper, and manganese all rise in crayfish
7. Examine Figure 15.8.
a. What is the background concentration for lead in aquatic vegetation in the Bee Fork drainage basin?
b. How many times greater is the concentration of lead at the mine than 6.5 miles downstream from the
mine?
c. How many times greater is the value for lead at 6.5 miles downstream than the apparent background
level?
8. The pollution load that a stream carries can be calculated if the stream discharge and the concentration of
the specific contaminants are known.
9. What techniques might be used to reduce the contamination of these streams in the New Lead Belt?
10. Using the above information from the USGS studies that began in 2000, briefly describe, in a bullet
statement for each, the key findings or conclusions that you might make from this study of part of the
New Lead Belt.
statements for some of the key findings.
11. Using the online resources (or the actual publications) from the USGS study on the New Lead Belt that
began in 2000, prepare two or three lab questions based on those reports that would be suitable for use by
your fellow students. Include the full reference, any diagrams or tables, and the questions. Also include the
answers that you expect for each of the questions. You can focus on either the geological or the biological
data or use both. (The instructor might make this a take-home assignment, depending on available resources
and time, and possibly a group assignment. Select from suggested references below or others that you find