QUESTIONS 14, PART A
Two sets of analyses, from 1971 and 1997/1998 sediment cores, provide the opportunity to determine
change in the Lake Erie system over time. We begin with the earlier study.
1. Using the 1971 data in Table 14.2 and the maps in Figures 14.1 and 14.2, construct isolines (contours)
showing the concentration of mercury and chromium in the bottom sediment in Lake Erie. For mercury, use
isolines representing concentrations of 0.25, 0.5, 1, and 2 ppm. For chromium, use isolines representing
concentrations of 20, 60, 80, and 140 ppm. Label the isolines, showing the ppm value of each. Remember,
some isolines may terminate at the shore of the lake. Mercury and chromium values for core sites 10–20
have been entered on Figures 14.1 and 14.2, respectively, and one or two isolines drawn. See Figures 14.1
2. From your maps of contaminated sediment, what three areas show major contamination by both
mercury and chromium?
3. a. On Figure 14.1 draw several arrows to indicate what you believe are the major directions of water
flow from the Detroit River to Buffalo.
b. Explain your reasoning.
Water flow is inferred from the contaminated sediment data and river sources in the west. The high
4. If concentrations of both mercury and chromium are near background levels at point A, describe the
expected land use on the north shore of the lake.
Agriculture is the expected activity on the north coast region of Lake Erie; there are no major industrial
5. a. Where would you expect bottom-dwelling organisms to contain the greatest concentration of
mercury?
In the Detroit River or where it flows into Lake Erie. (And other areas associated with industrial harbors as
by biological processes brought it into the food web.
b. The least?
6. Should commercial fishing have been banned throughout the lake, along the southern shore, or only in
the western part? Explain.
Yes or No. Arguments can be made for total or partial bans in the lake, as long as reasonable explanations
would suggest banning fishing in such areas might be reasonable. A first step might be a warning about
regularly eating certain species of fish from contaminated areas.
7. Is the chromium contamination in Lake Erie reflected in any of the major lakeside municipal water
supplies? Explain.
Yes or No answers would be reasonable.
The lack of data given on city water intakes and on nearby sediment values of Cr suggests we don’t have
enough information to clearly answer the question for Lake Erie. Presumably the Cleveland and Buffalo
DATA FROM 1997/98 SAMPLING
In 1997/98, another set of samples was obtained to determine trends in contamination and improvements in
environmental quality as a result of measures to control mercury and other pollutants. In addition to fewer
additions of contaminants to Lake Erie, contaminants in the upper layers of bottom sediment may have
changed because of erosion and deposition of sediment. Mercury concentrations in sediment for 1997/98
are reported in Table 14.2 along with the earlier (1971) values.
8. Table 14.2 contains mercury (Hg) concentrations for Lake Erie sediments acquired in 1997–1998. Most
of these data have been plotted on Figure 14.3, and some of the isolines have been drawn to show the spatial
distribution of mercury. Complete the 0.25 isoline for the Western Basin and the 0.1 isolines for the Central
and Eastern Basins. Begin by plotting values from Table 14.2 for stations in the Middle Basin (stations 47,
51, 61, 63, 99, 102, and 105) in Figure 14.3.
9. With reference to Table 14.2 and Figures 14.1 and 14.3, briefly describe the changes between 1971 and
1997/98
a. in the areas of high and low mercury distribution:
High mercury values in the West, Middle, and East Basins: high values of Hg in the West Basin, but they
Low mercury values in the Middle Basin: low values still occur in the northern part of the Middle Basin, but
0.12 to 0.24).
b. at the sites of the four highest 1971 values of mercury in the West Basin: Values at No. 1, 3,
c. in general for mercury at the same or similar sampling sites: All show significant
10. Are the regulations against dumping or release of heavy metals working to improve the sediment in
the lake? Explain.
11. Did the concentration of mercury in the harbor at Cleveland improve between 1971 and 1997/98?
12. At station 11 (approximately equal to station 74) the value for chromium went from 18 to 56 ppm
over the period.
(There are no chromium values shown in Table 14.2 for 1997/98.)
a. What was the change in mercury values for this period at this site?
b. What might explain such increases that do not represent the trend for contaminant concentrations?
Several possible explanations: eastward transport of more contaminated sediment, stations not on the same
13. Lakewide, almost all contaminant concentrations have decreased since 1971. In addition to the trend for
metals (e.g., Hg), polychlorinated biphenyl (PCB) sediment concentrations also decreased (from 136 ng/g
to 43 ng/g). (Note: n is nano or 10-9.)
a. Knowing that organic chemicals such as PCBs, DDT, and Mirex, etc., can bioaccumulate in fish and
other organisms, would it now be safe to eat any type and size of fish caught in the lake several times a
week? Explain your reasoning.
No. Contaminants are subject to bio-concentration in the food web and older, larger fish would have
higher concentrations.
b. Where would you seek information on eating fish from Lake Erie (i.e., a fish advisory)? Give specific
Web (URL optional) or other sources you would check.
3
Natural Resources (ODNR), Ohio Department of Health (old sites, but no longer issues Fish
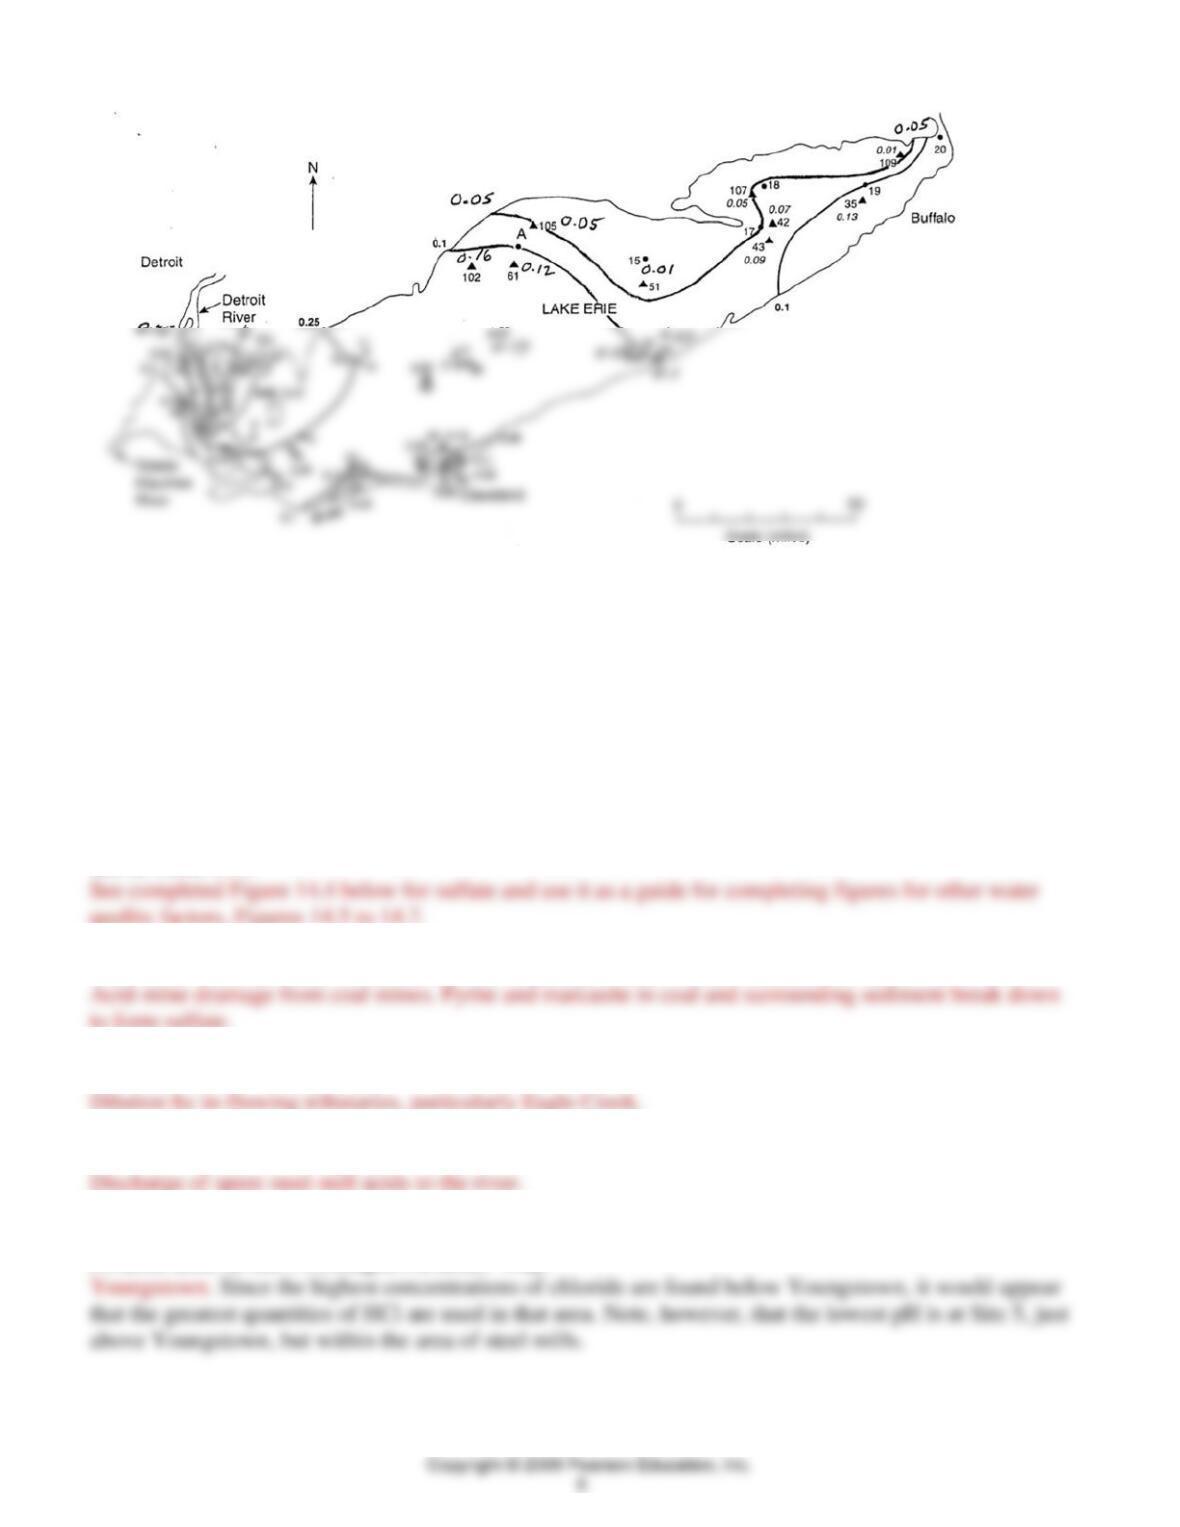
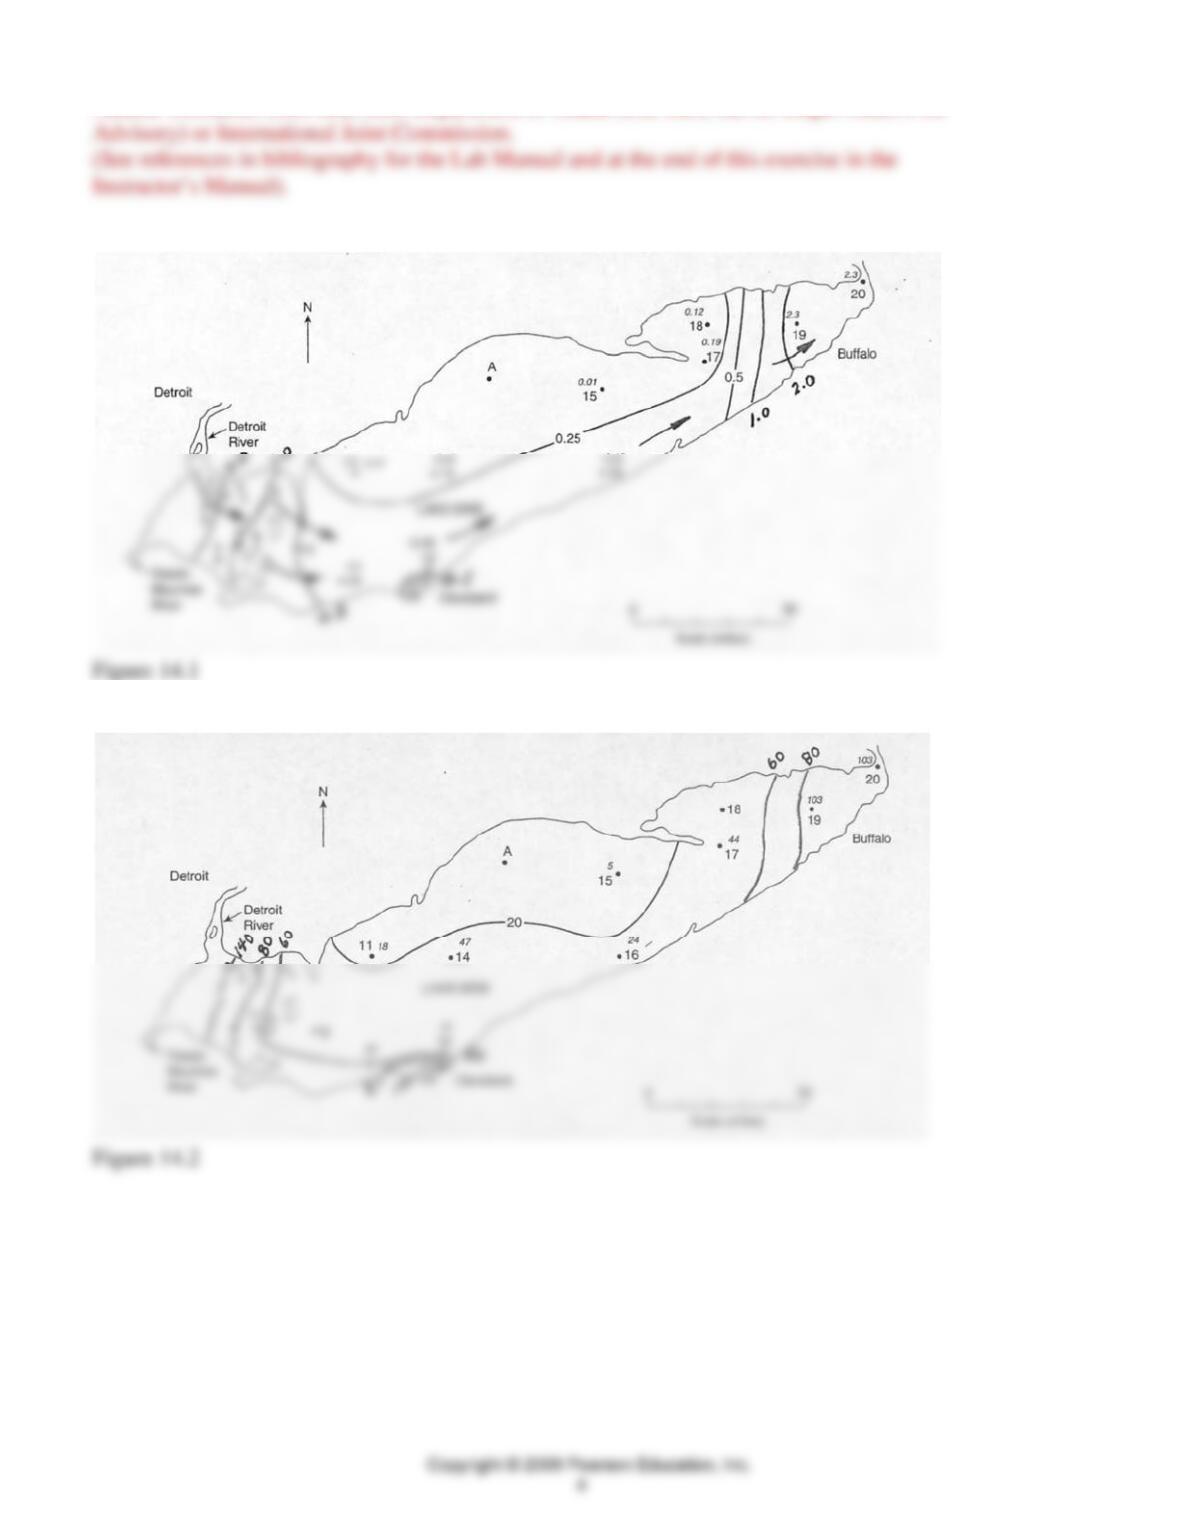
Figure 14.3
(Updated Data in Table 14.2 and Figure 14.3 based on Painter et al., 2001; used with permission, J of Great Lakes
Research)
QUESTIONS 14, PART B
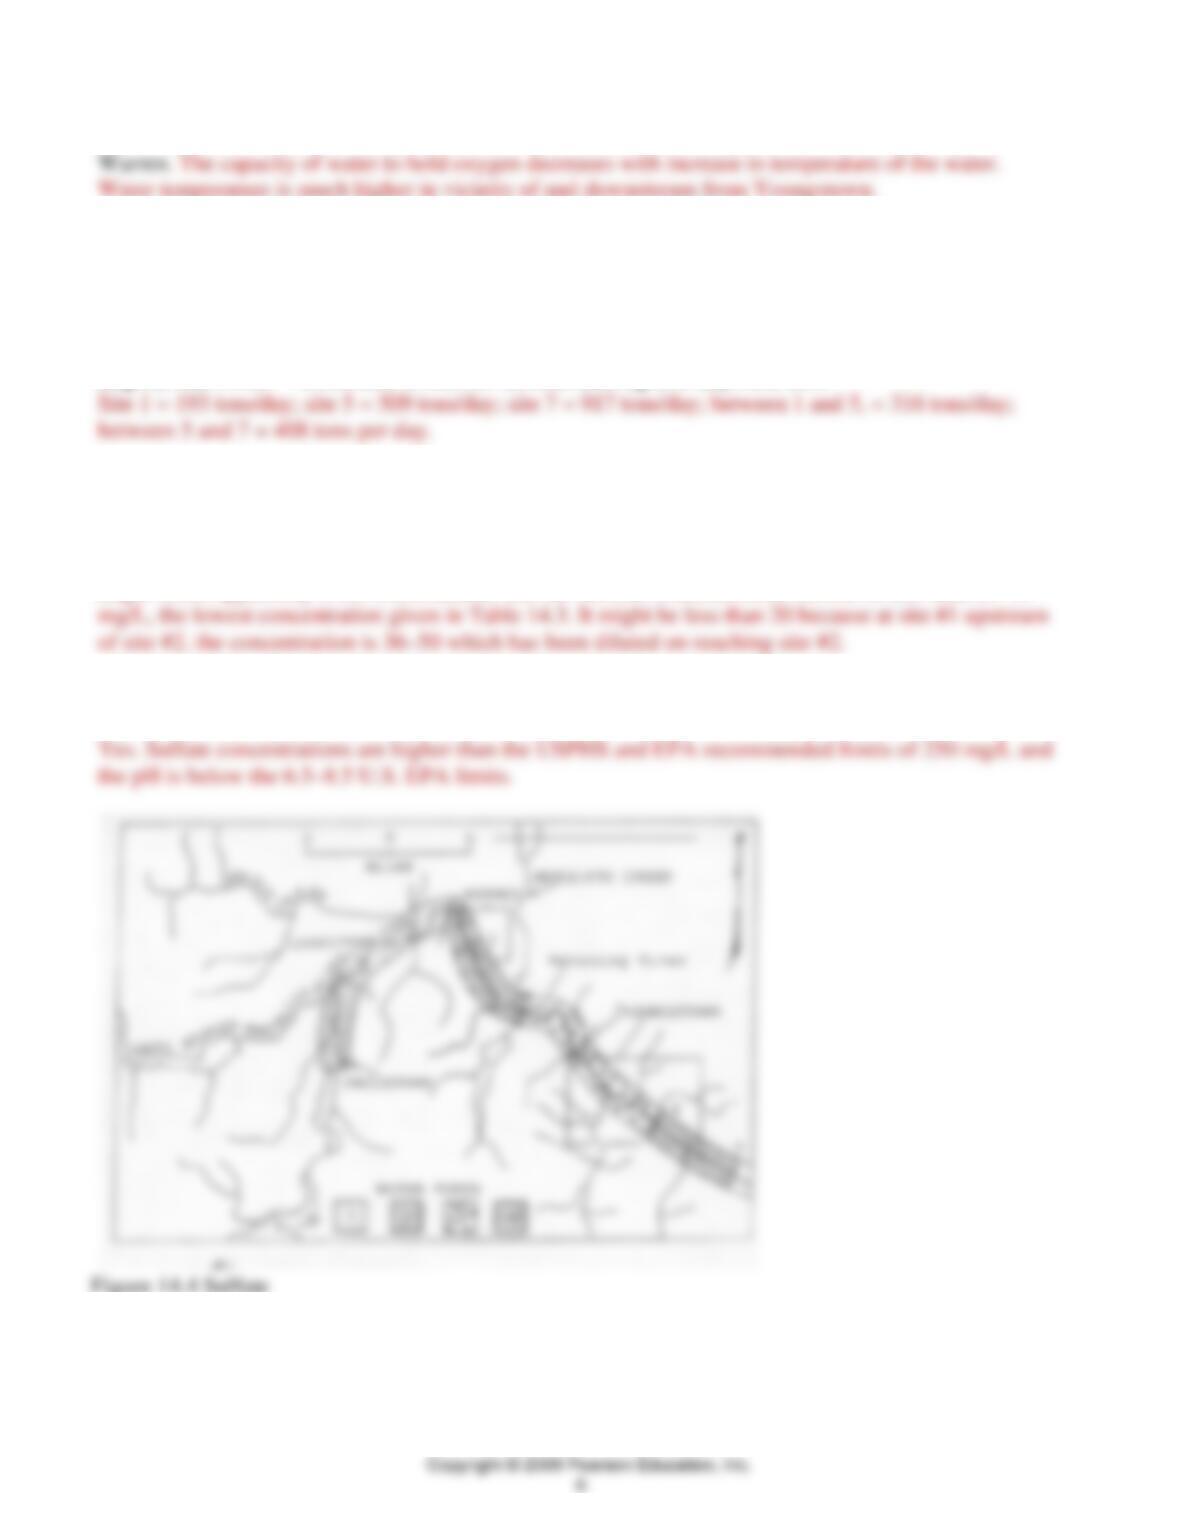
1. Use the following four maps, Table 14.3, and a color code to distinguish the four water types given in
Table 14.4 (type 1, blue; type 2, yellow; type 3, green; type 4, red). Color the outlined area along the
Mahoning River to indicate the range of sulfate, chloride, pH, and temperature in the reach represented by
each sample collection site. The data for each site in Table 14.3 refer to the reach of the river extending
upstream to the next sampling site. Make a separate map for each water-quality factor. You may use distinct
patterns if color is not available. Note: water types are defined by concentration range in each figure caption
and in Table 14.4.
quality factors, Figures 14.5 to 14.7.
2. What is the most likely source of the relatively high sulfate concentration at site 1?
3. Why did the sulfate concentration decrease from site 1 to site 2?
4. Why did the pH decrease significantly between sites 2 and 5?
5. Do the data suggest that the greatest quantity of hydrochloric acid is used in the vicinity of site 3
(Warren area) or site 5 (Youngstown area)? Why?
6. Considering the temperature data, would you expect the dissolved oxygen content to be higher
upstream from Warren (sites 1, 2) or in and downstream from Youngstown (sites 5,6,7)? Why?
7. The mean discharge at sites 1, 5, and 7 was 408, 673, and 809 cubic feet per second (cfs), respectively.
On a date characterized by the mean flow, the sulfate concentration at these sites was 175, 280, and 420
mg/L, respectively.
a. What was the increase in sulfate load, in tons per day, between sites 1 and 5, and 5 and 7? Use the
equation: load = Q x C x 0.0027, where Q = stream discharge (cfs), C = concentration of contaminant
(mg/L), and 0.0027 = a constant to convert seconds and mg/L to days and tons.
b. What is the major source of this sulfate increase?
Spent sulfuric acid from steel mills.
8. What would you expect the chloride concentration to be in Eagle Creek? Explain.
Eagle Creek apparently is not contaminated and the chloride concentrations should be less than 20–35
9. Do any constituents in the Mahoning River in the Youngstown area exceed any drinking water quality
limits? If so, which ones?
10. Since the 1960s when there was uncontrolled waste disposal from seven steel mills operating in the
area, water quality in the Mahoning River has improved significantly due to environmental regulations
that require wastewater treatment of effluent from all industries and municipalities. Worldwide competition
from modern steel mills resulted in the closing of some steel mills here, further improving water quality. In
2005, the river was still one of the five most contaminated rivers in the United States. Recent measurements
of water quality (Stoeckel and Covert, 2002) show that the limits for three physical/chemical parameters for
healthy desirable aquatic organisms were only occasionally exceeded (dissolved oxygen [DO], pH, and
temperature). The river still does not meet standards for swimming and wading, however. Two additional
factors, sewer effluent and toxic sediments in the river, result in a human health advisory for the river from
Warren, Ohio, to the Pennsylvania/Ohio line. Overflows of combined storm and sanitary sewers during wet
weather contribute Escherichia coli (E. coli) and nutrients, and the sediments contain toxic organic chemicals
from disposal practices prior to regulation (get additional information at:
http://oh.water.usgs.gov/reports/Abstracts/wrir02-4122.html).
a. How should the region address the E. coli problem in this river system? (E. coli indicates recent fecal
contamination from gastrointestinal tracts of humans or animals, and possible presence of pathogens that
may adversely affect human health.)
Many older cities have some combination wastewater and storm-water sewers, left over from the days when
b. A preliminary study of river sediment by the U.S. Army Corps of Engineers (USACE) recommended
removal of 750,000 cubic yards of sediment with organic toxins to a secure waste disposal site to remove the
human health advisory. The proposed Mahoning River Environmental Dredging Project would be the second
largest USACE restoration project (the Everglades is first) and would require about $35 million in local
money (Eastgate Council of Governments, n.d.). You will find useful information to help answer parts of
c. Should the region and the nation expend funds to remove this environmental hazard, a liability to
economic development? Explain.
Yes or No
d. What are the options for dealing with the contamination of the Mahoning River?
No action (With-Out-Project) Alternative
e. According to online information, how much will the federal share be?
f. What are the options for disposal of any sediment that is removed?
Depending on contaminant concentrations disposal options may include:
11. On the EPA website, http://www.epa.gov/owow/watershed/, go to your own watershed somewhere in
the United States, or select one in an area of interest to you by clicking on the following: Surf Your
Watershed, Locate Your Watershed, Search by Map or Zip Code. When you find Your Watershed, click
on Stream Flow.
a. Select and click on one of the USGS Station Numbers and complete the following:
______________
8-digit USGS
______________
Creek or River
At ______________
Town or City
______________
State
b. What is the elevation of the gage?
c. What is the gage height today?
d. What is the stream flow or discharge (cubic feet per second) at this station?

d. Return to the previous page, and select Project Executive Summary. From the Executive Summary
page, describe the two most interesting projects from the Innovative Ideas list.
References for Exercise 14B