QUESTIONS 11, PART A
Refer to Figure 11.1 to answer Questions 1 and 2. For Questions 7 and 8 you will need a sheet of tracing
paper the size of the photos (about 4” by 8” ). (Questions 7–18 are modified from Kennedy and Mayer,
1979.)
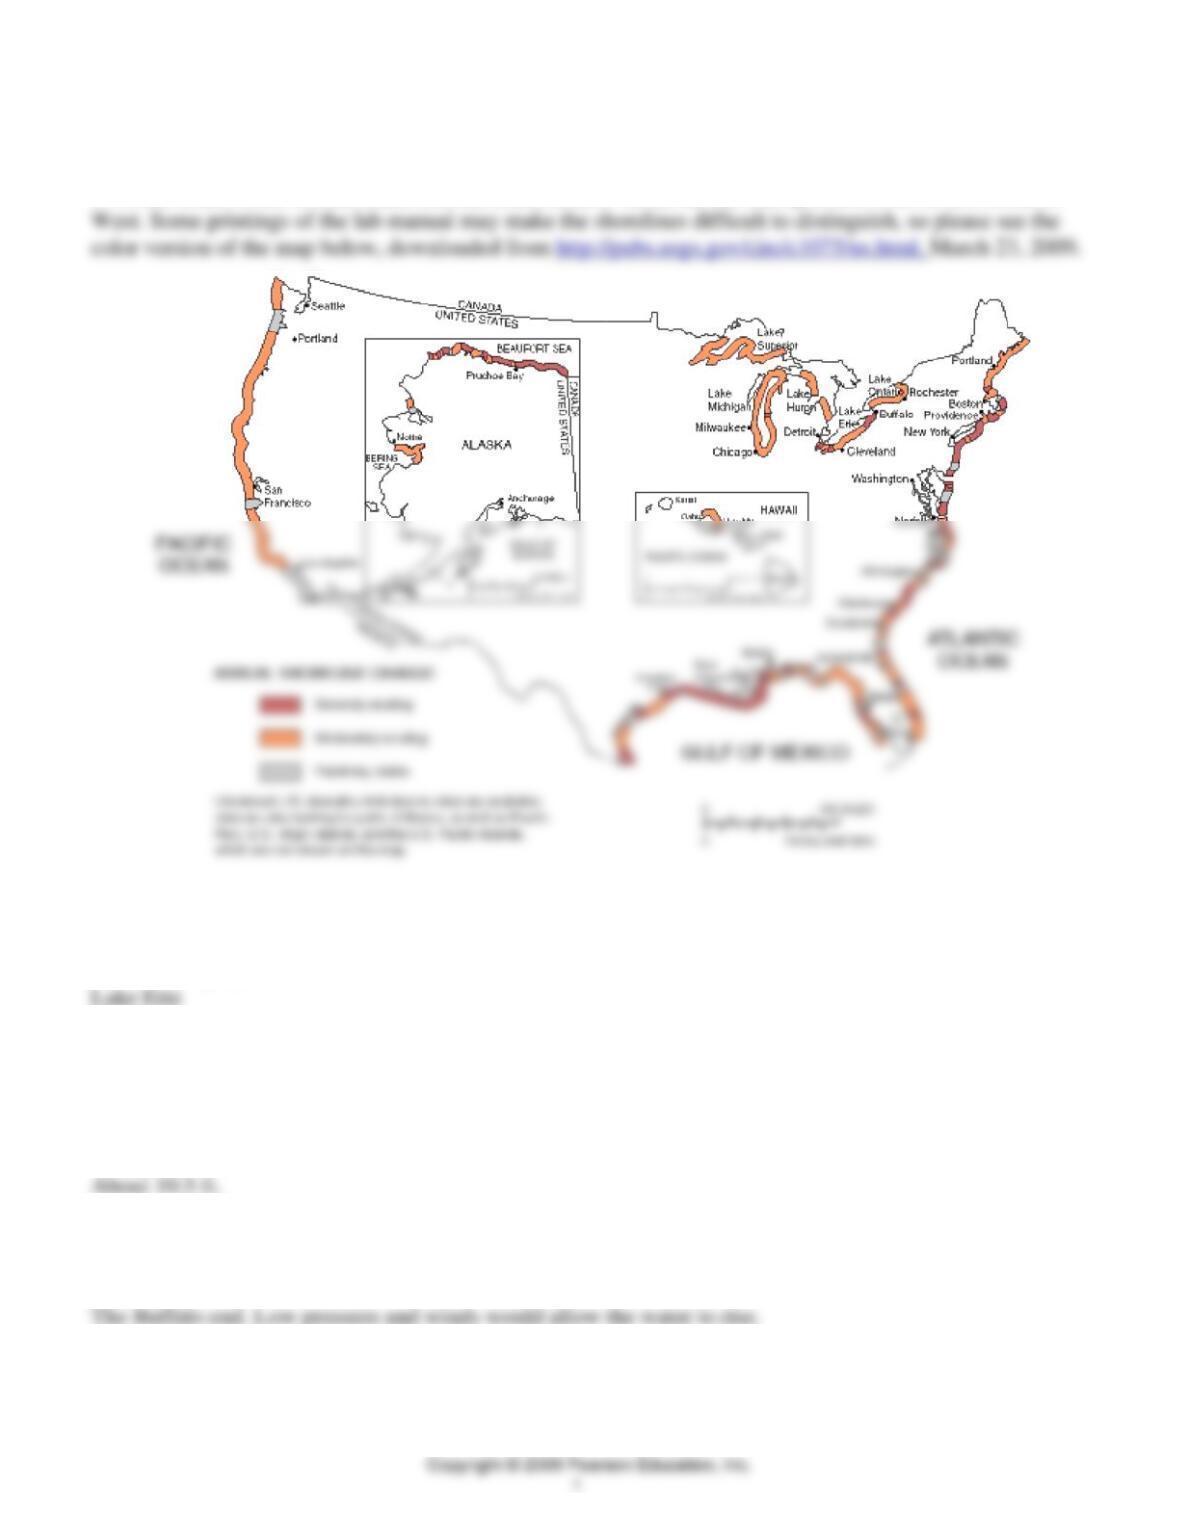
1. Which coast of the United States (north, south, east, or west) has the least problem with severe erosion?
2. According to Figure 11.1, which Great Lake has the highest percentage of U.S. shore in the severe
erosion category?
3. Many factors affect rates of coastal erosion (see Part B). List three.
Students should list factors from Table 11.1
4. Refer to Figure 11.2. What was the maximum change in feet from high to low water level at Toledo
during the December 1987 storm?
5. If the water-level differences between Buffalo and Toledo were due mainly to atmospheric pressure
differences, over which end of the lake would the low-pressure area have been at midnight on December
15, 1987?
6. Refer to Figure 11.3 and determine average annual rates of coastal retreat between 1876 and 1937.
Measure distances perpendicular to the coast and use the scale given. Record measured distances, too.
a. Half-inch from the east margin of the diagram? Rate _______ ft/yr
b. Half-inch from west margin of the diagram? Rate _______ ft/yr
c. Coast with the least change? Rate _______ ft/yr
7. Compare the 1954 and 1973 photos (Figure 11.4). Describe the physical and cultural changes that have
occurred along the coast. (The photos are almost the same scale; Figure 11.8 shows lake level change.) The
beach in the western half of the area has almost disappeared, the bluff in the eastern half has eroded
8. The straight objects jutting into the water are groins, structures designed to protect the bluffs by
trapping sand and gravel. What changes have occurred from 1954 to 1973 in the number of groins?
9. List the physical processes involved in the changes that have occurred on this coast.
Erosion at the base of the bluffs, slumping and erosion of the bluff face, and longshore transport of beach
material.
10. Cover the 1954 photo with a half sheet of tracing paper and secure it with paper clips or removable
masking or clear tape.
a. Outline major streets within an inch of the east–west road along the top of the bluff, to provide
reference marks.
b. With a sharp pencil on the tracing paper, trace the base of the bluff with a solid line and the shoreline
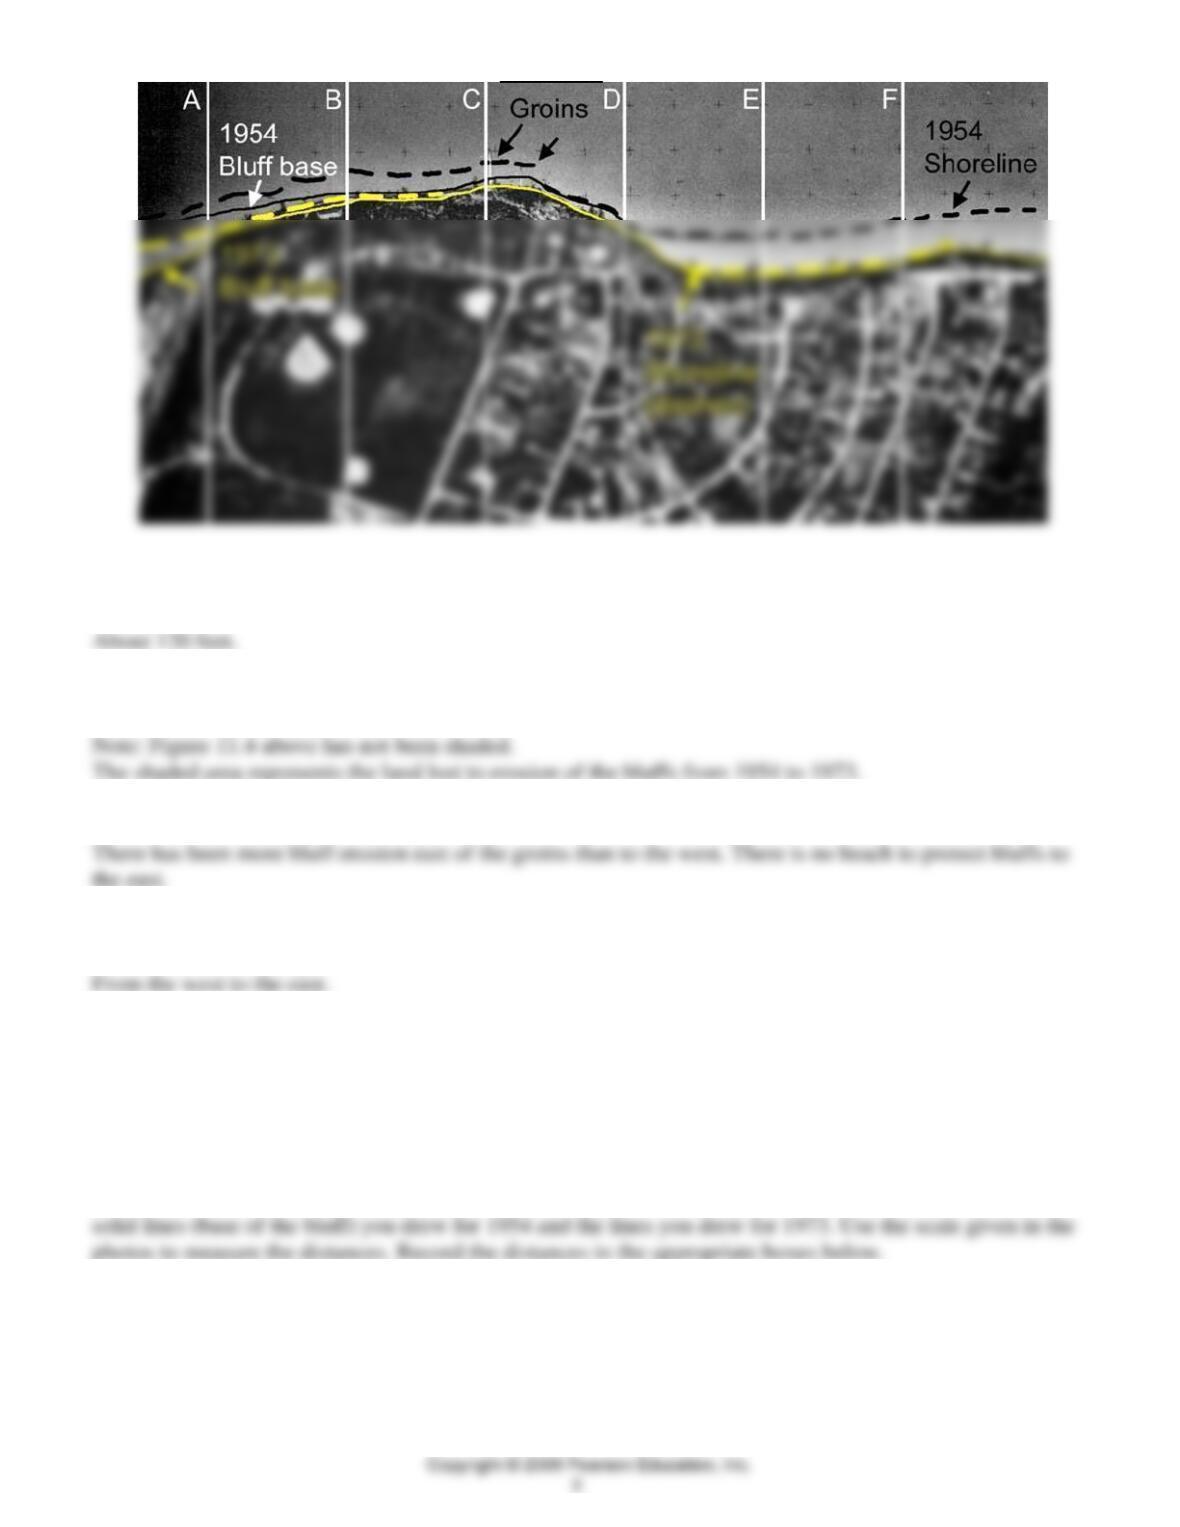
Figure 11.4 example sketch (without tracing paper).
11. What is the maximum width of beach lost between 1954 and 1973?
12. Shade the area between the 1954 and 1973 solid lines representing the base of the bluff. What does the
shaded area represent?
13. Compare and explain the changes in the coast west and east of the groins.
14. From your observations of the beach in the top photo and the net change in the coast, what direction
does the dominant longshore current flow?
15. What really protects the bluffs along the coast from the energy of the waves when groins are installed?
The beach.
In this part of the exercise we will use the changes in the position of the base of the bluff, as measured
along the six reference lines, to determine the rate of recession of the coast and to predict the future
position of part of the coast.
16. At each of the reference lines (A–F) on the tracing paper or overlay, measure the distance between the
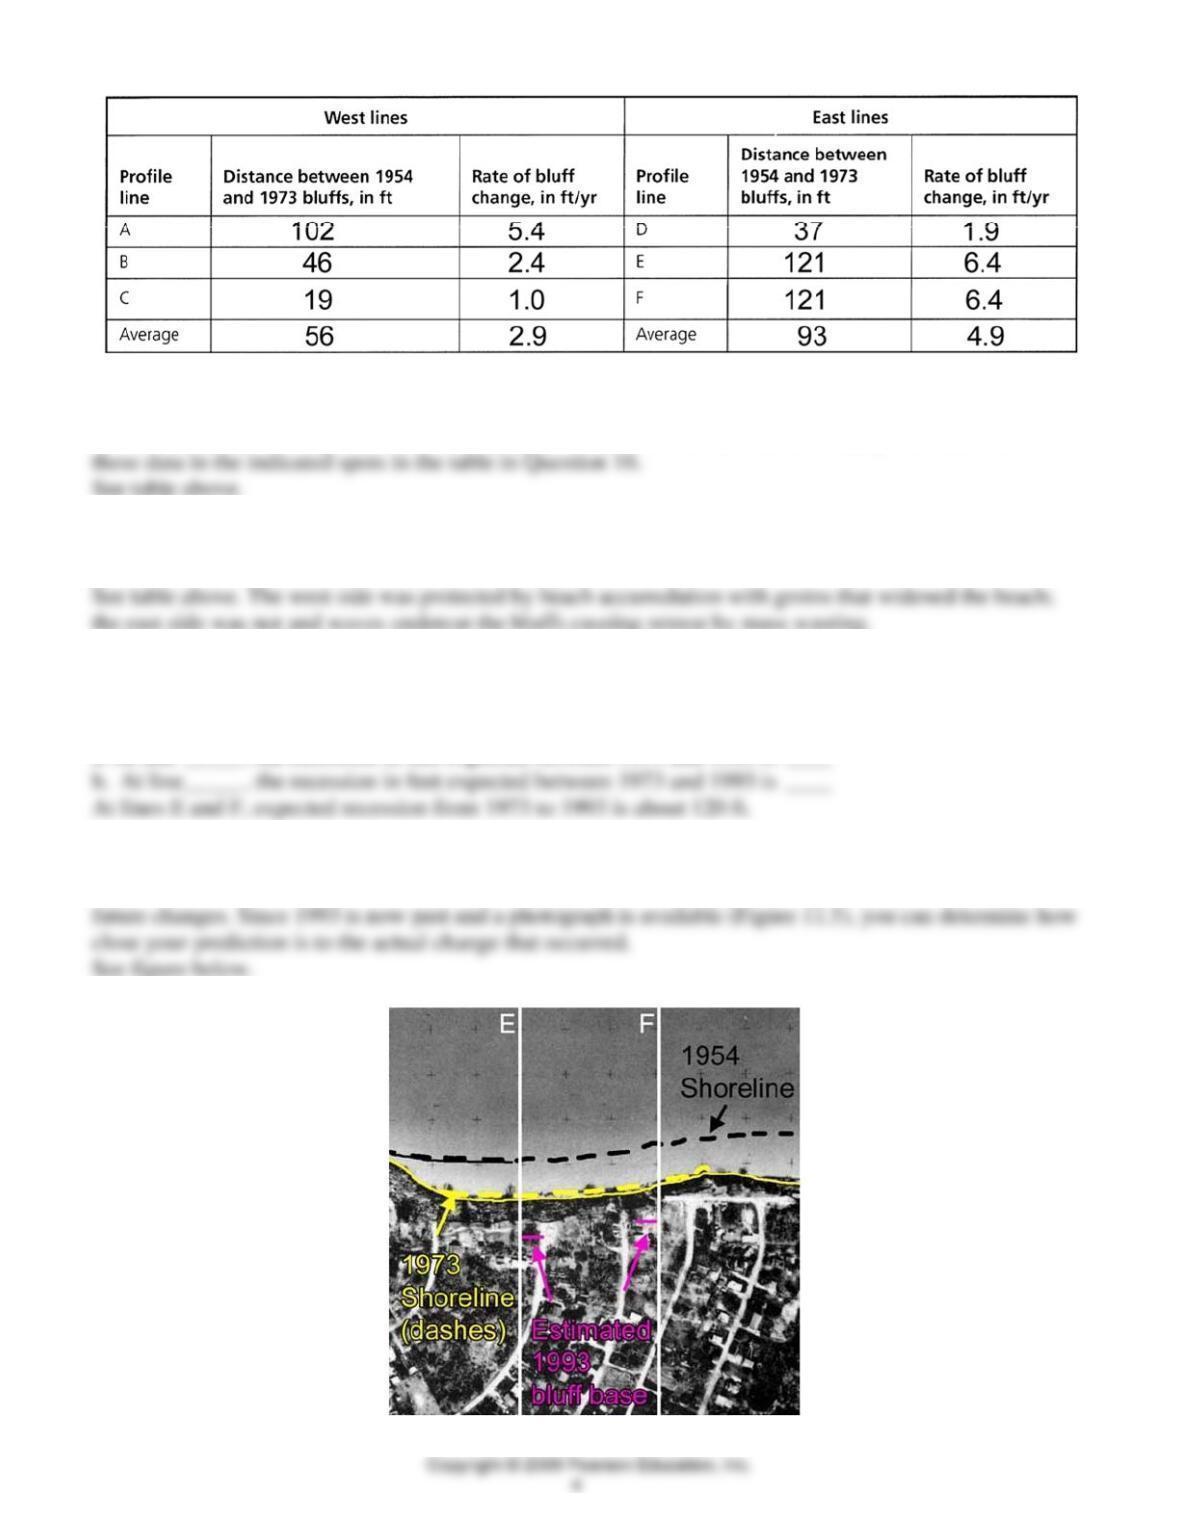
17. Divide each measured distance between 1954 and 1973 bluffs by 19 years (the time between 1954 and
1973) to obtain the average annual rate of change in the position of the bluff for each profile line. Record
18. Determine the average distance and rate for the western and eastern part of the coast. What geologic
processes can explain the differences in the average rates?
19. Assuming the annual rates determined at the two reference lines with the most rapid recession,
calculate how much recession would be expected at these lines by 1993.
a. At line _____, the recession in feet expected between 1973 and 1993 is ____
20. Plot on your tracing paper map, using long dashes, the expected 1993 coastline between the two lines
with the most rapid recession. You have now used your understanding of past geologic processes to predict
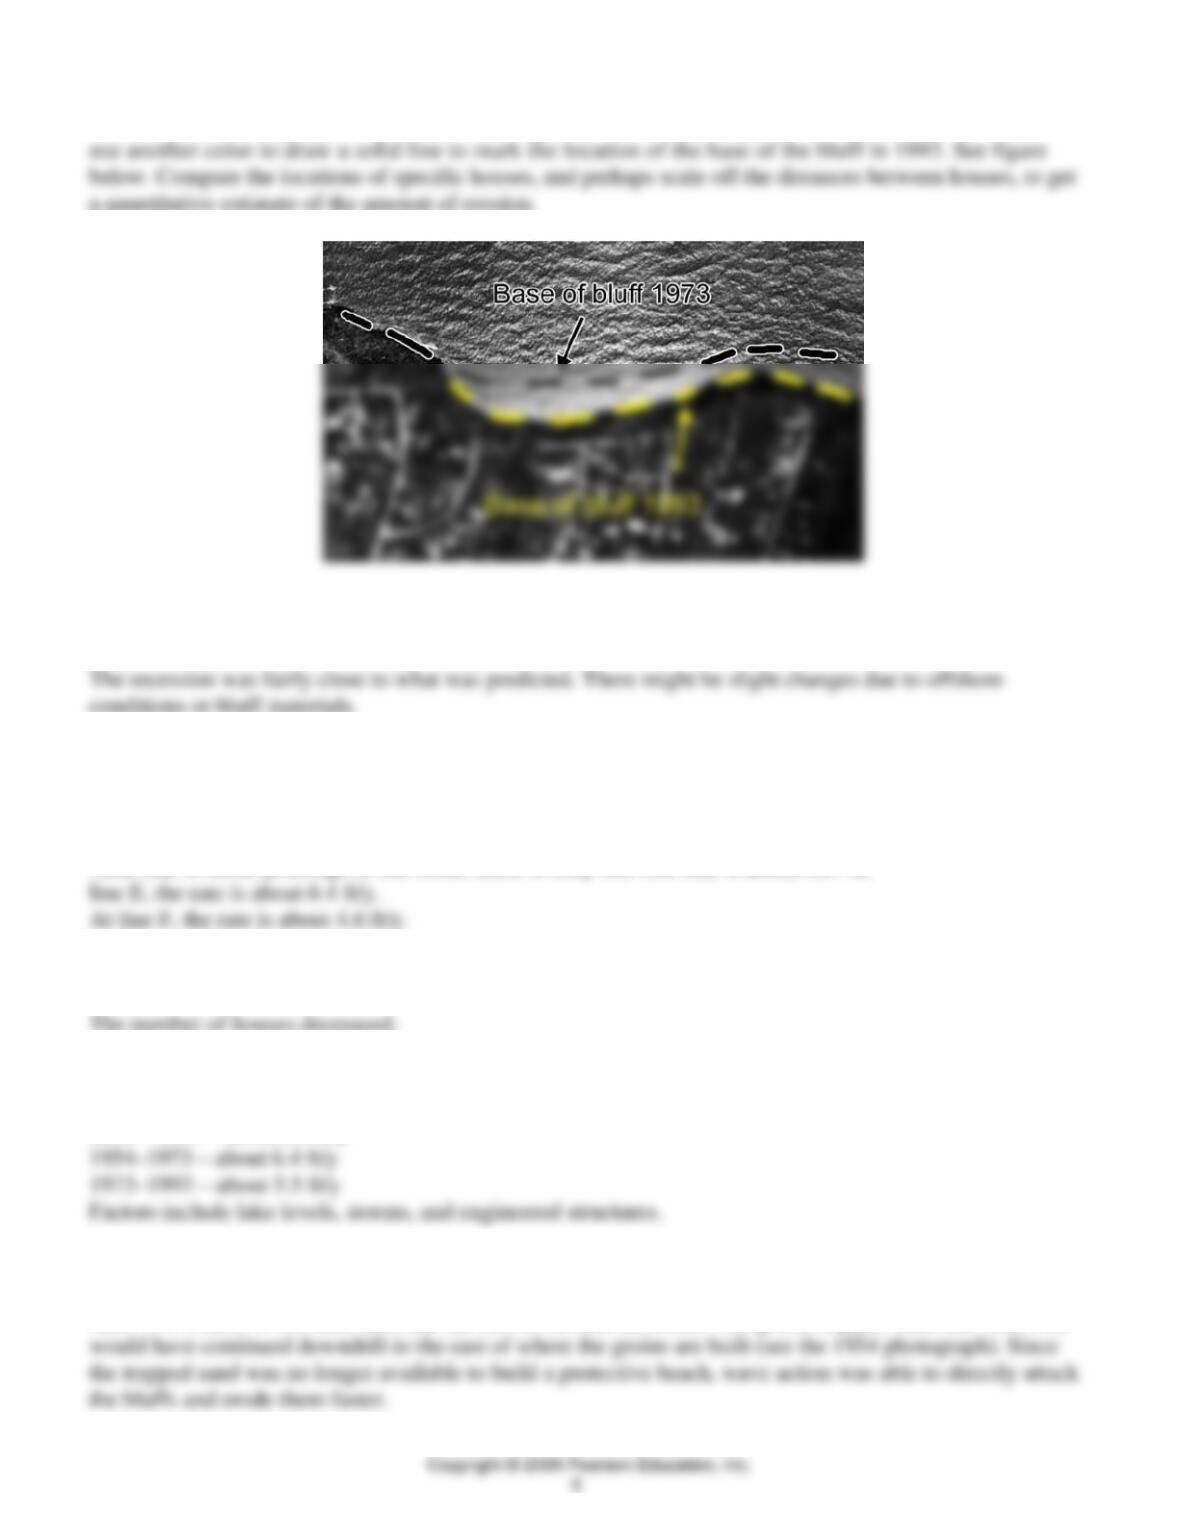
21. Place your tracing paper map over the 1993 photograph (which is approximately the same scale), and
22. Describe the differences between the actual recession and the recession that you predicted. What are
possible reasons for the differences, if any?
23. What were the average annual recession rates at the two lines that had the most rapid retreat between
1973 and 1993?
a. At line _____, the recession rate in feet/year between 1973 and 1993 was_____
b. At line _____, the recession rate in feet/year between 1973 and 1993 was_____
Note that in some printings of the book, there is only one line that is asked for. At
24. Compare the position and number of houses in the 1954, 1973, and 1993 photographs. What changes
occurred?
25. How do the average annual rates for recession of the bluffs for the periods 1954–1973 and 1973–1993
compare with the rate of recession from 1876–1937? What factors might explain the differences?
1876 – 1937 – about 2.4 ft/y
26. If installation of the groins was a factor in the different rates, when do you think they were installed?
_____ Explain. Refer to Figure 11.3.
After 1937, since it was after then that the rate of erosion increased. The groins trapped sand that otherwise
27. Many coastal experts have suggested that structures that interfere with longshore drift should not be
build along shorelines because they produce net erosion. Do you agree or disagree with the experts?
28. As a consulting coastal geoscientist, you are asked by the residents of the area for help in solving their
problem. What advice do you give them?
Among the options that might be considered are:
1. Move (but if you sell, who would buy?).
QUESTIONS 11, PART B
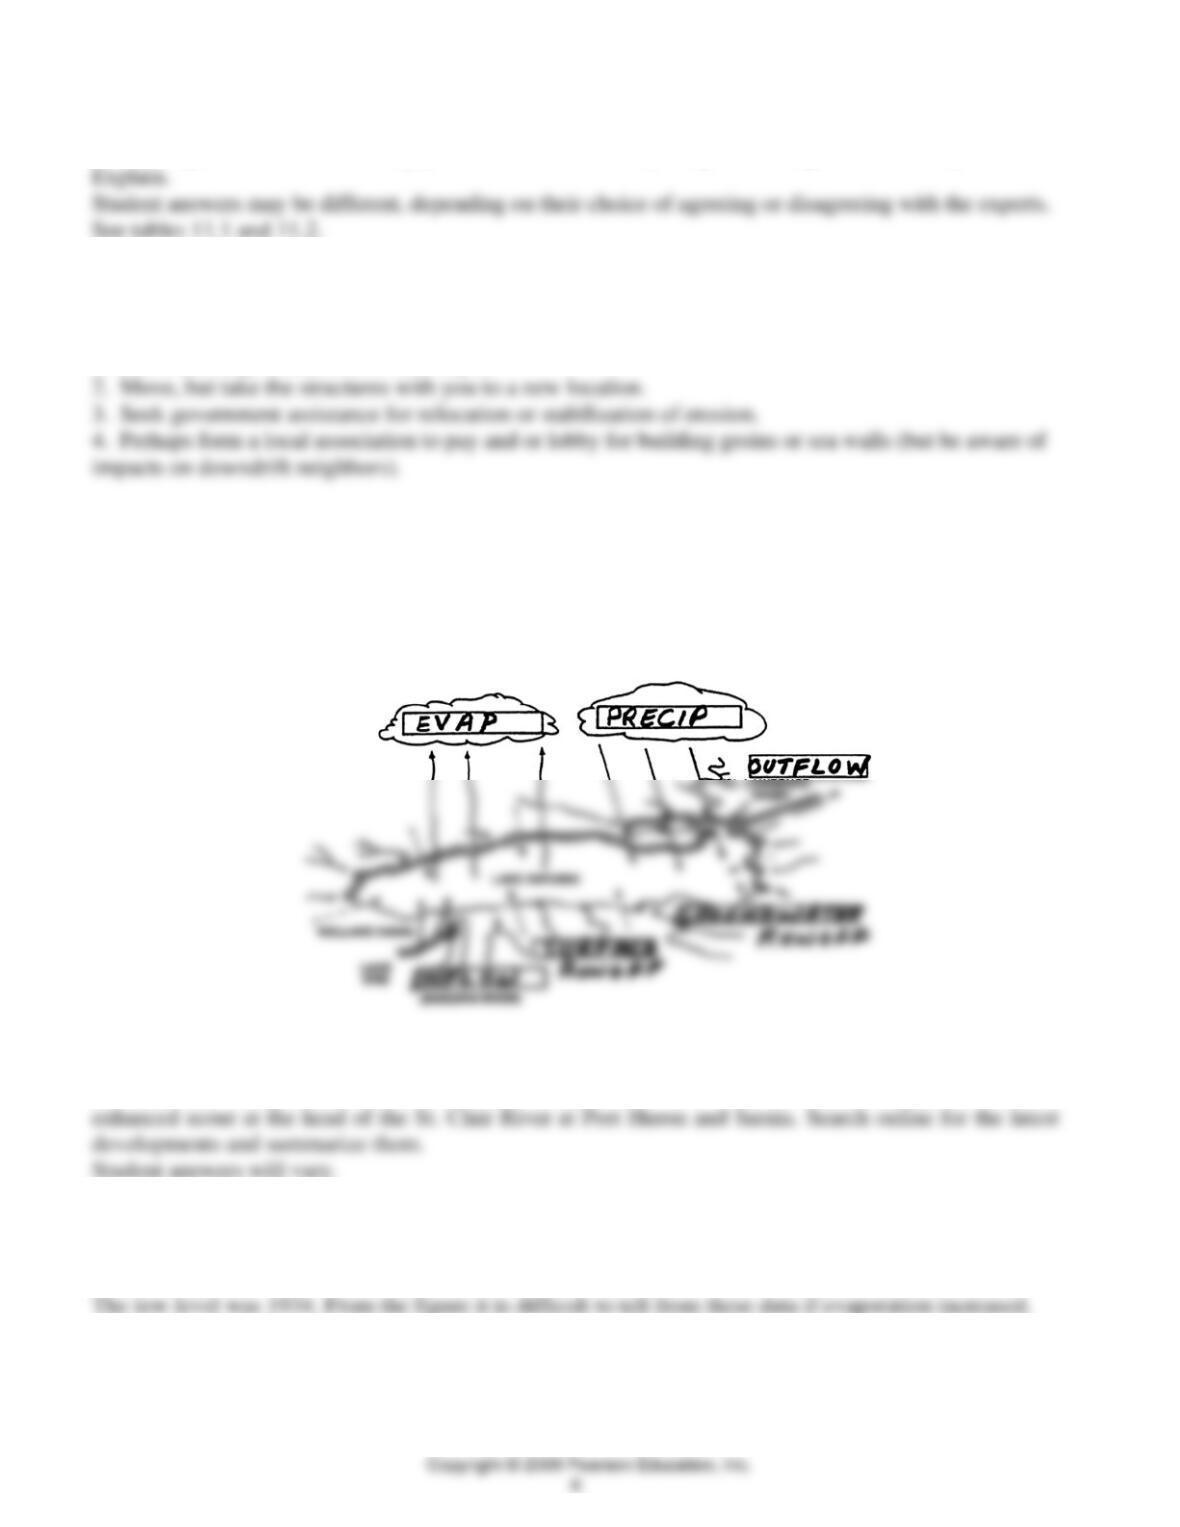
1. Read the introduction to Part B and enter the processes controlling lake levels in the appropriate boxes in
Figure 11.6.
See figure below.
2. (Web research question) Lakes Huron and Michigan are at low levels. One factor appears to be the
3. In Figure 11.7, the lowest level shown occurred at the time of the “dust bowl” on the western plains.
When was this low level of Lake Erie? From the figure, is there any evidence that the evaporation rate
from Lake Erie must have been high?
4. On an annual basis, in what months is Lake Erie (and the other Great Lakes) likely to be highest? When is
it likely to be lowest?
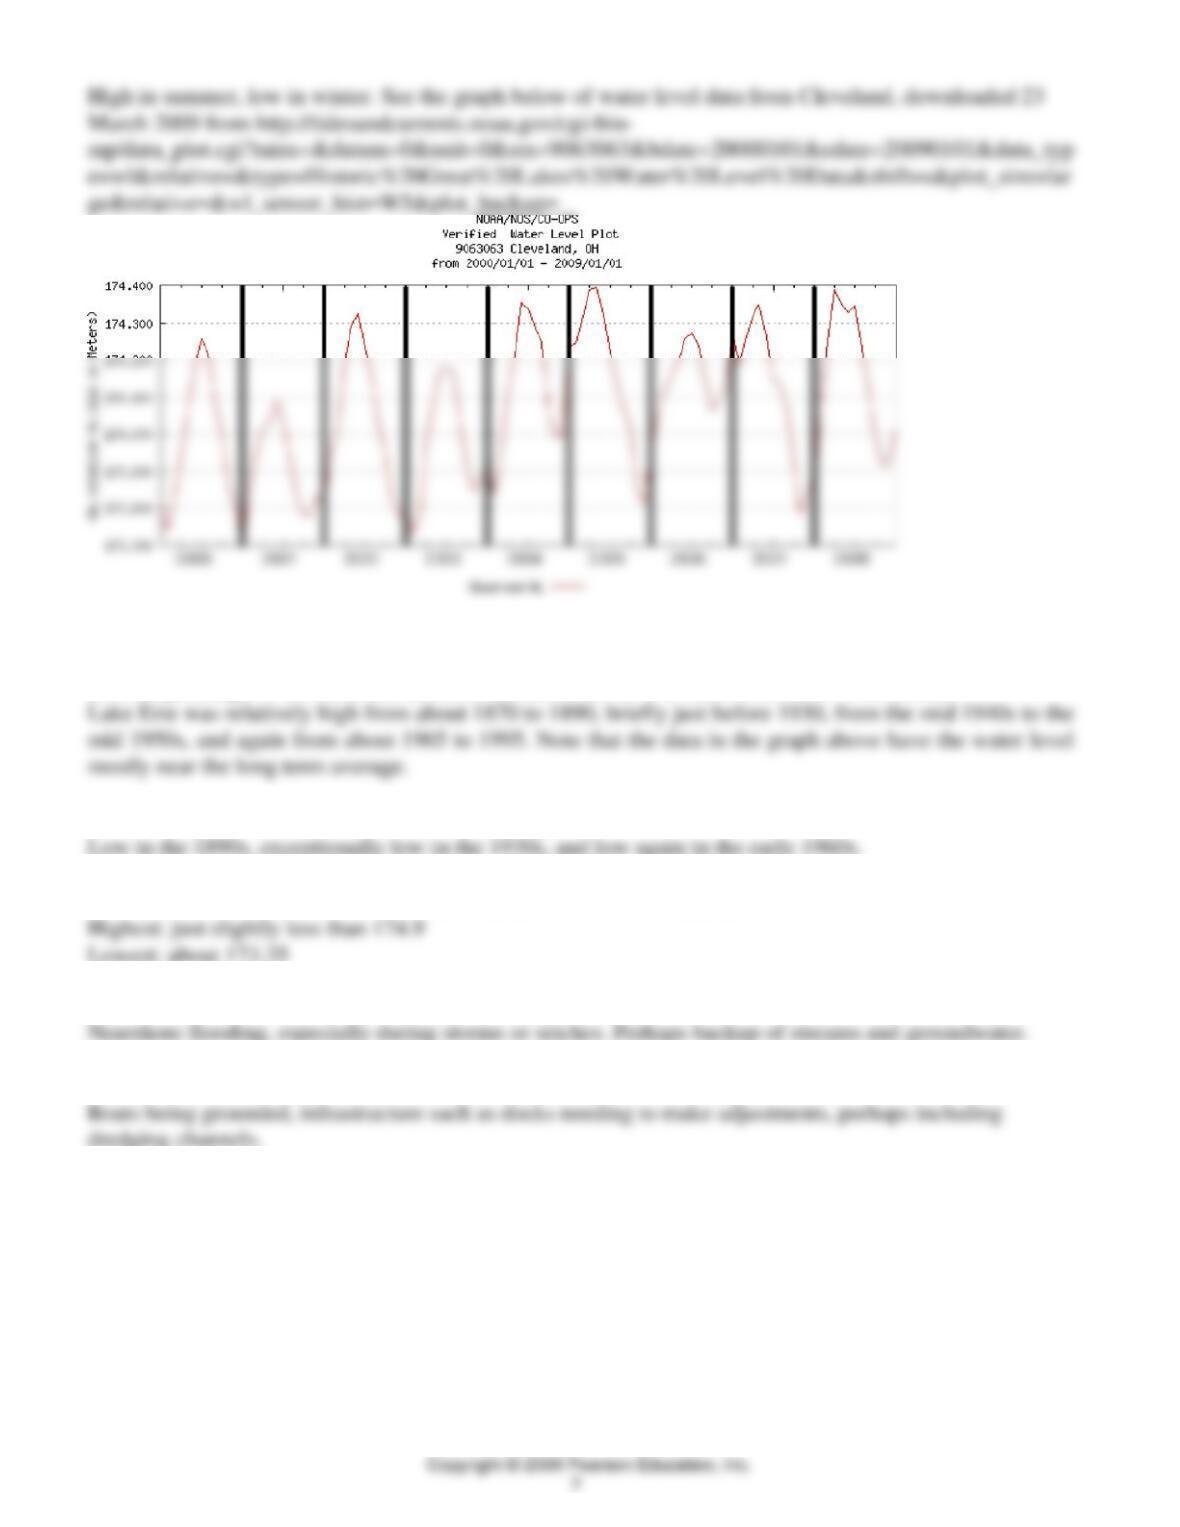
5. Study Figure 11.8. In what periods (by beginning and ending years) since 1860 has Lake Erie been
unusually high? Assume a mean elevation of about 570.4 feet.
In some printings of the book, the mean elevation is shown as a value of about 174.12 meters.
6. In what years has Lake Erie been unusually low?
7. What are the highest and lowest annual mean elevations for Lake Erie?
8. What are the hazards associated with high lake levels?
9. Are there any hazards or impacts on society of low lake levels? Explain.
10. From the information gathered in Parts A and B of this exercise, we have seen that the water levels in
the Great Lakes are likely to continue fluctuating. Although global warming could change averages and
ranges of water levels, in any case erosion is expected to be a problem in some areas. To reduce losses to
individual coastal residents and to taxpayers (who pay for roads, water supplies, insurance subsidies, tax
deductions for lost buildings, and rescue costs in the coastal zone), expanded land-use planning and

zoning of coastal areas by state, provincial, or municipal governments may be warranted. On a separate
sheet of paper:
a. Discuss the advantages and disadvantages of a 50-year building-setback zone. With such a setback
zone, no permanent residential structures may be installed on the coast within the expected 50-year
erosion zone.
b. Also discuss any alternative that would minimize interference with the physical and biological
processes along the coast, resource loss, and costs to individuals and to society.
QUESTIONS 11, PART C
Refer to Figures 11.10 and 11.11, which are two maps of the Washington coast. Figure 11.10 is a 1915 map
that shows the Ocean Shores area, and Figure 11.11 shows the same area in 1994. The original maps were
different scales, and they have been reduced for use in this exercise.
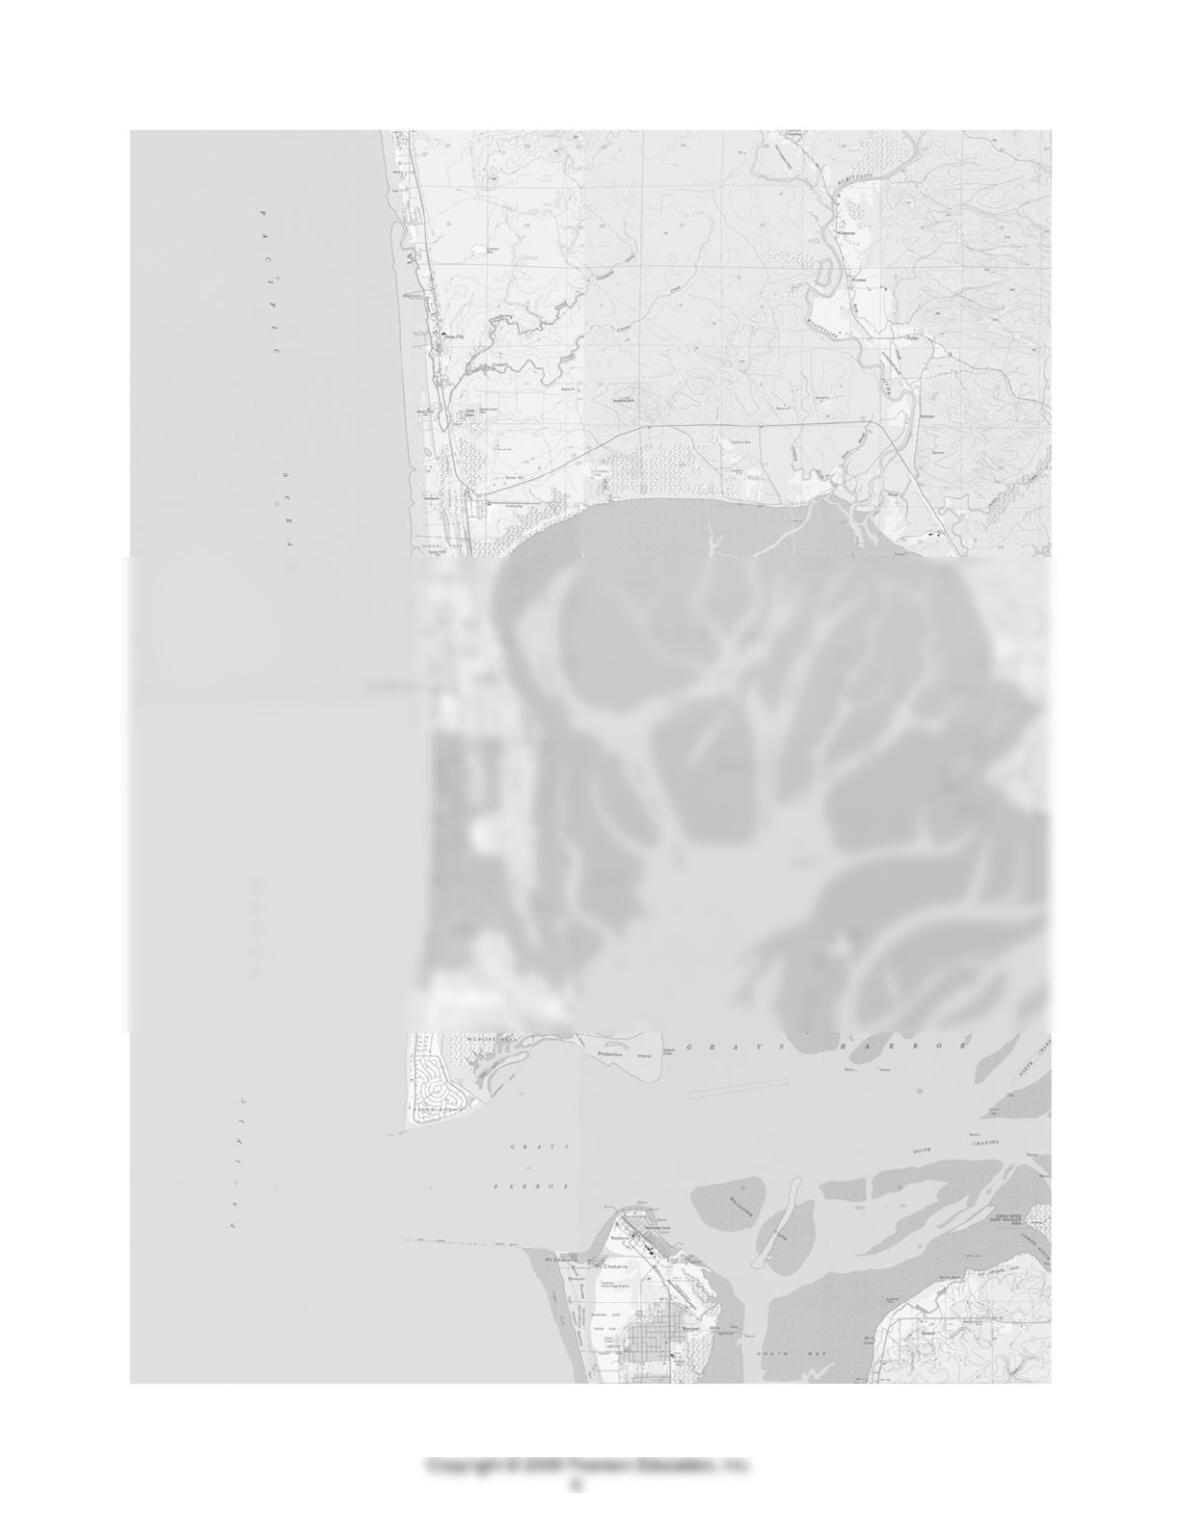
There are also three additional maps in this answer section. The first is the most critical, as it is the correct
version of Figure 11.11. The image in the first printing shows only part of the area, and questions 1 through
11 cannot be answered using this map. Please use the version of Figure 11.11 that is included in this
Four original topographic maps of the Ocean Shores area are also included as pdf files in this section. The
four quads are Copalis Beach (the NW quad), Copalis Crossing (the NE quad), Point Brown (the SW quad),
and Westport (the SE quad).
The answers below are based on using the correct map, which combines the four topographic maps of the
Ocean Shores area, for Figure 11.11. Note that if you are using the first printing of the book, that Figure
11.11 is only the Copalis Beach quad portion of the study area.
1. What changes have taken place between 1915 and 1994 in the shape of the coast near Ocean Shores? It is
especially important to look in the area of the two jetties at the entrance to Gray’s Harbor. There has
2. Based on these maps, has deposition or erosion been dominant between 1915 and 1994 near Ocean
Shores? Near Westport? Explain your evidence.
3. What changes in land use have taken place between 1915 and 1994 in the area shown on these maps?
Much population growth. Ocean Shores is a resort destination for people from the Tacoma-Seattle area.
4. What is the highest elevation of land in Ocean Shores? Westport?
5. What do the changes in land use imply about the risks from storm waves or tsunamis in this area?
Tsunami Wave Heights
There are two different common origins for tsunamis that can strike the coast of the Pacific Northwest.
The first are tsunamis that are generated by distant geologic events, such as the Alaska earthquake of
1964. The second are tsunamis that are generated by local subduction zone earthquakes.
After the 1964 Alaskan earthquake, tsunami waves in this area reached 9.7 feet above the water level of
the tides at Ocean Shores, and 14.7 feet above tide at Wreck Creek, which is about 20 miles north of
Ocean Shores.
6. Study the 1994 topographic map (Figure 11.11) to determine areas that would be impacted by a 10-feet
rise in water. Use a colored pencil and mark these areas on the map. Assume that the 10-foot contour is
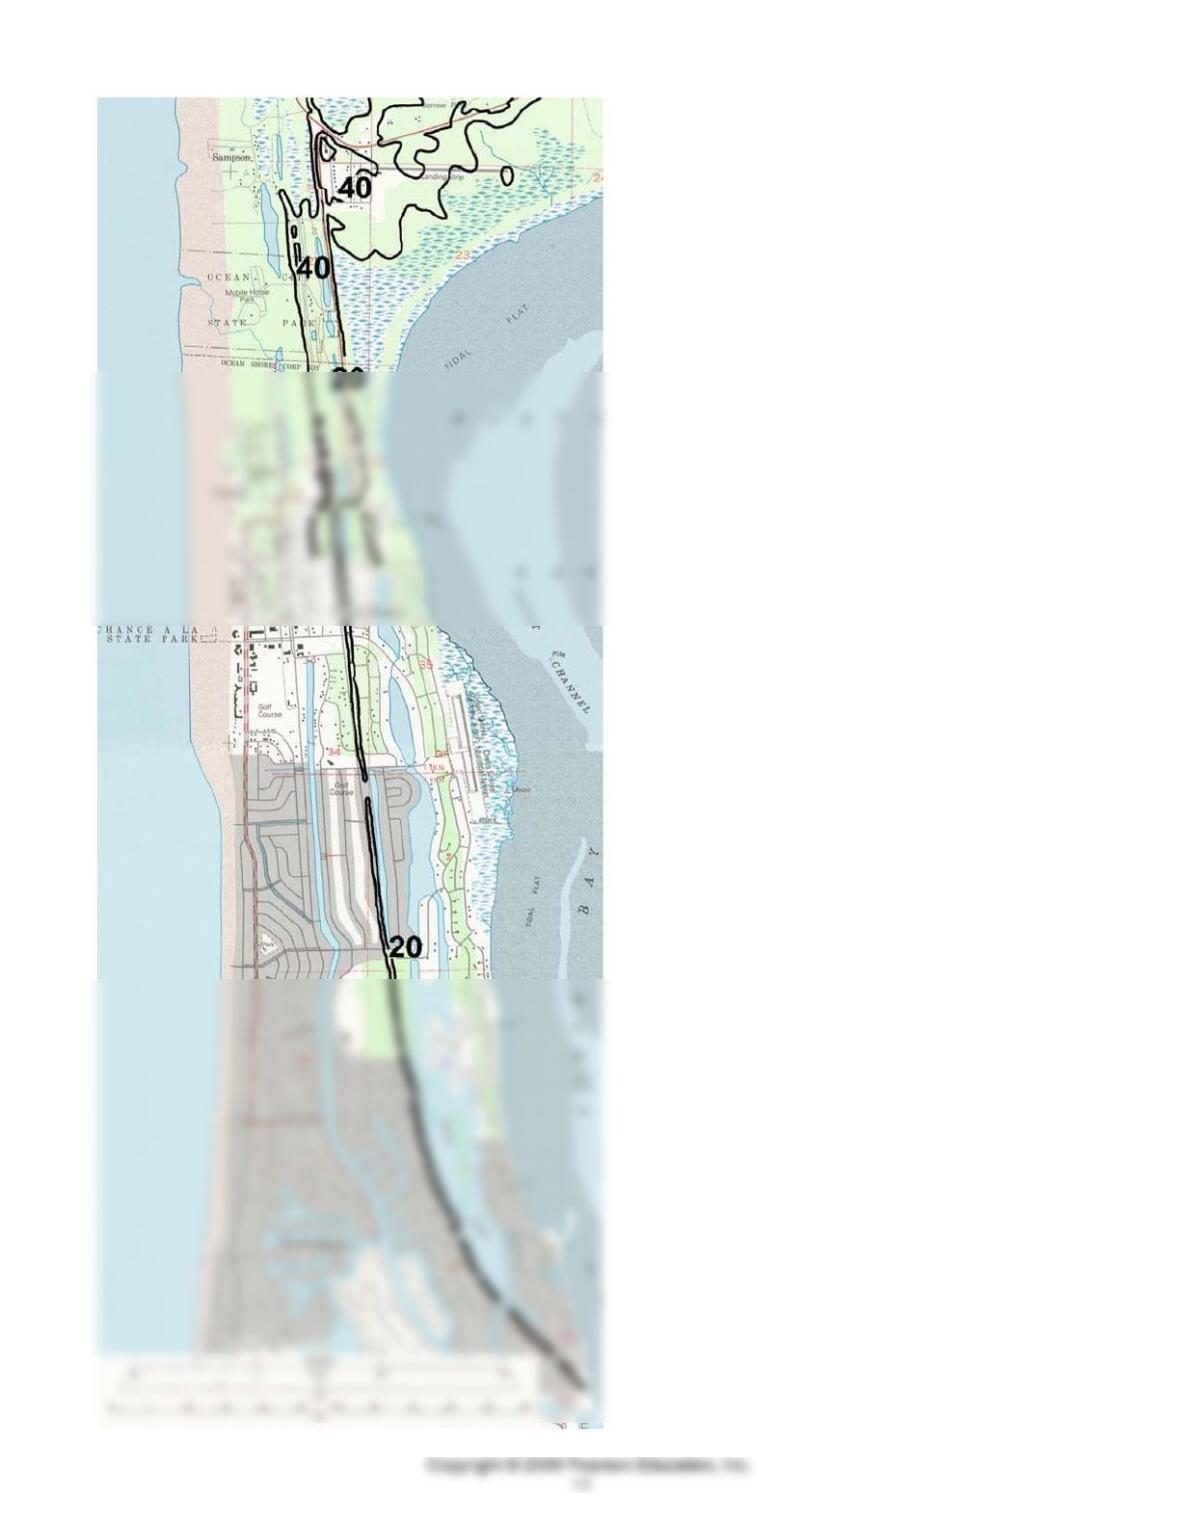
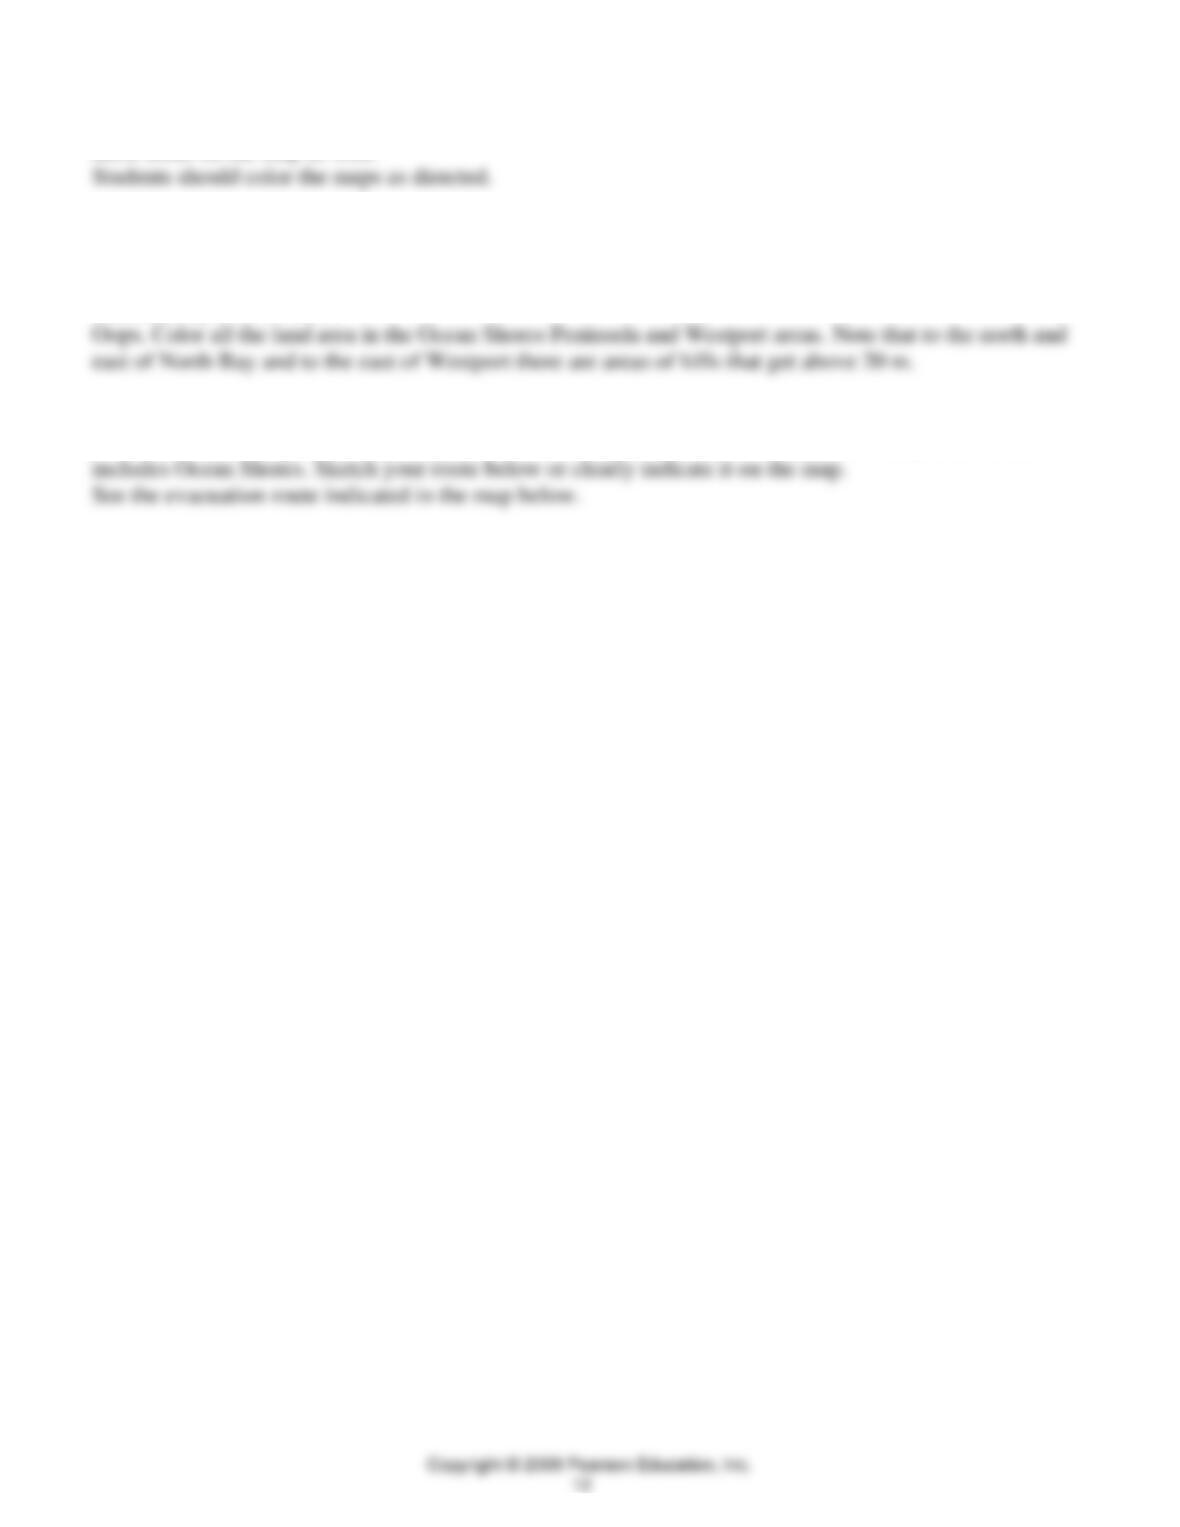
7. How much more land would be impacted by a 20-foot rise in water? Use a different color, and mark
these areas on the map as well.
8. After the Sumatra earthquake, tsunami wave heights reached 30 m (100 feet). Recent studies suggest
that a local magnitude earthquake could generate a 20 m (65 foot) wave height at the Ocean Shores,
Washington, area of the coast. Use a third colored pencil, and indicate on the map areas that would not be
inundated by a 20 m wave.
Escape?
9. Use the 1994 topographic map (Figure 11.11) and suggest a route for escape from the peninsula that
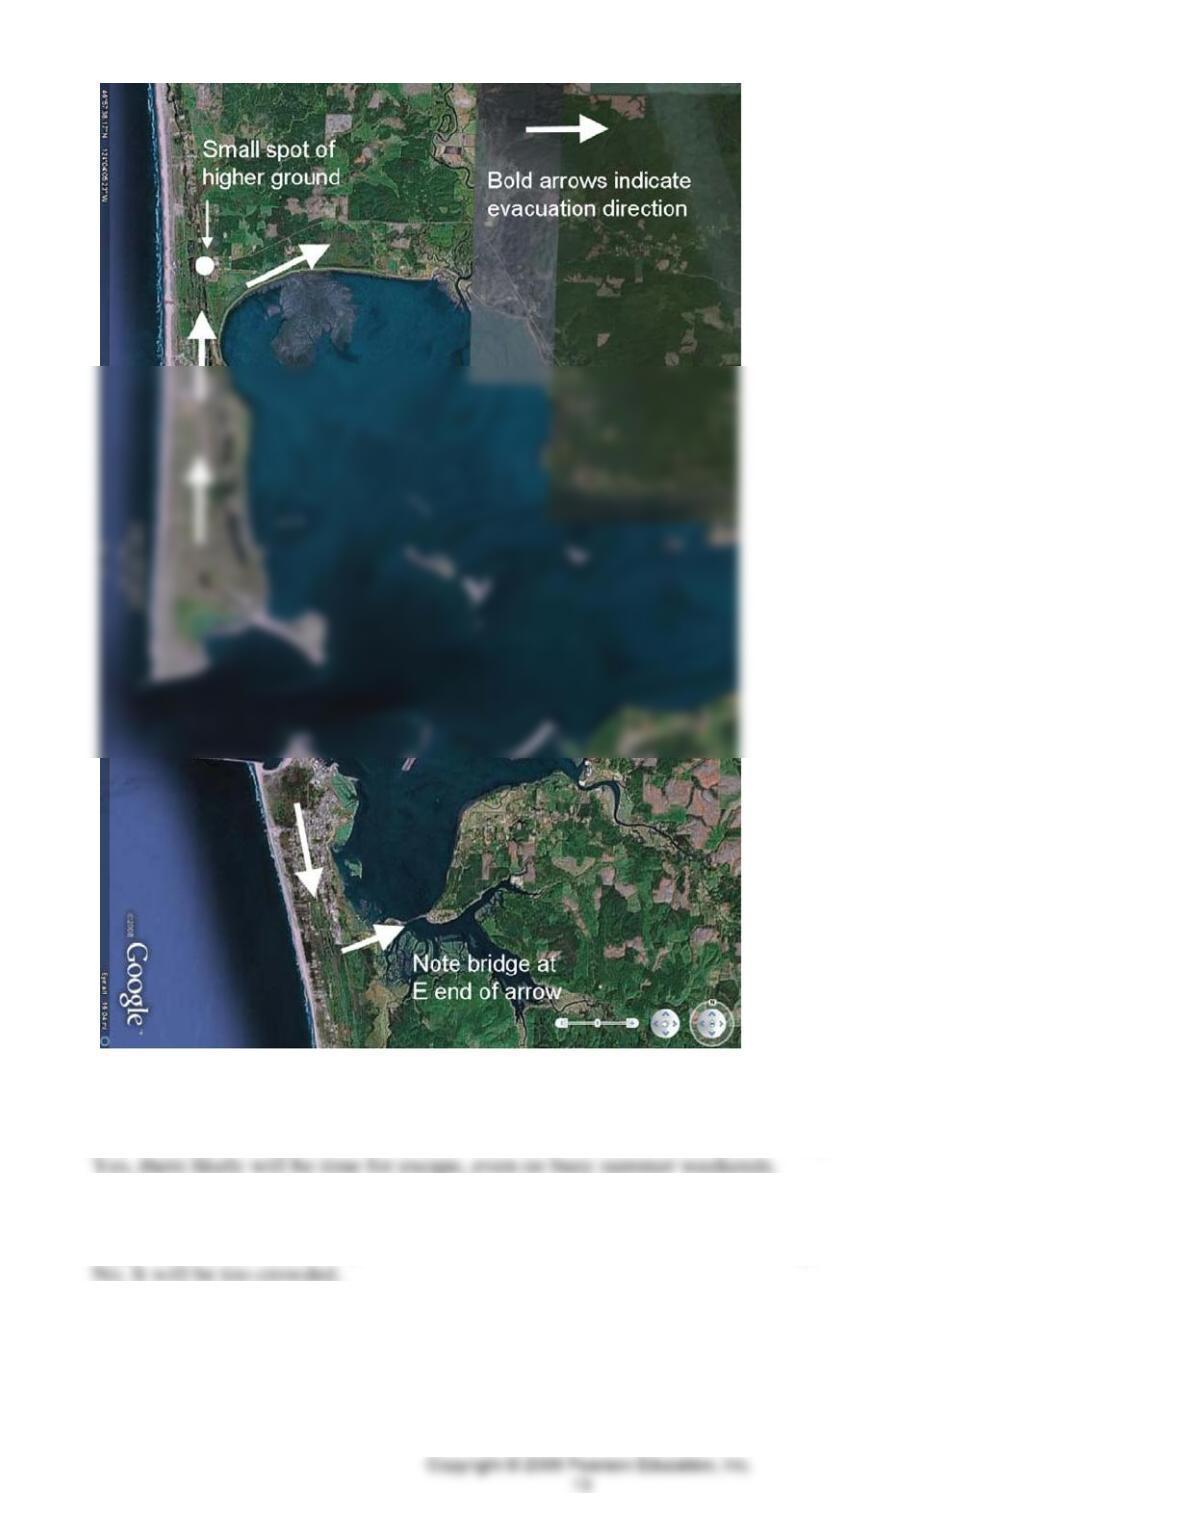
Base image courtesy of and downloaded from Google Earth, April 1, 2009.
10. If a distant earthquake generates the tsunami, there may be several hours before the tsunami hits. Will
your suggested escape route likely work with several hours of advance warning?
11. If a local major earthquake occurs, it may be less than 30 minutes before a tsunami hits. Will your
suggested escape route likely work with less than an hour of advance warning?
12. Given your analyses in Questions 10 and 11 above, are alternative escape routes needed and if so,
what alternatives do you suggest for people living, visiting, or working in the Ocean Shores area?
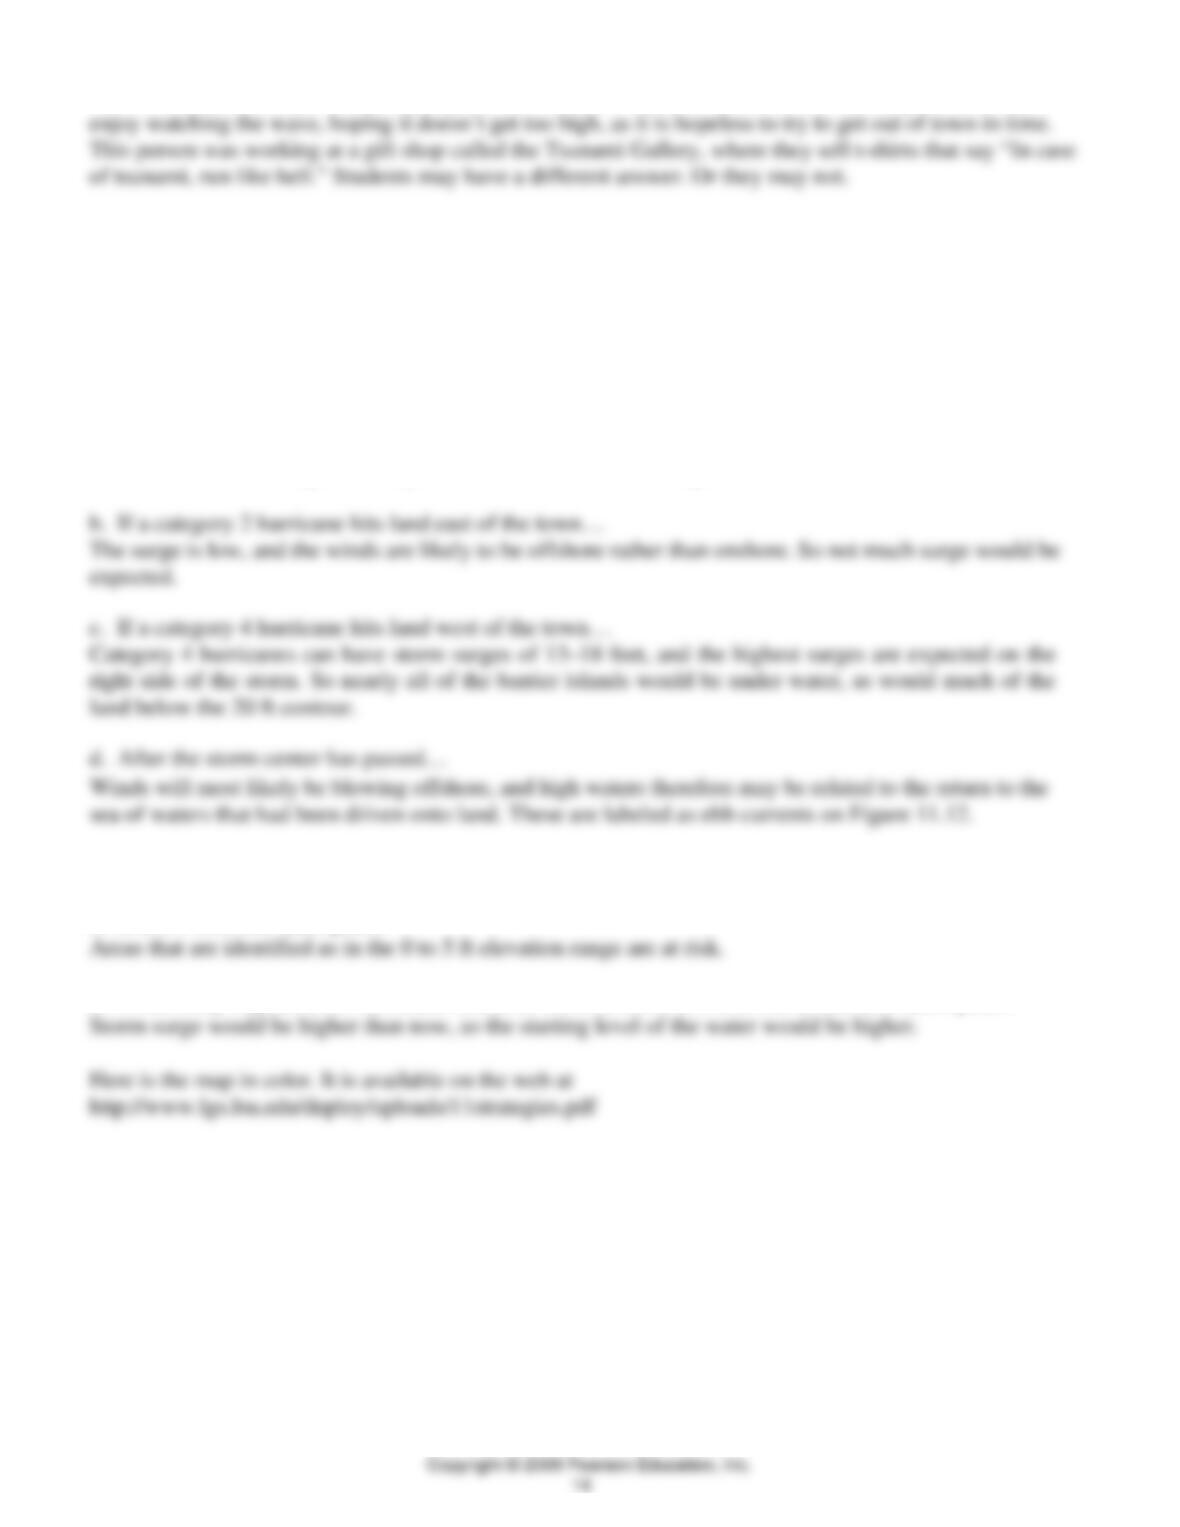
As one local put it, they were going to go to the bar on the top floor of one of the hotels, get a drink and
QUESTIONS 11, PART D
1. Use Figure 11.13 below, and the data shown in Figure 11.12 and Table 11.3, to analyze the likely
impacts of a hurricane on this area.
Note that for the purposes of this lab the photograph has been rotated. Assume that west is on the left side of
the photo, and east is on the right side. The contours are also made for the purpose of this lab only, and may
not reflect the actual topography of the land.
a. While a category 5 hurricane is still offshore…
There will be broad surge, and may not reach their maximum height of more than 18 ft.
2. By 2100, it has been estimated that sea level may rise between 1 and 3 feet.
a. Refer to Figure 11.14 and identify on it additional areas of New Orleans that are likely to be below sea
level if a 3-foot rise takes place.
b. What likely impacts from hurricanes could be more severe if a 3-foot rise in sea level takes place?
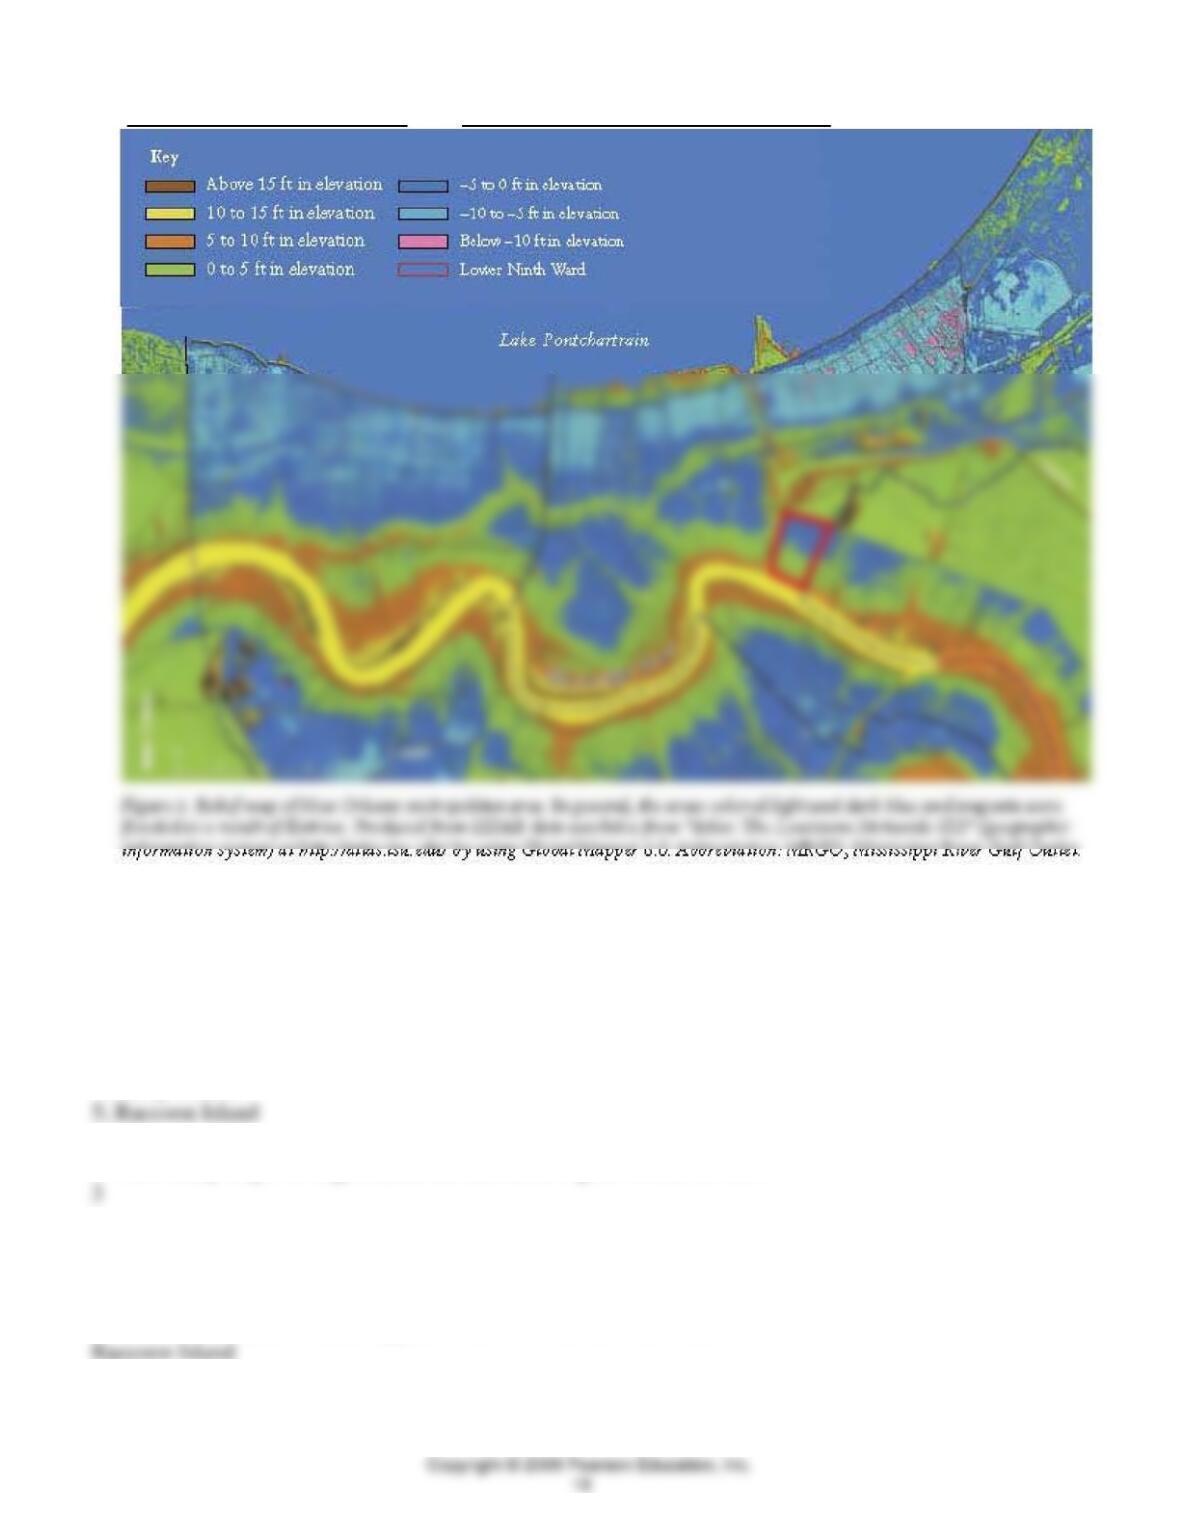
Examine Figure 11.15a, a map showing changes in Isles Dernieres between 1887 and 1996 (and read the
introduction to the barrier islands part of this exercise) to help answer the following. (Note: The Gulf of
Mexico is on the south side of the island.)
3. a. How many named islands are there shown at Isles Derniers in 1996? _____What is the most
westerly island?
b. How many major or large islands are shown on Figure 11.15a in 1887?
c. Was Isles Dernieres at one time a single long island?
Probably, as there are only narrow channels separating the islands in 1887.
4. Which of the named islands appear to have lost the most area since 1887?
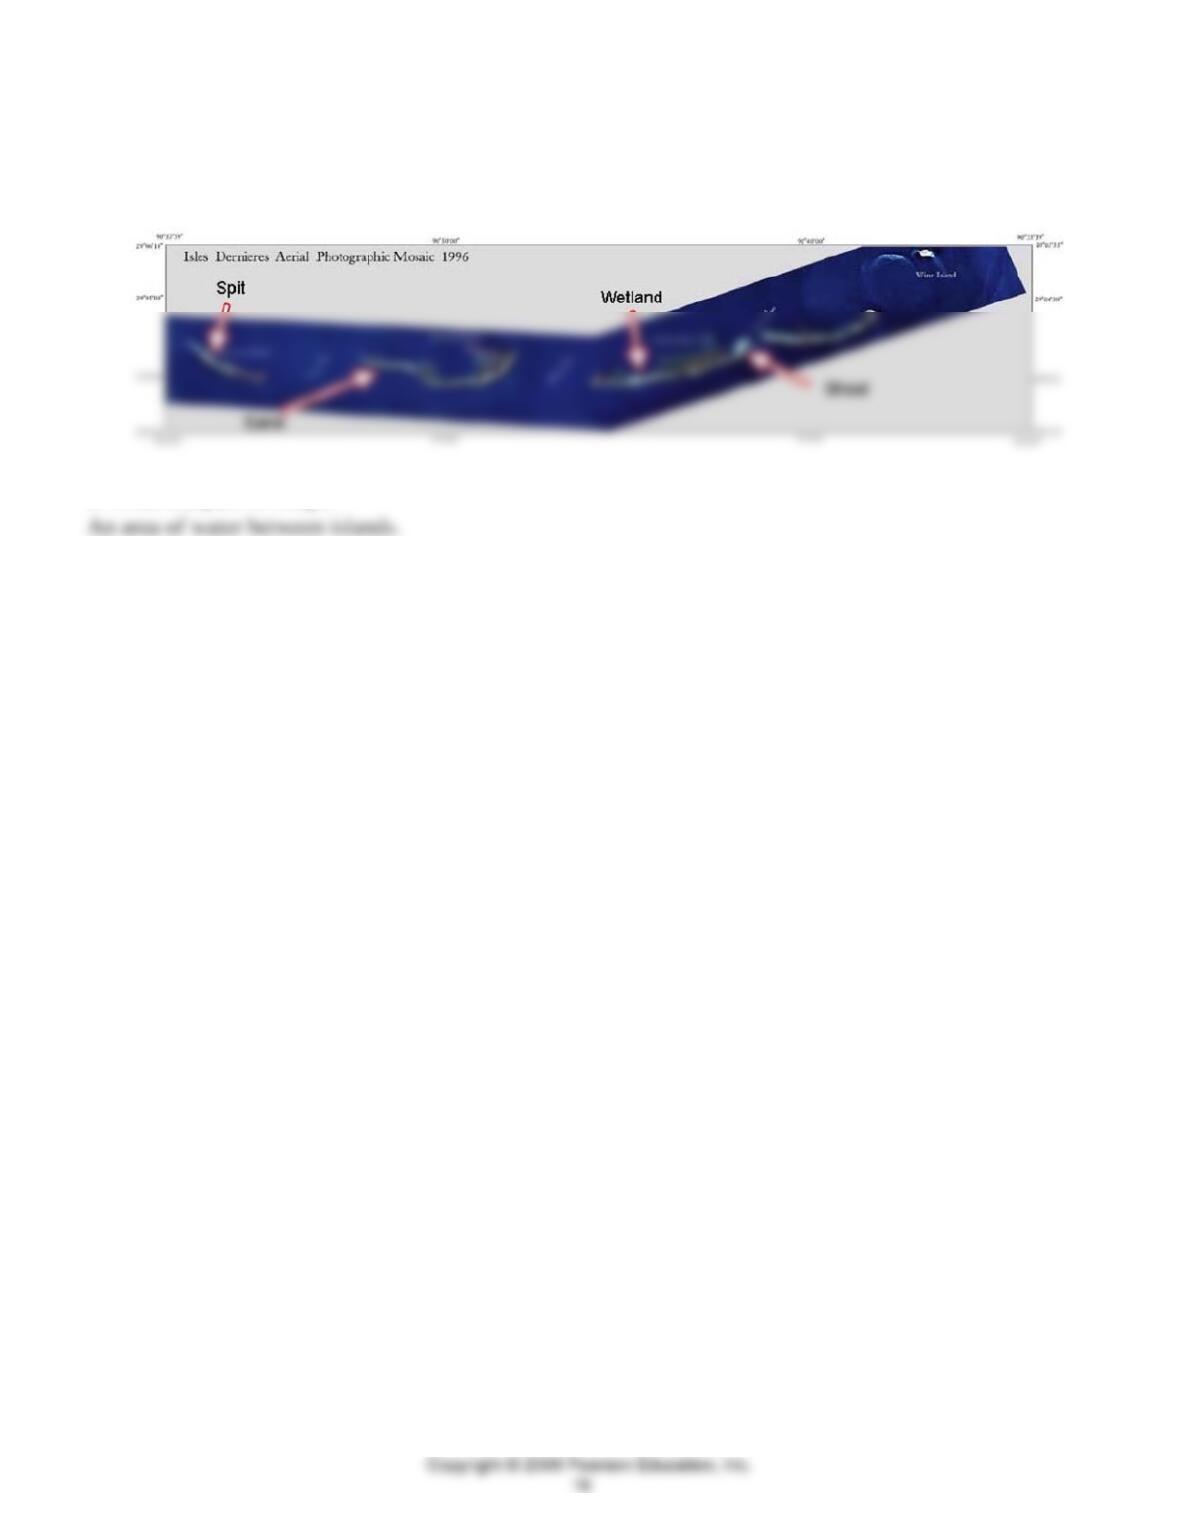
5. a. In Figure 11.15b (aerial photo mosaic, 1996), identify the following by marking them on the figure: a
sand beach, wetland, spit, shoal.
See figure below:
b. What is a pass or coupe?
Figure 11.16 is a compilation of four different editions of the West Derniere, Louisiana, quadrangle,
beginning with one published in 1935. Note the dashed lines in the 1935 quadrangle that could form a set of
equal squares if extended. Each square on the map is numbered and is known as a section. With this set of
numbered sections (squares) we have a very good reference system that we can use to trace the changes in
this barrier island. Also on this map are named bench marks.
For questions 6 though 10, refer to the maps reproduced below. Some printings of the book do not have
clear maps.
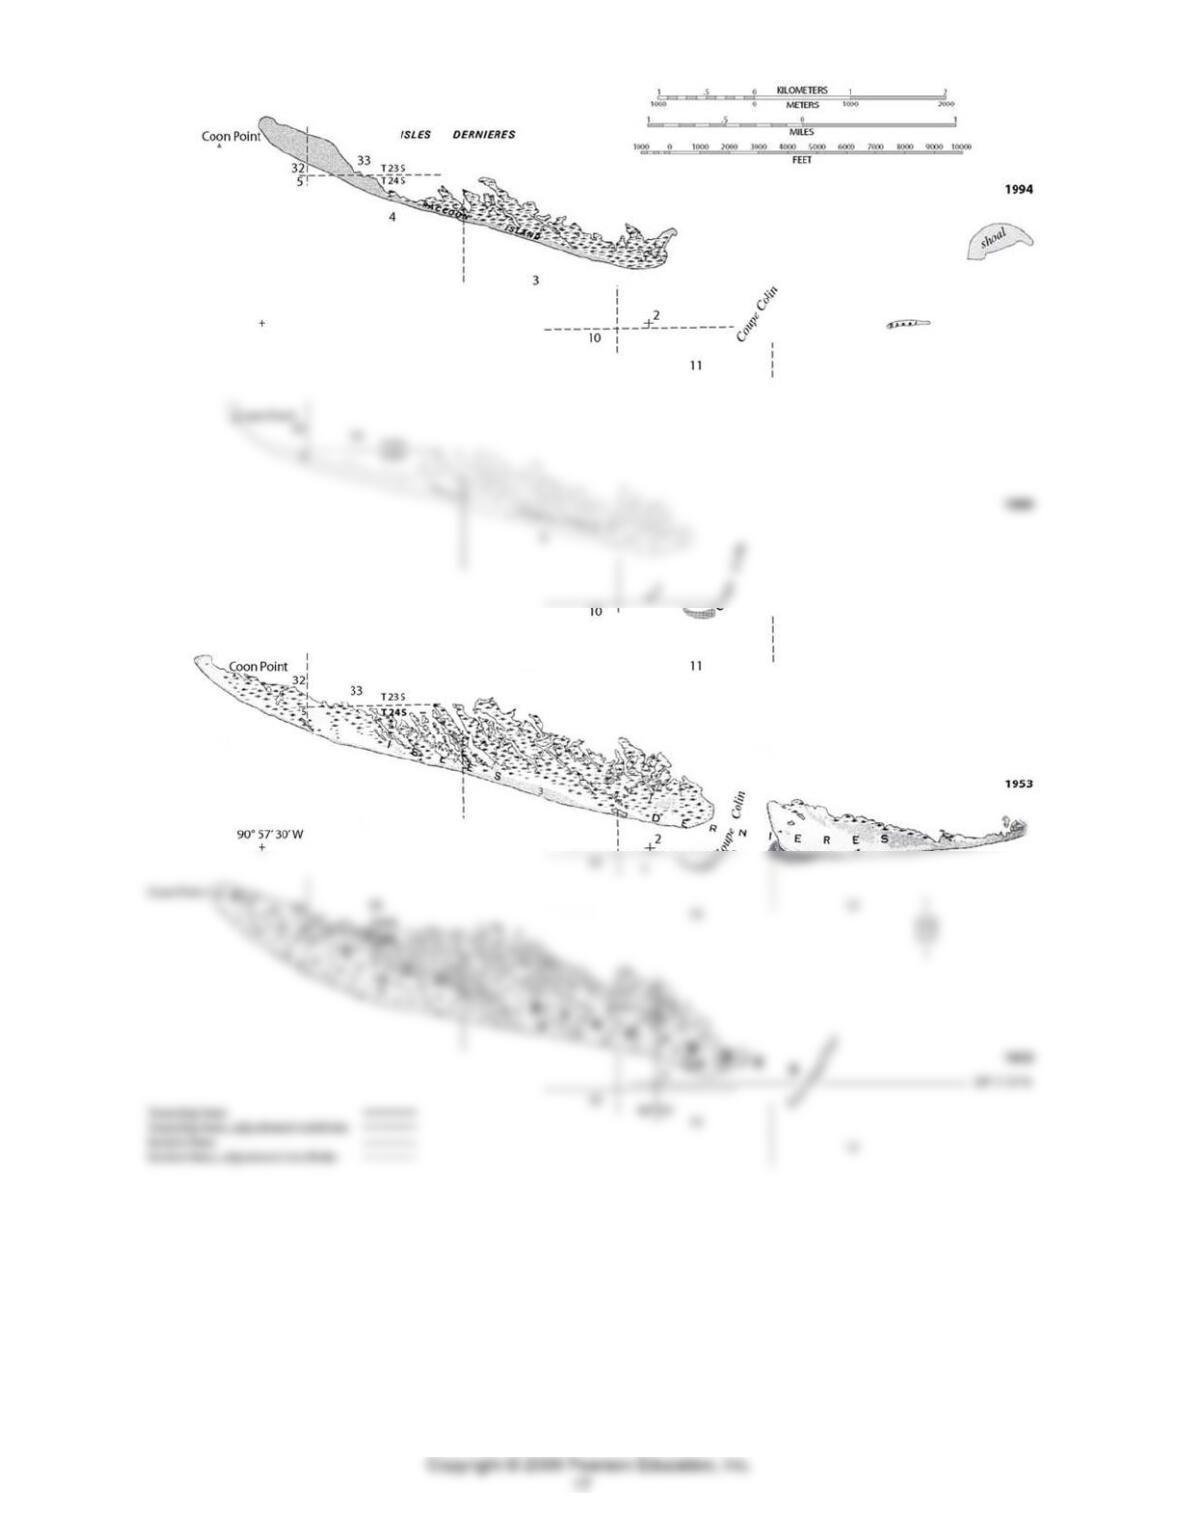
6. a. In the 1935 map (Figure 11.16), what is the section number that contains the word ISLES?
b. What sections contain the word DERNIERES?
c. What is the name of the triangulation point on the west end of the island?
d. What is a section?
e. What is the area of a section? (See the map exercise of this manual.)
f. Write out the abbreviations for T 23 S and R 15 E. (Hint: See the map exercise of this manual.)
7. a. In 1935, what was the maximum length of this island in feet (not including small eastern islands)?
(Use a paper edge to measure the map distance and compare with the map scale.)
18,500 ft.
b. In 1935, what was the maximum width?
c. In 1994, what was the maximum length of this island in feet (not including small eastern islands)?
14,700 ft.
d. In 1994, what was the maximum width?
8. a. Measured along the boundary between Sections 33 and 32, how many feet has the Gulf side of the
island retreated between 1935 and 1994?
Almost 1,800
b. What is the average rate of retreat? (Show your work.)
9. a. What part of the bayside (N side) of the island showed the most change between 1935 and 1994?
(Indicate by Section number and mark on Figure 11. 16.)
Several answers are possible here, depending on student interpretations. Section 3 has seen massive
b. What processes contributed to the change?
10. In the 1994 map, what are the materials shown on the island?
See the map key on the inside of the front cover of the book. Sand and swamp are shown.

11. a. What do you think will eventually happen to the island?
b. Will this have any impact on other areas? Explain your answer.
Yes. Barrier islands help break the force of hurricane-driven waves, so once the islands are eroded, storm