4. From this map, where would you expect most flood and mass-movement damage from the
storm to occur?
5. Refer to discharge hydrographs (Figure 10.10) for selected sites on the Big Thompson River
and the North Fork Big Thompson River. Compare sites 1, 21, and 23. Do you think the flooding
at Estes Park (site 1) was serious? Explain.
Probably not major flooding. Stream discharge at site 1, just downstream from Estes Park, only
6. Do the hydrographs support the precipitation data in indicating the area(s) of greatest runoff
and potential damage? Explain.
7. There are two major rivers in the Big Thompson River system: The Big Thompson (BT) in the
south and the North Fork Big Thompson (NFBT) in the north. The flood peak at site 22, east of
Drake, occurred at the same time as the minor peak at site 21 (2110 MDT) on the NFBT (see
Figure 10.9).
a. How did the flood crest moving down the BT impact the water level on the NFBT at Site 21?
b. Why was there a second (main) peak at Site 21 on the NFBT?
This second peak would have been when the main volume of flood water was moving down the
8. If the main peak at site 21 had occurred 30 to 35 minutes earlier than shown in Figure 10.10,
what impact would this have had on the size of the flood at site 23 at the mouth of Big
Thompson Canyon (Figure 10.9, Inset)?
9. The flood crest reached Site 23 at the mouth of Big Thompson Canyon, 7.7 miles east of Site
22, 30 minutes after the crest at Site 22. What was the average speed of the flood crest in miles
per hour and feet per second? Could you outrun this flood crest?
7.7 miles in 30 minutes = 15.4 miles per hour. This is 22.6 feet per second, or a sub-four minute
10. Refer to Table 10.6
a. At what three sites were the unit discharges or discharge/area ratios of drainage basins the
greatest?
b. How do the locations of these sites compare with the distribution of maximum precipitation
for the storm (see Figure 10.9)?
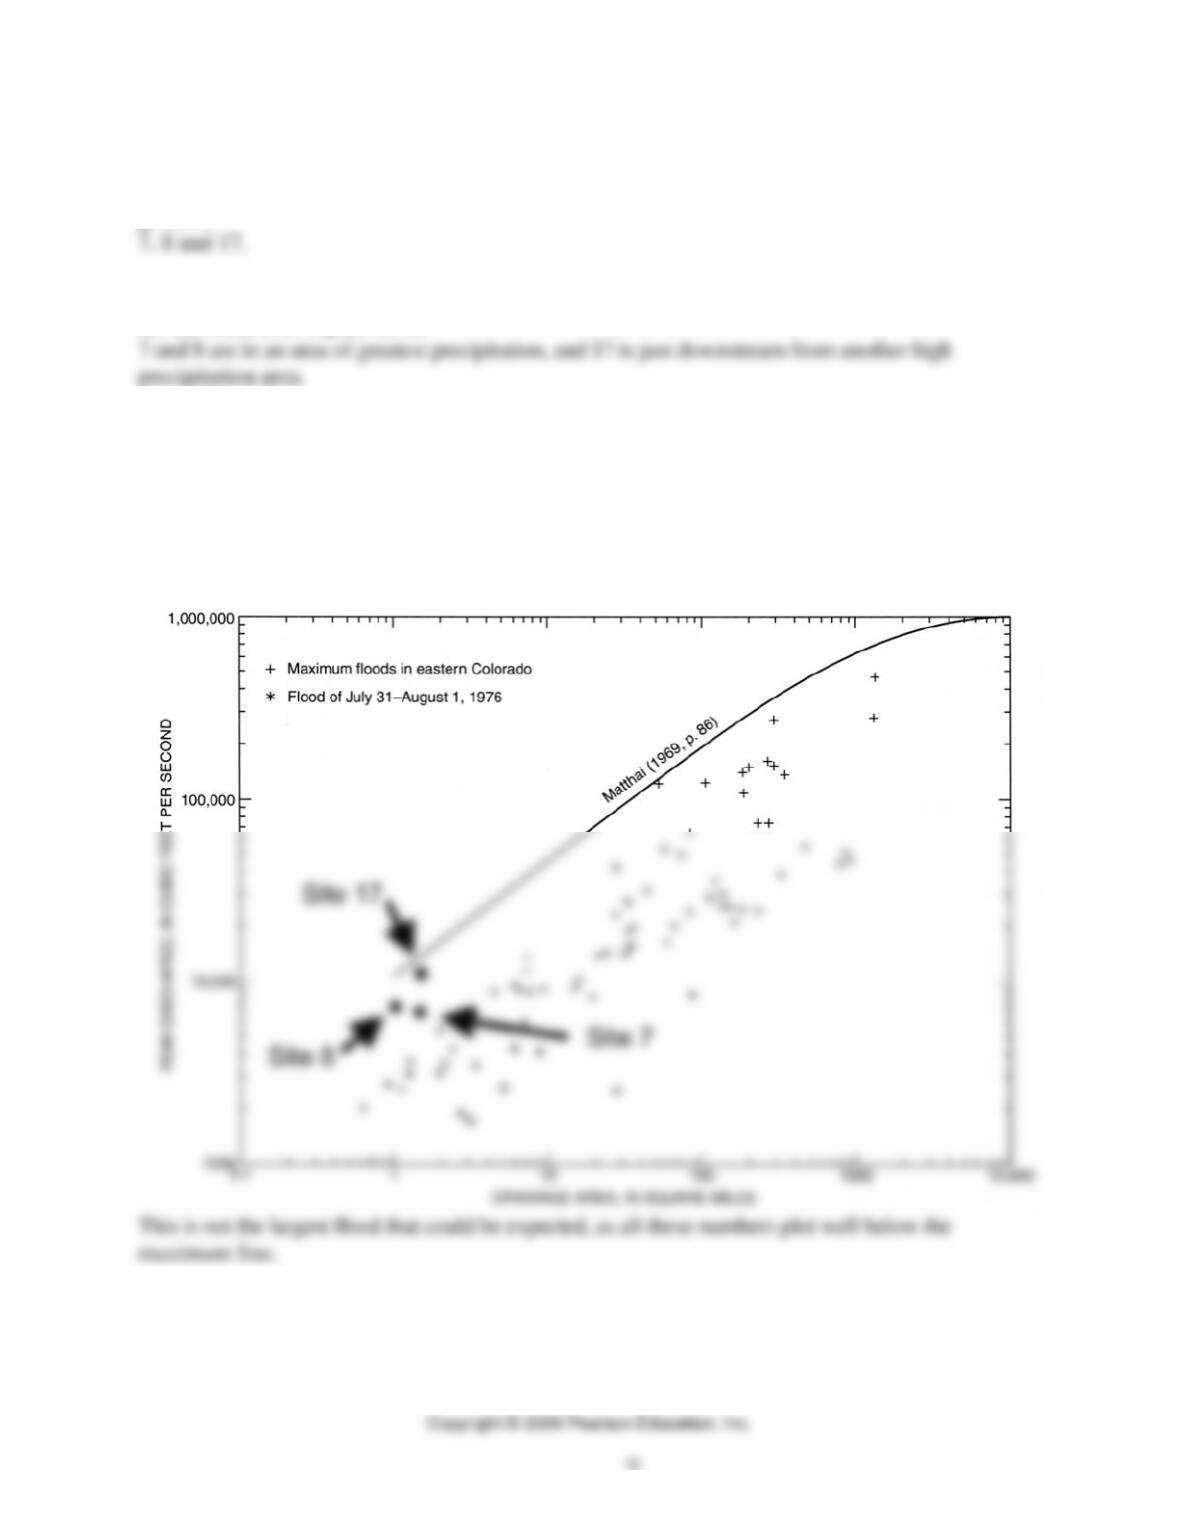
11. Plot the peak discharge and drainage area for each of the stations with the three highest unit
discharges for the 1976 storm on the peak discharge/drainage area diagram for eastern Colorado
(Figure 10.11). Unit discharges provide a measure of the relative size of a flood event in cubic
feet per second per square mile Considering the three data points plotted for the 1976 flood, do
you think that even more outstanding floods will occur on Big Thompson River, or is this the
largest that can be expected? Explain.
See the graph below.
12. Explain why unit discharge for Site 23 (see inset map, Figure 10.9) could not be plotted on
this graph (Figure 10.11; see Table 10.6.)
13. From Table 10.6, which site had the highest average velocity of stream flow?
14. Given that the previous peak discharge at Site 21 was 1290 cfs in the 1965 flood, how many
times larger was the 1976 flood than the earlier flood at this site?
15. The ratio of the peak discharge of the 1976 storm to the discharge for the 100-year flood was
determined for selected stations as follows:
For the drainage basins upstream of Drake, was this flood greater on the Big Thompson River
(BT, Site 12) or on the North Fork Big Thompson River (NFBT, Site 21)?
16. Using the information in Question 15, what is the expected discharge for the 100-year flood?
(Hint: The ratio shown is: discharge for 1976 storm/discharge for 100-year flood.)
17. Study Figure 10.12 showing the Waltonia area before and after the flood. Describe the
changes in buildings, roads, vegetation, and stream bed.
All of the motel has been washed away; the highway and part of the parallel road have been
18. At other sites along the river, significant changes (erosion and deposition) also occurred on
the floodplain and on alluvial and debris fans. Large accumulations of boulders and debris
occurred on some of the fans; other fans underwent erosion. Study Figure 10.13. Would it have
been safer to reside during the 1976 storm on the inside or outside of a meander? Explain.
19. The heaviest precipitation from this flood occurred between 1930 and 2040 hours MDT at
Glen Comfort and 1930 and 2200 hours at Glen Haven. There was little opportunity to warn
anyone. Use this information with the other information in this exercise to prepare two
QUESTIONS (10, PART D)
Refer to Figure 2.10 (colored plate section), Bloomington, Indiana.
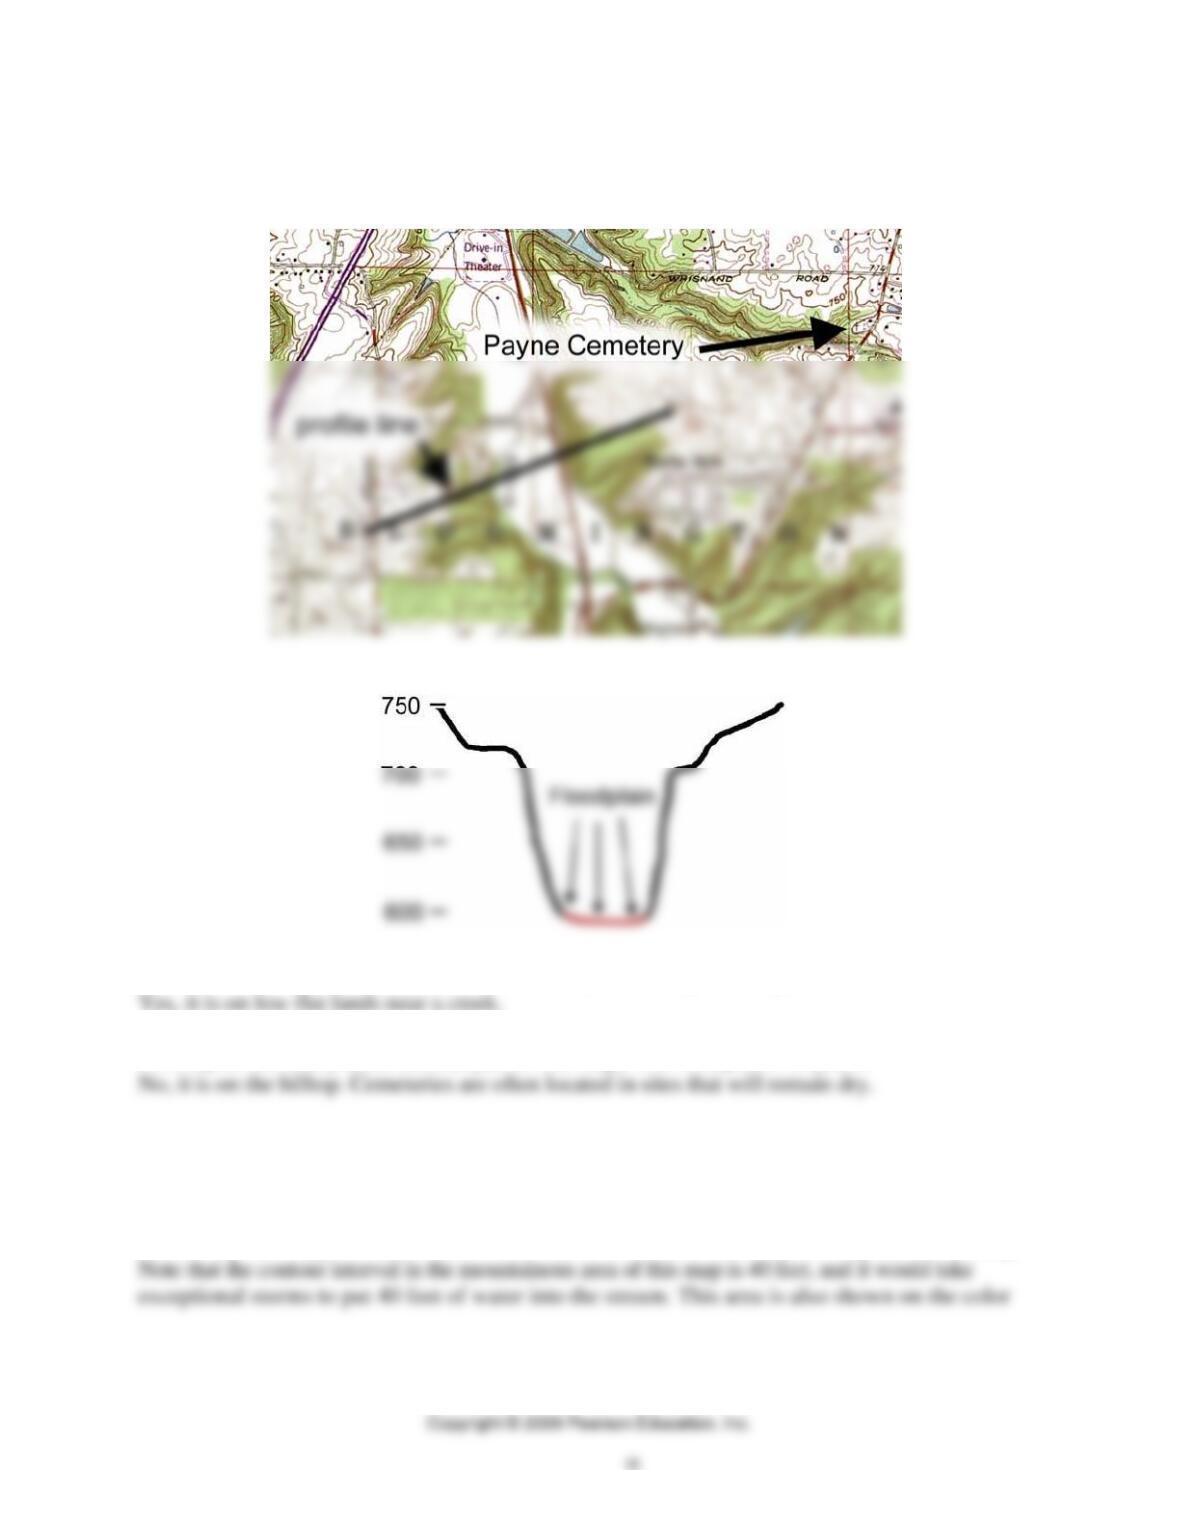
1. Sketch a topographic profile of the valley of Griffy Creek, from the 750’ contour in contact
with the “L” in Bloomington in the west to the zero in the 750’ contour above the “16” in
Section 16 in the East. Mark the floodplain on the profile with a different color.
Here is the location:
And here is the profile:
2. Is the Drive-in Theater (Southwest of the dam) in a floodplain? Explain.
3. Is Payne Cemetery (east-central part of the map) in a floodplain? Explain.
Refer to Figure 6.11 (colored plate section), Draper, Utah.
4. Shade on this map the floodplain of Little Cottonwood Creek in the area of Glacio Park, near
the eastern edge of the map.
The floodplain is approximated by the area next to the stream that is shown in green on the map.
5. Do you think the floodplain west of Beaver Ponds Springs is broad or narrow? What evidence
do you use to support your answer?
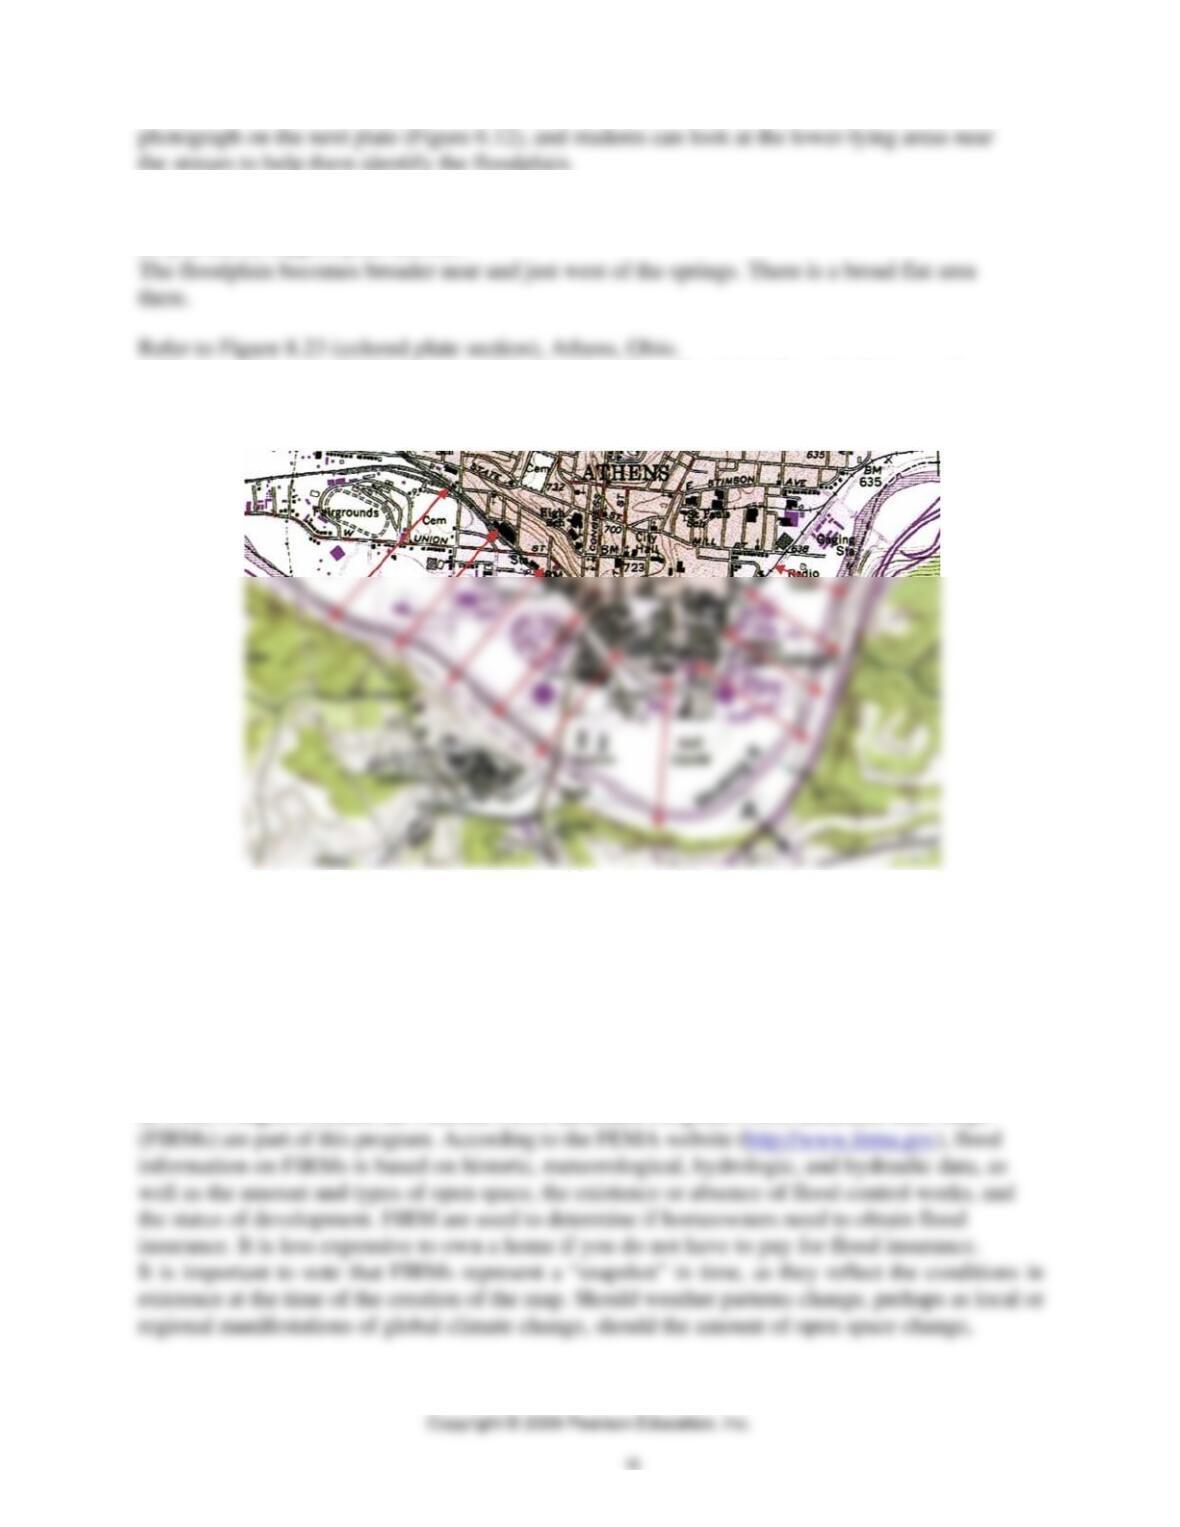
6. Shade on this map (1995), the area of the Hocking River floodplain from the Fairgrounds to
the Radio Tower.
The areas indicated by the red arrows are the approximate areas that should be shaded.
7. Are any buildings located on the floodplain? Identify three of the major ones.
Yes, many buildings at Ohio University are there. There is also a hospital.
8. What has happened to the course of the river through time in the area south of the sewage
disposal facility?
It has been channelized and straightened.
Flood Insurance Rate Maps
In 1968, Congress created the National Flood Insurance Program. Flood Insurance Rate Maps
Washington, DC
Figure 10.15 is a FIRM map of part of Washington, DC. The left side of the map is the Potomac
River. Rock Creek flows into the Potomac from the east. The circular “Zone C” on the east side
of the river is centered on the Lincoln Memorial.
9. Let’s first look at the background (nonflood) information on the map. What types of
background data are shown on the map?
10. What types of background data are missing from the map that would be helpful in identifying
flood hazards?
11. What hazard zones are identified on the map? How often are floods expected in zone A? In
zone B?
12. Are areas in zone C are completely free from flood hazards?
13. Are all the hazard zones on the map the result of natural processes? Look carefully and
explain.
14. Although the data that comprise flood hazard depictions on this map were collected in 1974
and revised in 1975, what year was this map published? What changes might have taken place in
this area between the time the data were collected and the map was published?
The map was published in 1985. There undoubtedly was development during this time that could

15. What year is it now? What additional changes do you think might have taken place in the
drainage basin of the Potomac River? What will be the likely impact of these changes on flood
hazards that have been mapped?
There may have been more development, which could increase the flood hazards. There
19
U.S. GEOLOGI CAL
SURVEY Fact Sheet 229–
96
The “ 1 OO– Year Flood“
by Karen Dinicola
Flood desig n a t ion s ar e base d on st at ist ica l aver a ges, not on t h e num ber of ye ar s
be t w e e n big floods.
The est im at es are only as good as t he available dat a. Flood designations are
updated as more data are collected or when the conditions change in a river
basin.
Big Floods Could Ha ppe n Aga in in W ashingt on D u r ing An y Year
Rivers across t he Nat ion seem t o be rising t o record flood levels alm ost
W h y D on ‘t Th ese Floods H appen Eve r y 1 0 0 Yea r s?
The term “100– year flood“ is m isleading because it leads people to believe that
How Ar e Floods D e signat e d?
Scient ists collect dat a and study past floods t o get a m inim um of 10 years of
20
Ma ny Flood Designat ions W ill Change Ov e r Tim e
The USGS Colle cts Esse nt ia l D at a For Unde rst a n din g Floods
Scient ists at t he USGS m easure st ream flow in rivers across t he Stat e during
every m aj or flood. Aft er flood wat ers recede, the USGS m ay be funded to
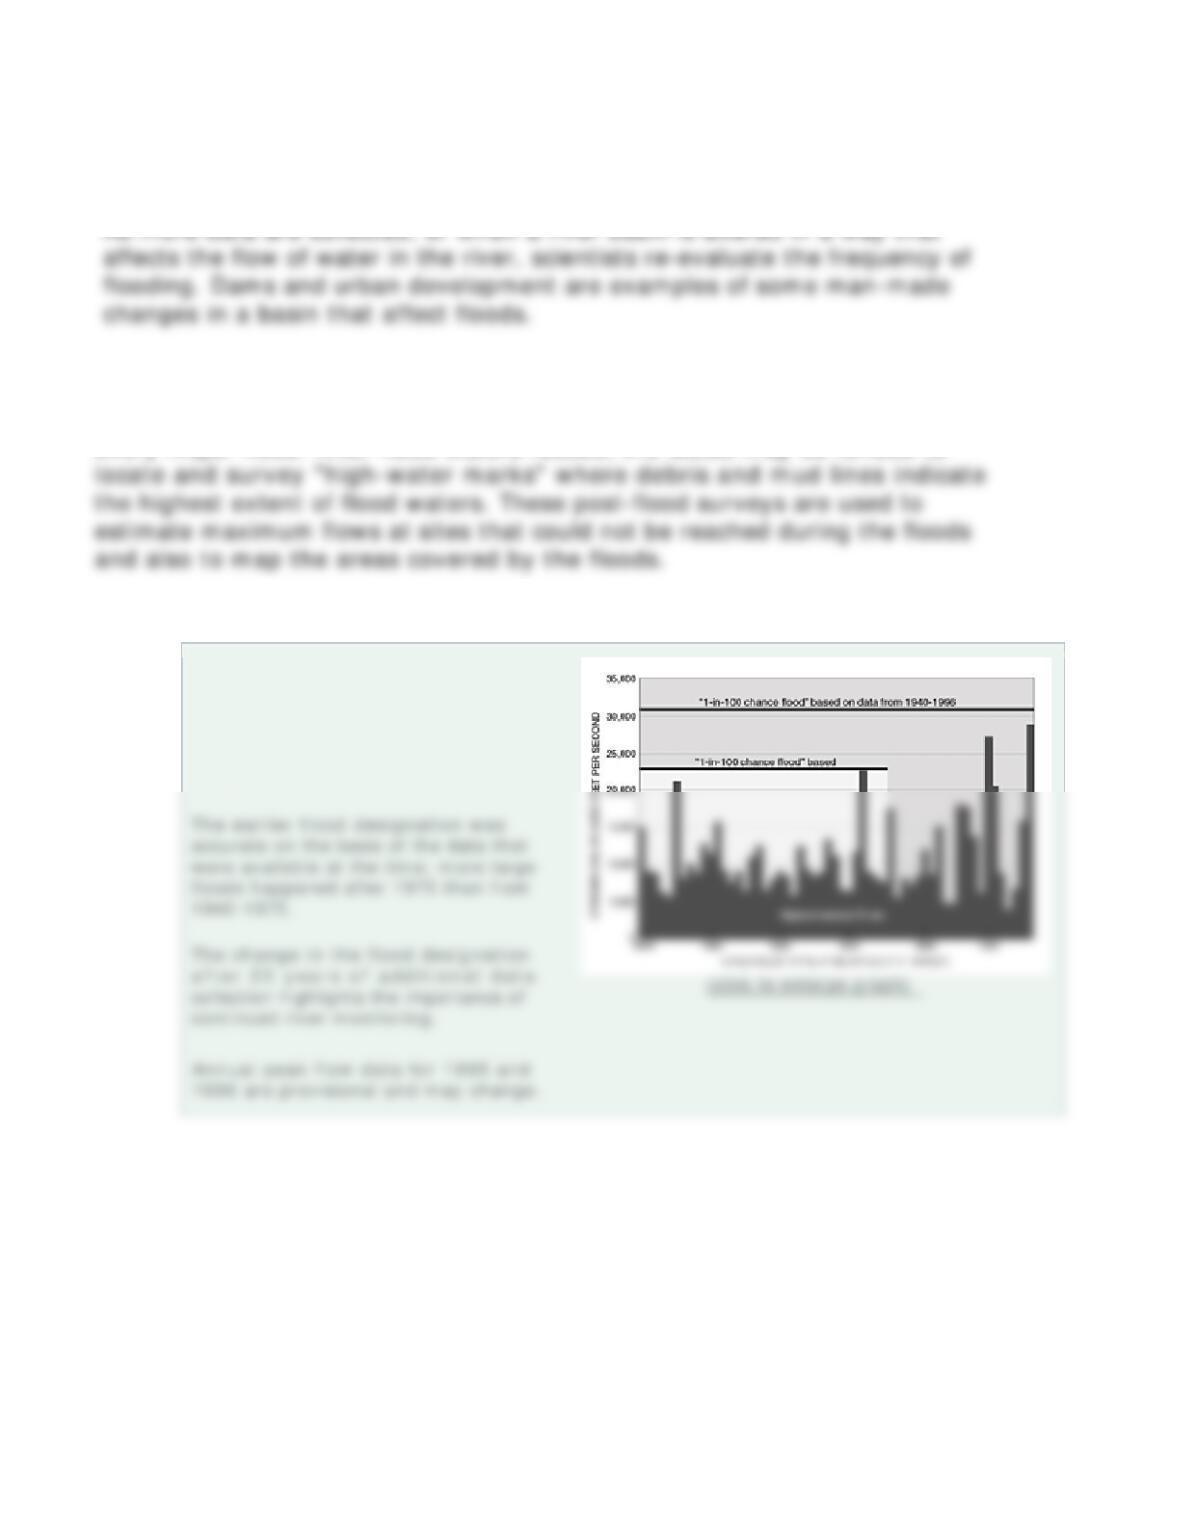
St ream flow dat a t hat have been
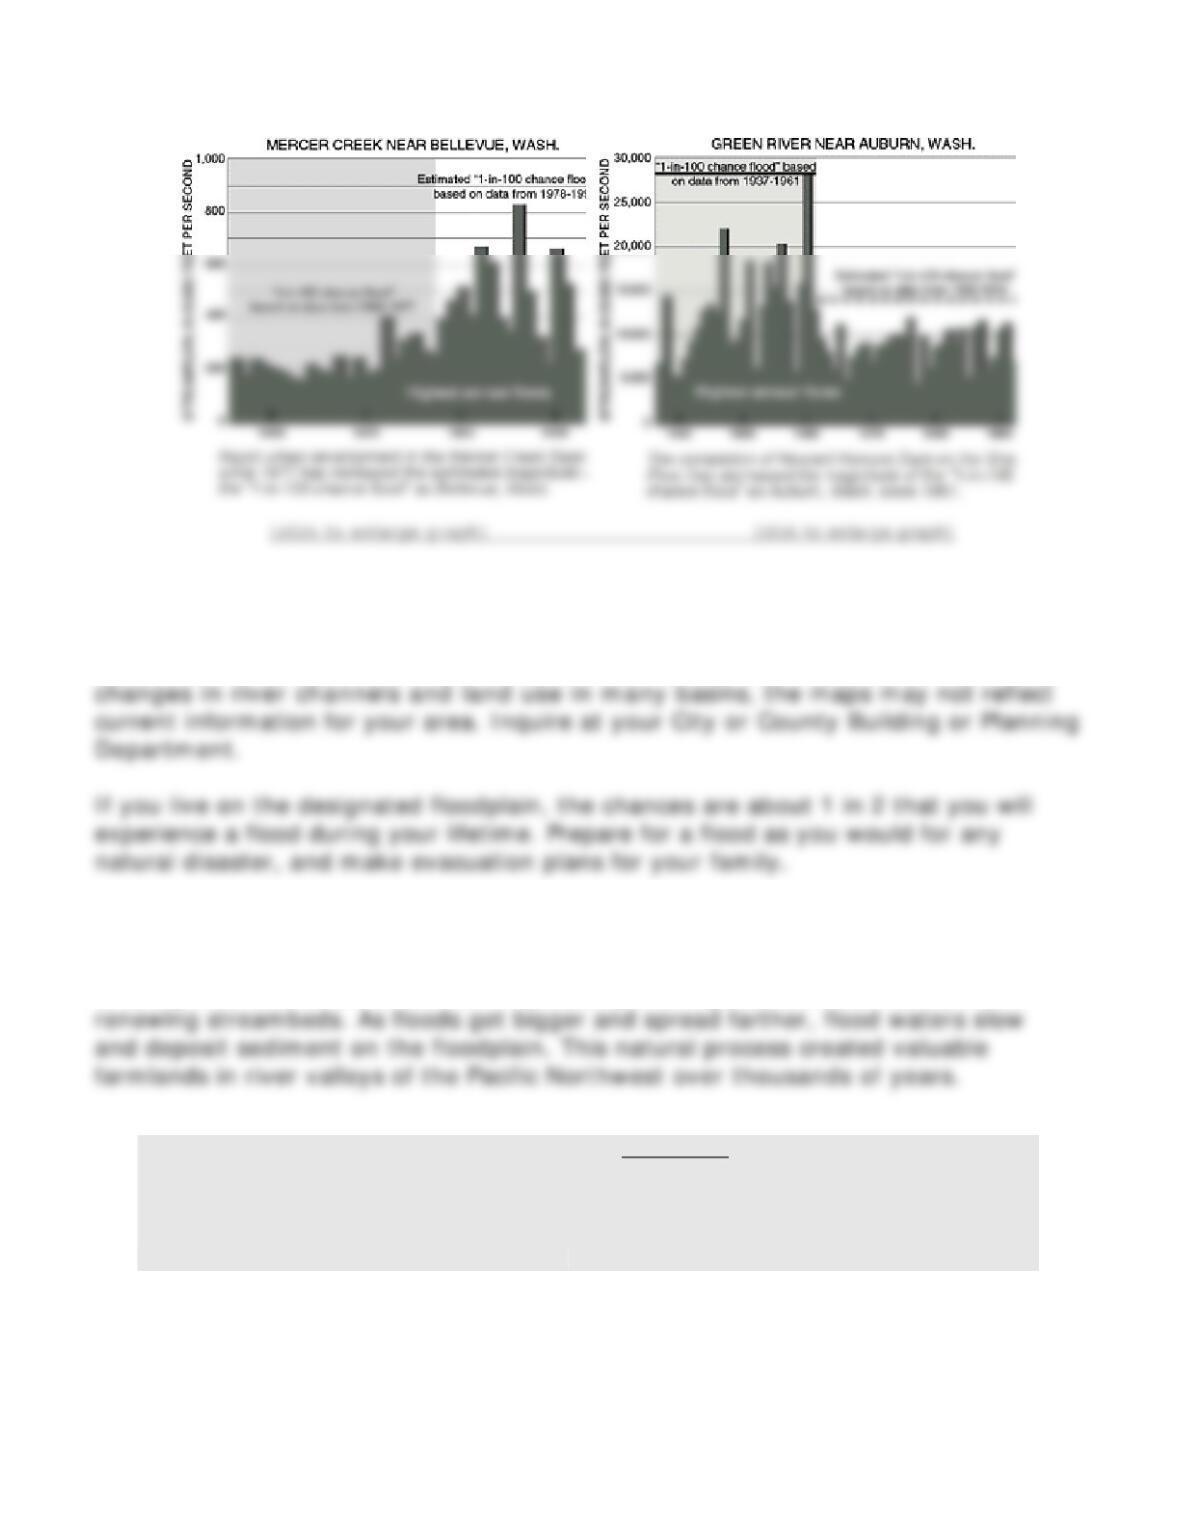
collect ed since 1975 on the Chehalis
River near Dot y indicat e t hat t he
estim at ed st ream flow of “1– in– 100
chance flood“ is higher than it was 20
years ago.
21
Do You Live On The Floodpla in?
The areas affect ed by past floods have been m apped by t he Federal Em ergency
Managem ent Agency and m any other governm ent agencies. Because of cont inuing
Floods W ill Cont inue To H a ppen
Although we can lessen effects of som e floods, t hey are part of t he natural cycle
of every river and benefit instream habit ats by m oving m at erial downstream and
Glossa ry of Flood Ter m s
A flood is any relatively high st ream flow
that overt ops t he nat ural or artificial banks
of a river.
The floodplain is t he relatively flat lowland
that border s a river, usually dry but subj ect
to flooding. Floodplain soils act ually are
form er flood deposits.
The aver age num ber of years bet ween floods

22
Disch arge is another t erm for stream flow; it is the m easured volum e of water that m oves
past a point in the river in a given amount of t im e. Discharge is usually expressed in cubic
feet per second.
For m ore infor m at ion, cont a ct :
The U.S. Geological Survey has served t he public and Federal, Stat e,
and local governm ent s since 1879 by collecting, analyzing, and
pu b lish ing detailed inform at ion about t he Nat ion‘s m ineral, land, and
water resources. The USGS has been st udying t he wat er resources of