QUESTIONS 9, PART A
Refer to Table 9.1 to answer questions 1–5.
1. The most common types of deposits involved in ground water-induced subsidence are:
2. Would you expect these deposits to be consolidated (cemented and compacted to solid rock) or
unconsolidated? Explain.
3. The geologic ages of these deposits are:
Late Cenozoic
4. What is the maximum depth of deposits that have been compacted?
6. The sediments in major areas of subsidence consist of interbedded clayey silt and sand and gravel. Place
the following characteristics under the appropriate column above: aquifer, low compressibility, low
permeability, high permeability, confining bed, fine-grained texture, coarse-grained texture, and high
compressibility.
7. Subsidence induced by groundwater withdrawal generally occurs in areas characterized by confined
aquifer systems. What is a confined aquifer?
8. Confining beds consisting of clayey silt respond differently than sand and gravel. They may contain a
great deal of water (have high porosity), but it is not readily transmitted. Such rocks are said to have a low
9. When the water pressure in the aquifer decreases, the water in the confining beds may move
slowly/rapidly (circle one) into the aquifer. The result is a ________________ in thickness of the
confining bed and possibly_____________________ of the land surface (see Figure 9.1).
QUESTIONS 9, PART B
Refer to Figures 9.2 and 9.3, showing land subsidence for two different periods, in answering the
following questions.
Clayey Silt Sand and Gravel
1. According to Figure 9.2, what locations showed maximum subsidence in the Santa Clara Valley from
1934 to 1960?
2. a. What was the total subsidence from 1934 to 1960 in these areas?
3. What geologic material is largely responsible for the subsidence?
4. Would subsidence be more noticeable at Alviso (on the Bay) or at Mountain View?
Alviso, since sea level is rising while the land is sinking, there would be noticeable flooding. Indeed, by
Well data, as per Figure 9.4 and 9.5 in lab manual. (The graph above is not from the same well as shown in
Figure 9.4 of the lab manual.)
5. What types of damage and geomorphic changes would indicate subsidence?
Low-lying coastal areas could be flooded at times of high tide and during storms. Gradients of streams
6. Would you expect any subsidence in the areas marked with diagonal lines? _________Explain.
7. Figure 9.3 shows the total subsidence for the central part of the valley from 1934 to 1967. What was the
annual rate of subsidence for the area around the highway junction (Bayshore Highway and #9) north of
Sunnyvale and east of Mountain View from 1960 to 1967? (First refer to Figure 9.2.)
Students should first sketch in subsidence data along the Bayshore highway on Figure 9.3 from locations
8. Where had the maximum subsidence occurred by 1967?
9. What was the increase in subsidence between 1960 and 1967 on the Bayshore Highway south of
Agnew?
Damage to well casings in the valley due to subsidence has amounted to over $4 million. Even greater
damage occurred in the northern part of the valley because more than 17 square miles sank to below highest
tide and protective works had to be installed. The fluctuations in water level in an 840-foot deep well in San
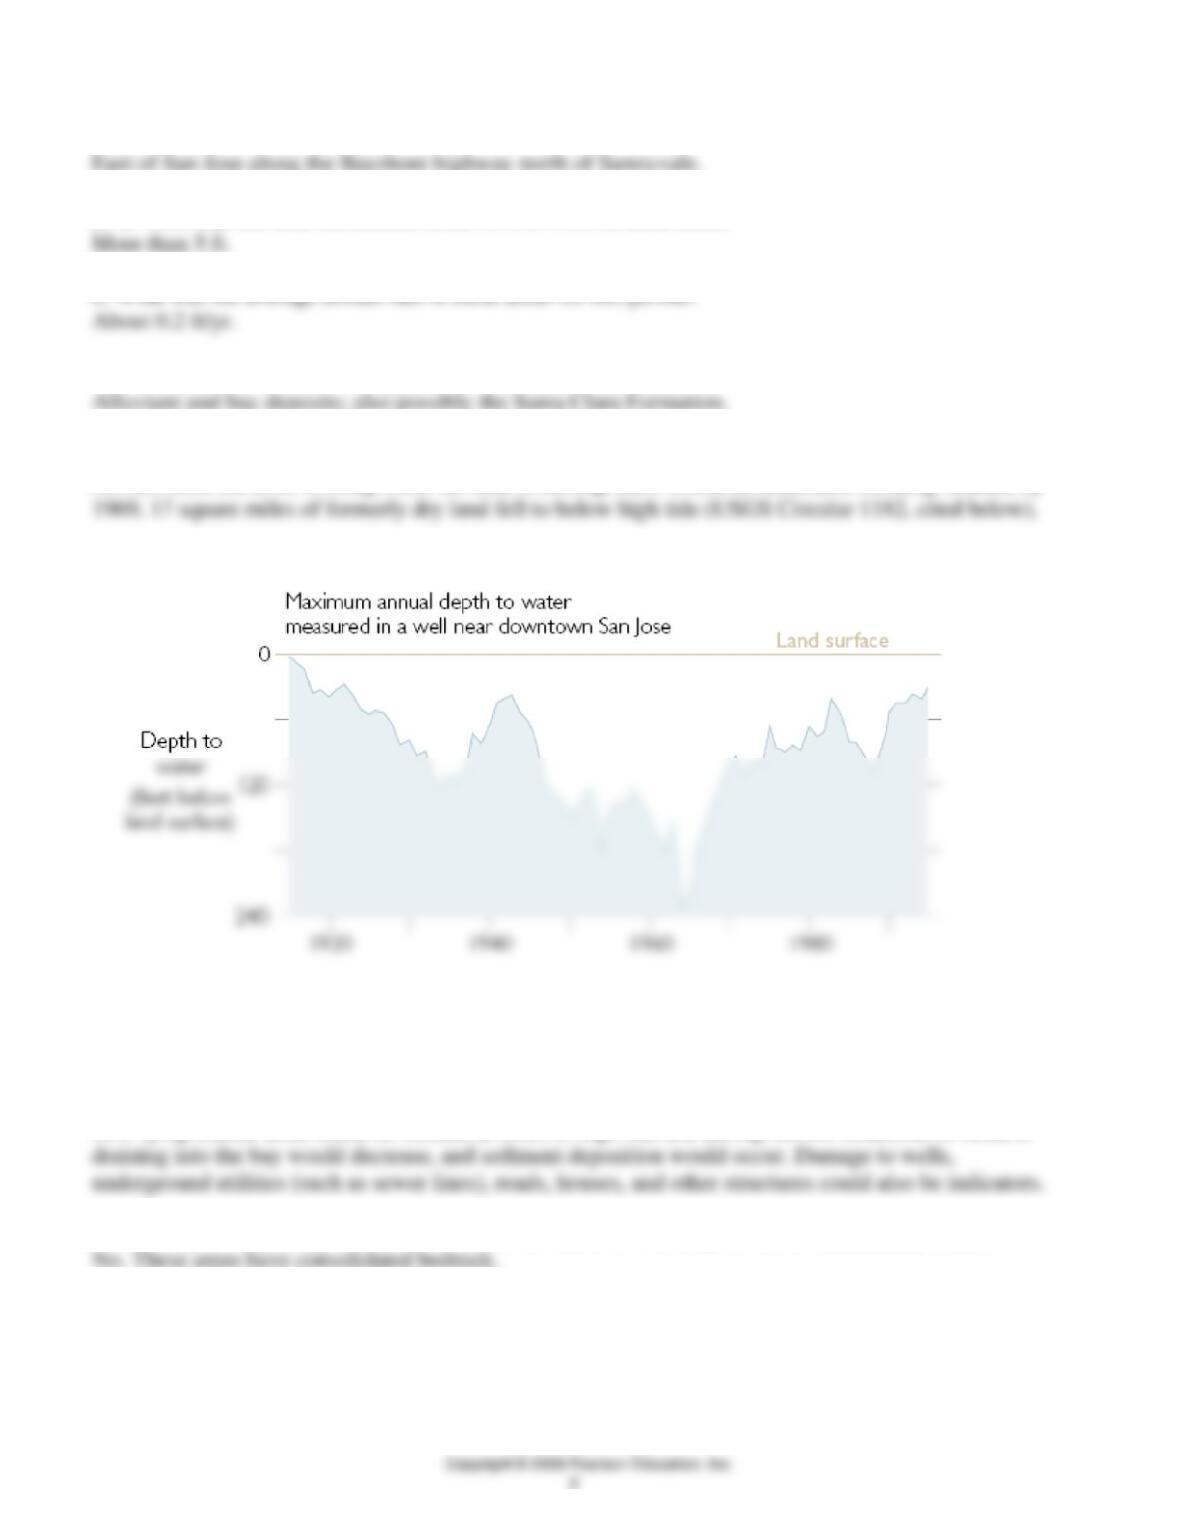
Jose are shown in the hydrograph in Figure 9.4. This record shows the changes between 1915 and 1967.
10. What was the water level in the well in 1915? _________ In 1967?___________
11. During what period would this artesian well have been a flowing well?
1915 and 1916
12. a. How many highs and lows occur in the water level in any 5-year period? (Figure 9.4)
5 highs and 5 lows
b. What is the cause of these minor fluctuations?
13. What may have caused the upward trend in the water-pressure surface between 1938 and 1944? Probably
a series of years (1934–1942) with increasing precipitation (Figure 9.5) that resulted in natural recharge and
decreased dependence on groundwater for use for agricultural purposes. Conservation and reservoir
14. Using the data in Table 9.2, plot on Figure 9.4 (where possible) the decline of the land surface at a
nearby bench mark (P7) in San Jose. Use the scale on the right side of Figure 9.4. Connect each point with a
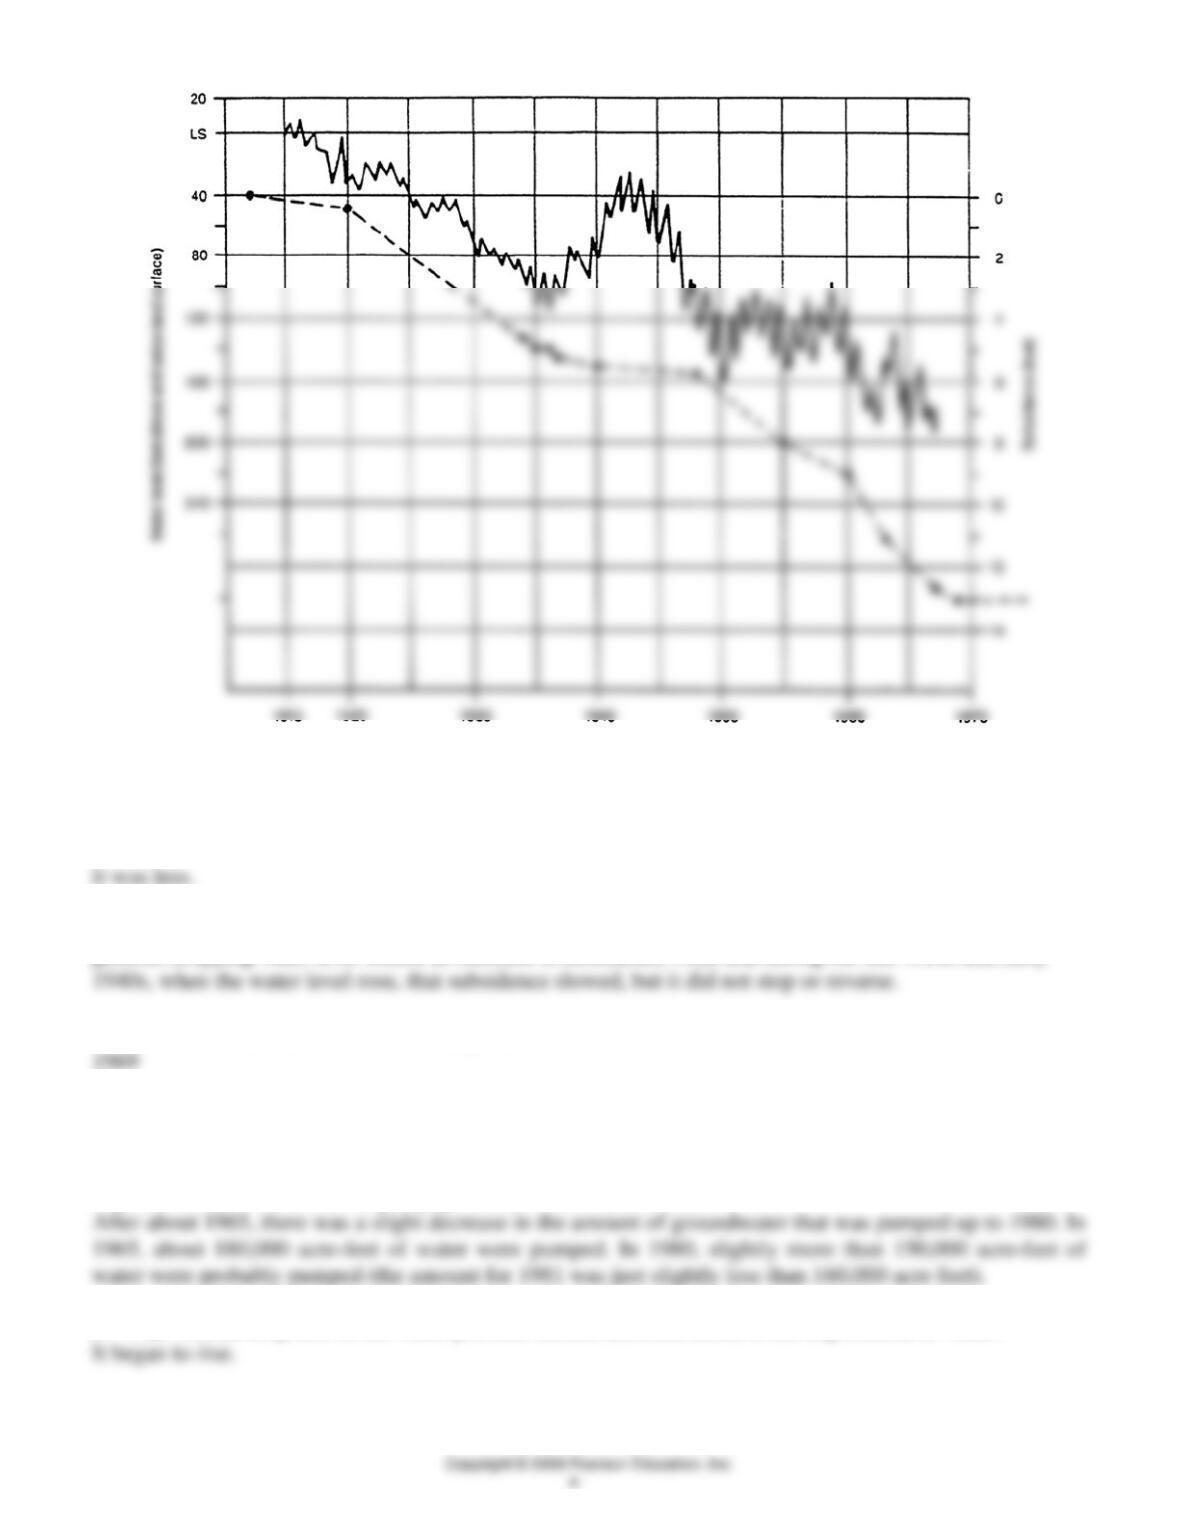
Figure 9.4, change of water level in San Jose; dashed line is subsidence.
15. In Figure 9.4 the slope of a straight line joining the subsidence in 1912 and that in 1967 would give
the average rate of subsidence for this period. In general, how did the rate of subsidence occurring
between 1935 and 1948 differ from earlier rates?
16. How is the trend of the water-pressure surface related to the change in subsidence rate? In
general, dropping water level means an increase in subsidence. Note that during the late 1930s and early
17. When did subsidence cease according to data in Table 9.2?
18. In 1965 importation of water to the valley began. Some imported water was used to recharge the
groundwater through stream channels. According to data in Figure 9.5:
a. What was the response in groundwater pumpage to the increased importation of water? When did this
response occur? What was the pumpage rate in 1965 and in 1980?
b. What was the response of the water-pressure surface (artesian head) to the importation of water?
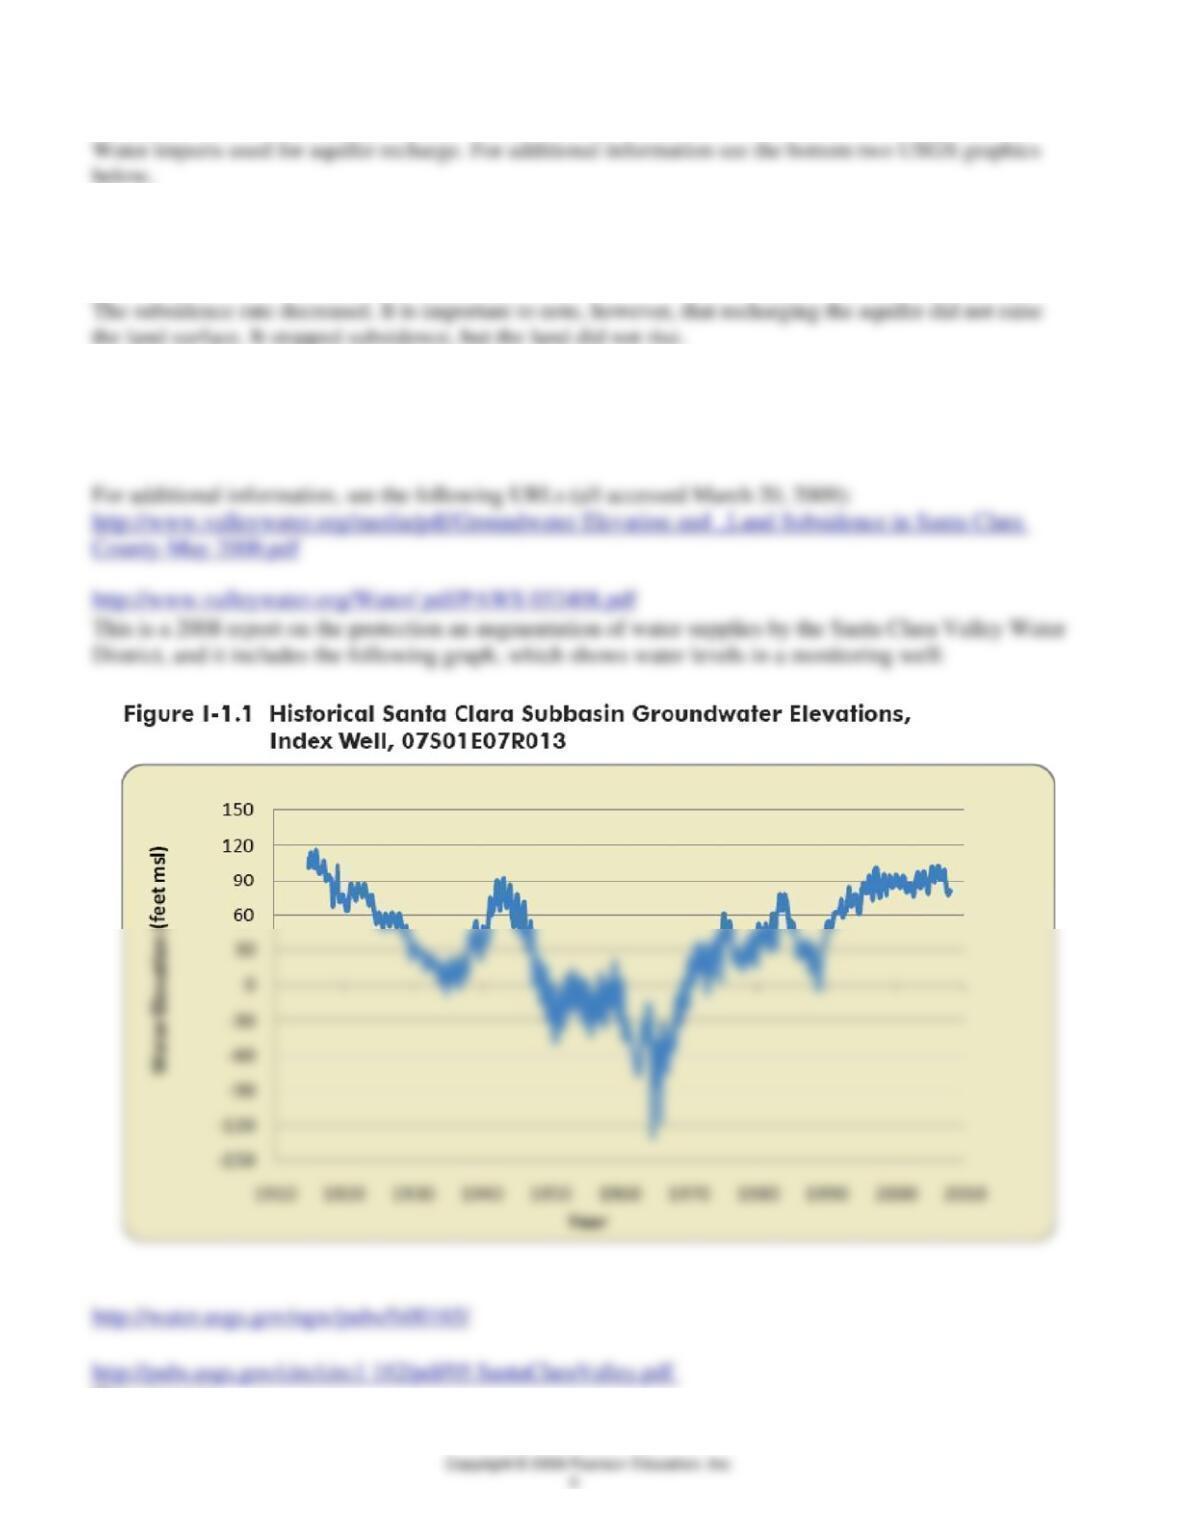
c. Did decreased pumpage, increased precipitation, or water imports have the greatest role in causing the
water pressure surface (artesian head) to rise from the levels of the mid-1960s?
19. Between 1970 and 1980 the depth to water below land surface had risen to an average of 90 feet;
between 1990 and 1995, the depth to water had risen to an average of 45 feet. What happened to the
subsidence rate as a result of the change in the water-pressure surface?
20. Would subsidence resume if imports of water were reduced and pumping of groundwater was
increased?
Yes, until the point that the confining layers are completely compacted.
This report is:
Ingebritsen, S. E., and Jones, D. R., 1999, Santa Clara Valley, California – A case of
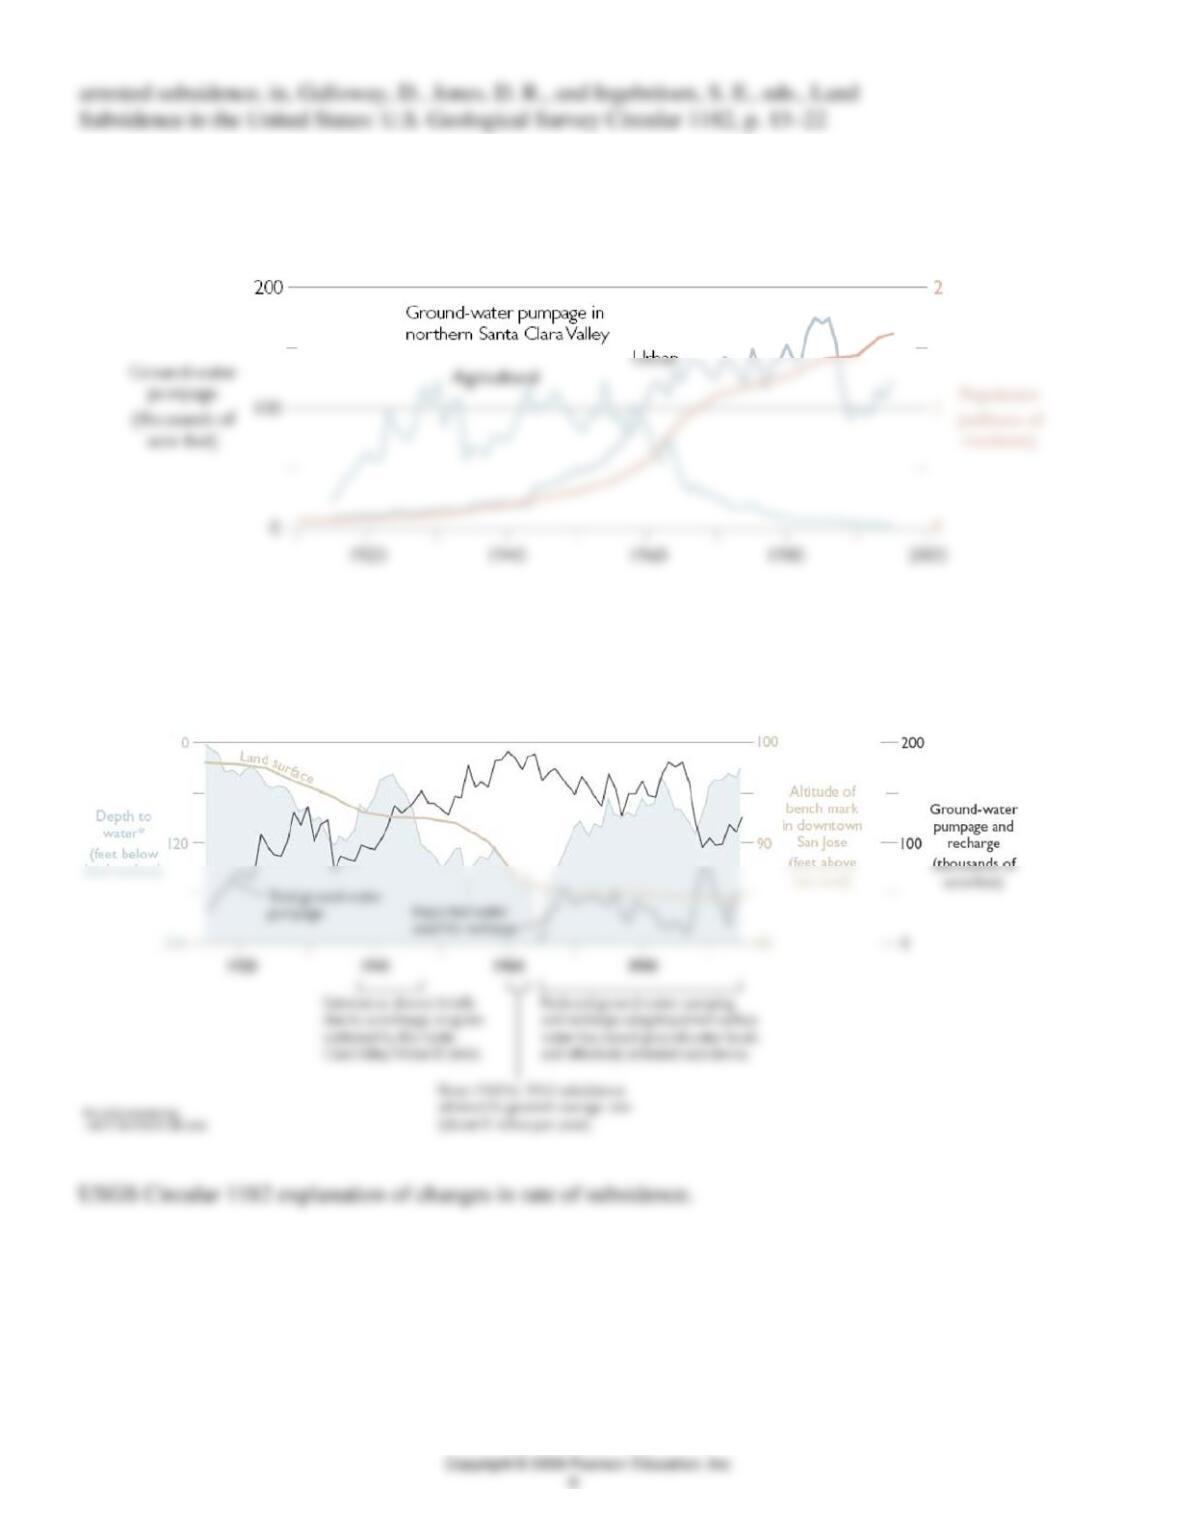
The three figures below are all from this report, and help provide context for answering
student questions.
This figure provides additional data that supplement and extend the graph shown as the
bottom part of Figure 9.5. The San Jose area has changed from predominantly
agricultural (circa pre-1940) to predominantly urban (now). This trend is shown by the
contrast between agricultural pumping and urban pumping.
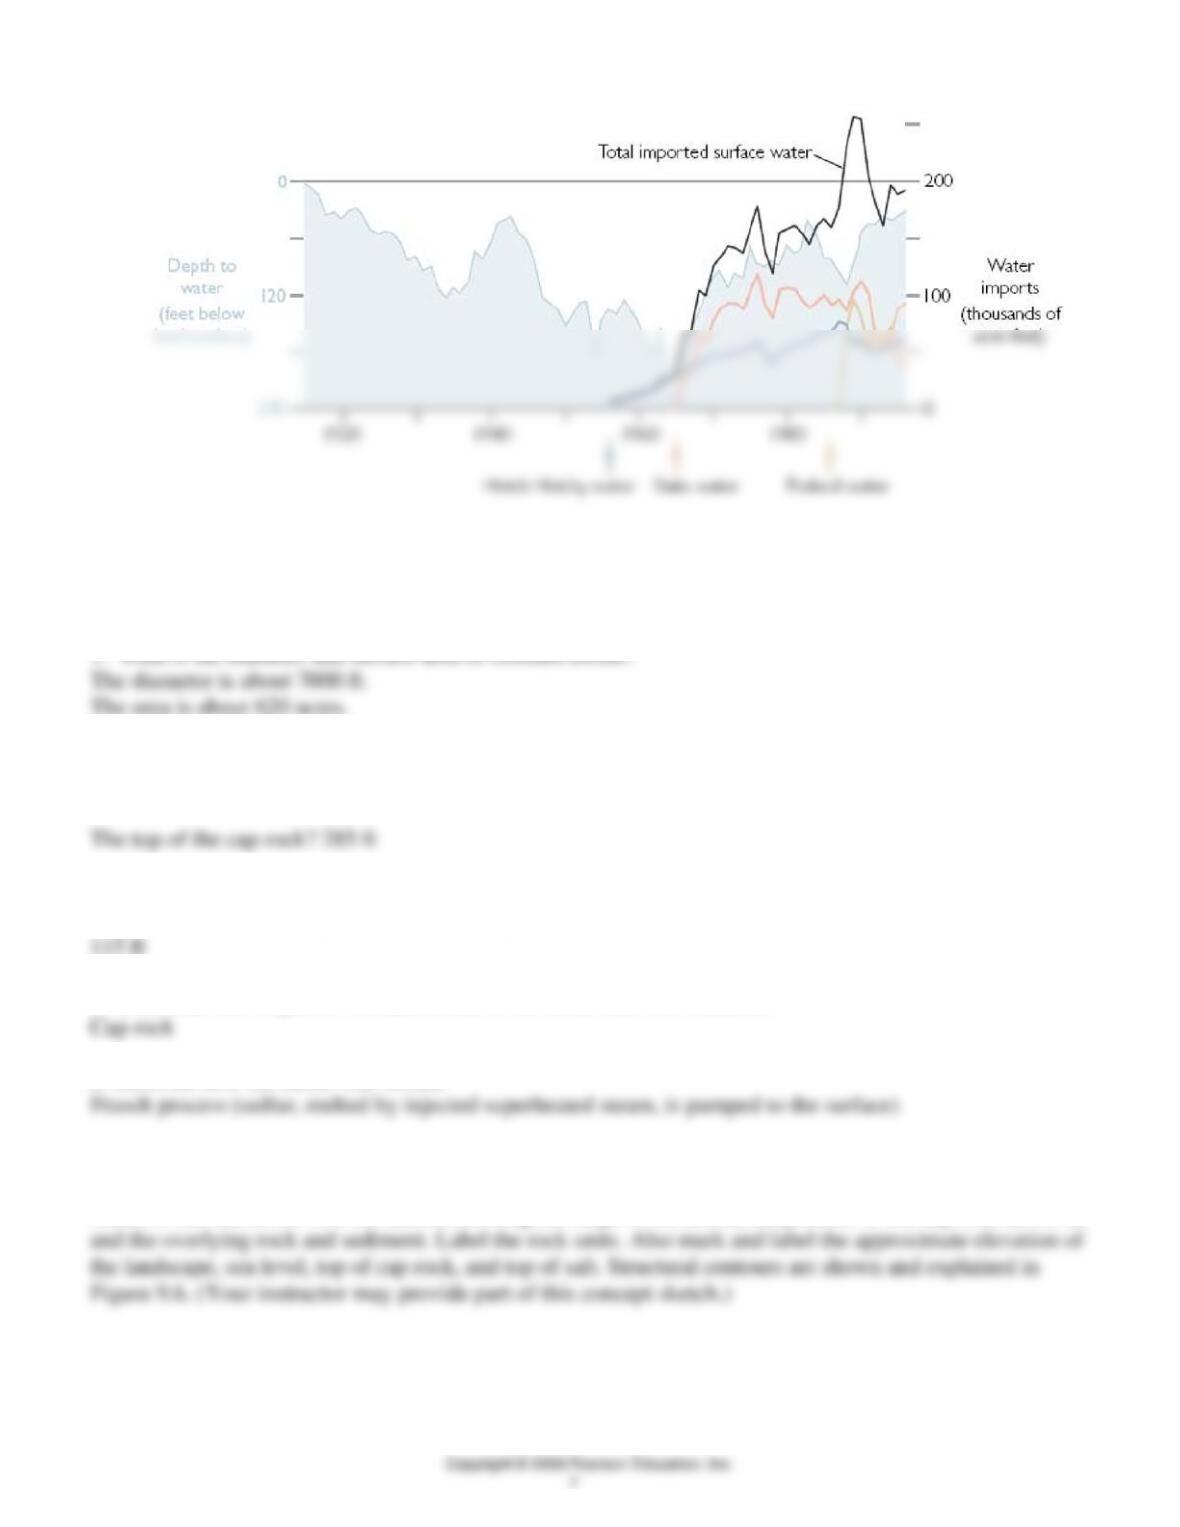
USGS Circular 1182 graph of water imports.
QUESTIONS 9, PART C
2. a. At what depth is:
The top of the salt? 375 ft
b. According to spot elevations and contours in Figure 9.6, what is the approximate elevation of the land
surface above the dome (i.e., above sea level)?
3. a. In what unit or part of Orchard Dome is the sulfur that was extracted?
b. Describe how the sulfur was mined.
4. From the description of the Orchard Salt Dome and information in Figure 9.6, make a simple concept
sketch of the salt dome in cross section showing the shape of the dome, the position of the cap rock above it,
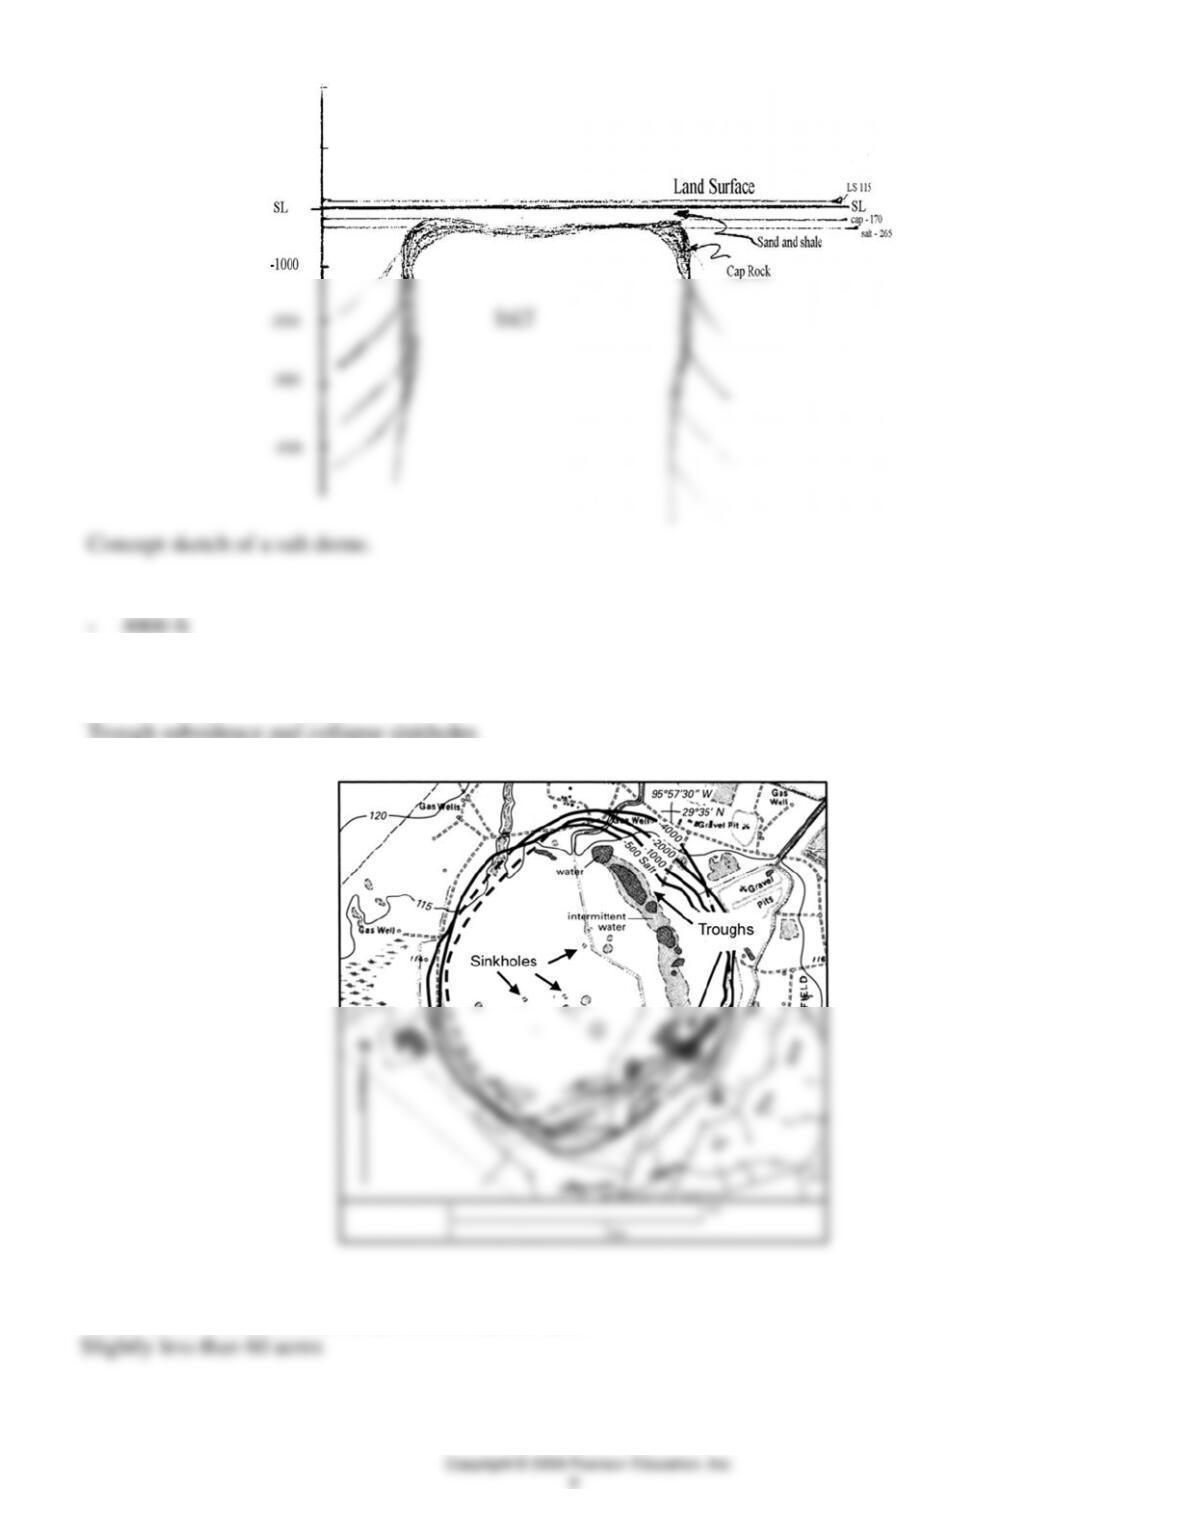
5. How far below sea level is the lowest structural contour for the dome?
–
6. On Figure 9.6, identify and label the two types of subsidence features that are described in the
introduction. The two types are:
Trough subsidence and collapse sinkholes
7. Refer to Figure 9.7 to determine the surface area of the large northeastern subsidence feature in 1970,
when sulfur extraction ended, and record answer here.
8. By 1979, the NE subsidence feature had extended to the SE beyond the area seen in Figure 9.6. It
reached across a road almost to one of the small open circles (marked “A” in Figure 9.6) at the end of an
unimproved road.
a. According to data in Figure 9.7, by how many acres had the flooded subsidence area increased between
1970 and 1979?
b. What do the small open circles on the map (Figure 9.6) represent?
c. Explain, with the aid of your salt dome cross section in Question 4, why these circles occur outside the
salt dome. (Hint: Related to the mechanism of salt dome formation.)
9. What was the average rate of increase in subsidence area between 1941 and 1979 for this major
subsidence trough?
10. A reconnaissance flight over the dome in 1985 documented an increase in the number of sinkholes
from 16 to 22 in the central dome area since 1979. Investigators were not able to accurately determine if
there were any increases in the NE subsidence trough in 1985.
a. What is the latitude and longitude marked near the NE edge of the dome in Figure 9.6?
b. Describe how you might go about determining the current number and distribution of sinkholes and
troughs in Orchard Dome today? (Hint: The answer to Question 10a should help.)
QUESTIONS 9, PART D
1. a. Longwall coal mining is a more modern mining technique used in some areas, but the older type of
underground coal mining used in many parts of the country is known as:
Room and pillar
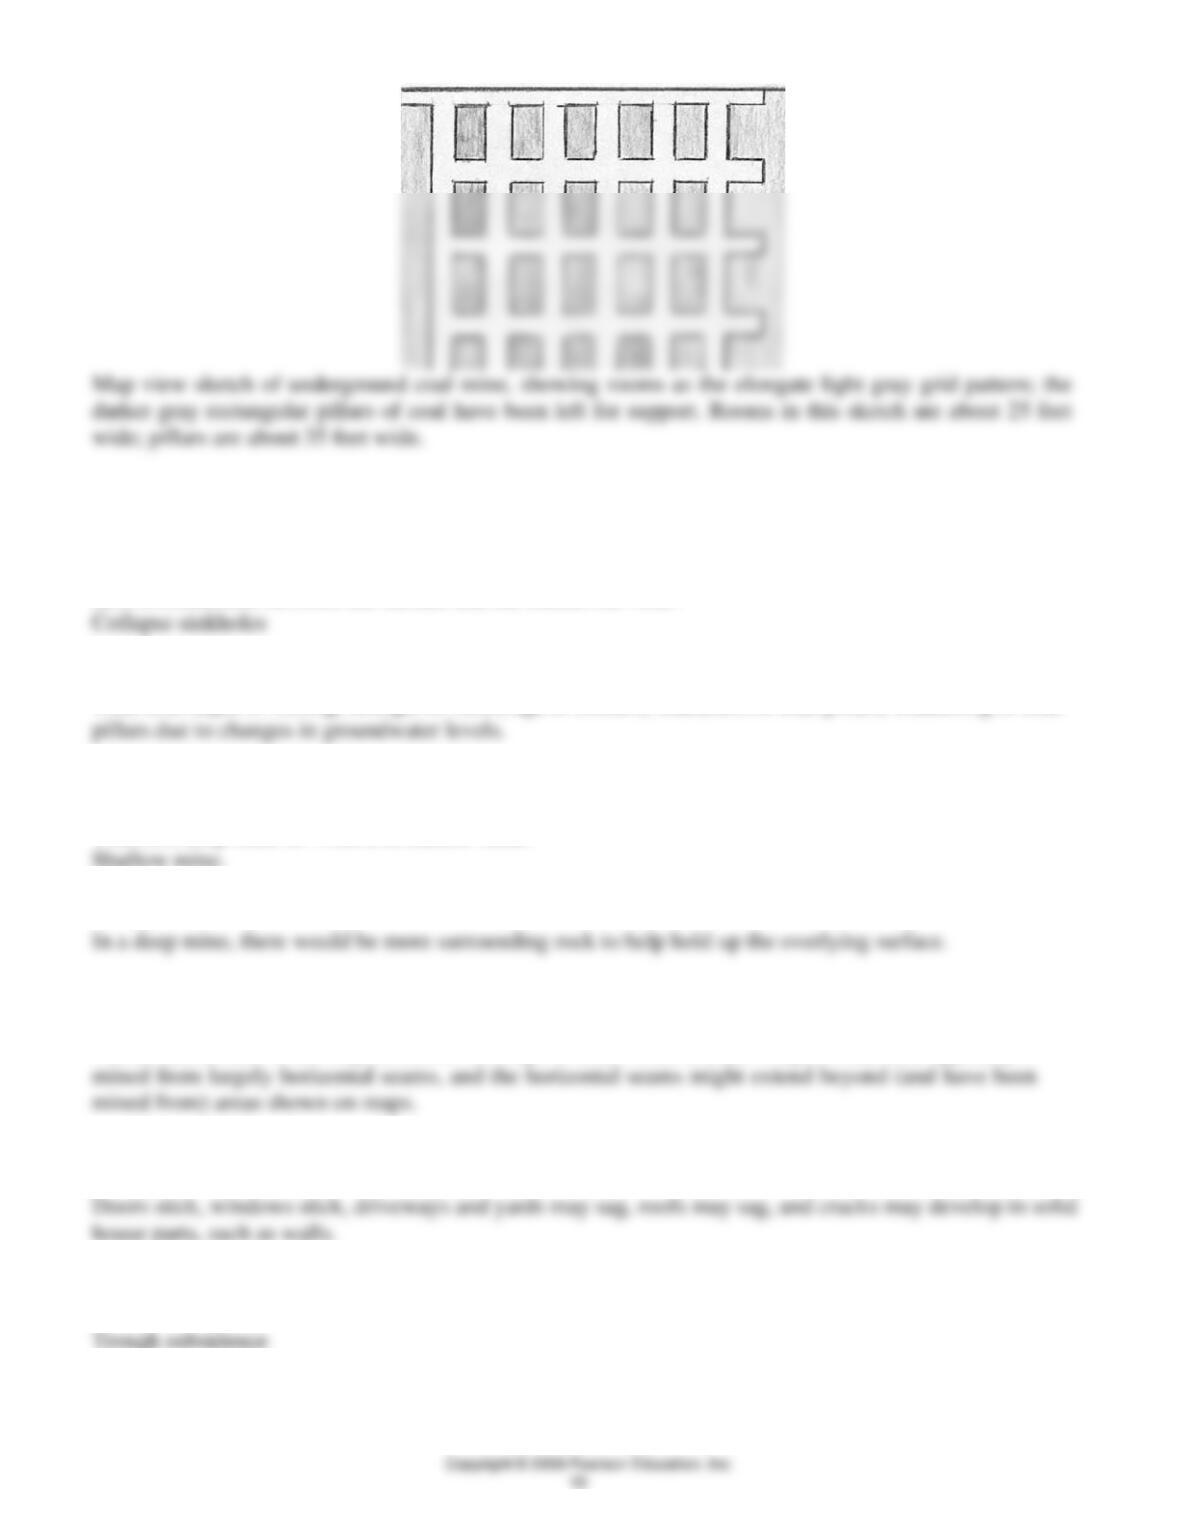
b. Make a labeled sketch below showing a map view of a subsurface coal mine in which about 50% of the
coal has been removed by the room and pillar method (see the lowest part of the cross section in Figure
9.8 for a view of such a mine).
2. a. What are the two subsidence landforms common above these coal mines?
Circular depression or collapse sinkhole, and subsidence troughs.
b. Which of these two subsidence landforms would likely develop over shallow-depth mines and might
have a connection between the surface and the mined-out void?
3. List at least four factors that control subsidence over coal mines.
Void size, depth of mining, strength of rocks, age of timbers, soundness of coal pillars, weakening of coal
4. a. Circle the option below that would most likely be the setting for a pronounced subsidence feature at
the surface, if the size of the void and the rock types were the same in both cases.
Void in a deep mine or Void in a shallow mine?
Shallow mine.
b. Explain
5. Why might your house be at risk even if it were not directly above a void shown on a mine map? (Hint:
Review Introduction.)
Not all subsurface voids may be shown on maps of coal mines (if such maps exist). Coal typically is
6. Over a period of several months, what damages, clues, or processes might you observe that help you to
recognize that your house is subsiding?
7. In Figure 9.8, a block diagram of a subsidence event, what is the major type of subsidence feature
shown?
8. In Figure 9.8, describe what is occurring
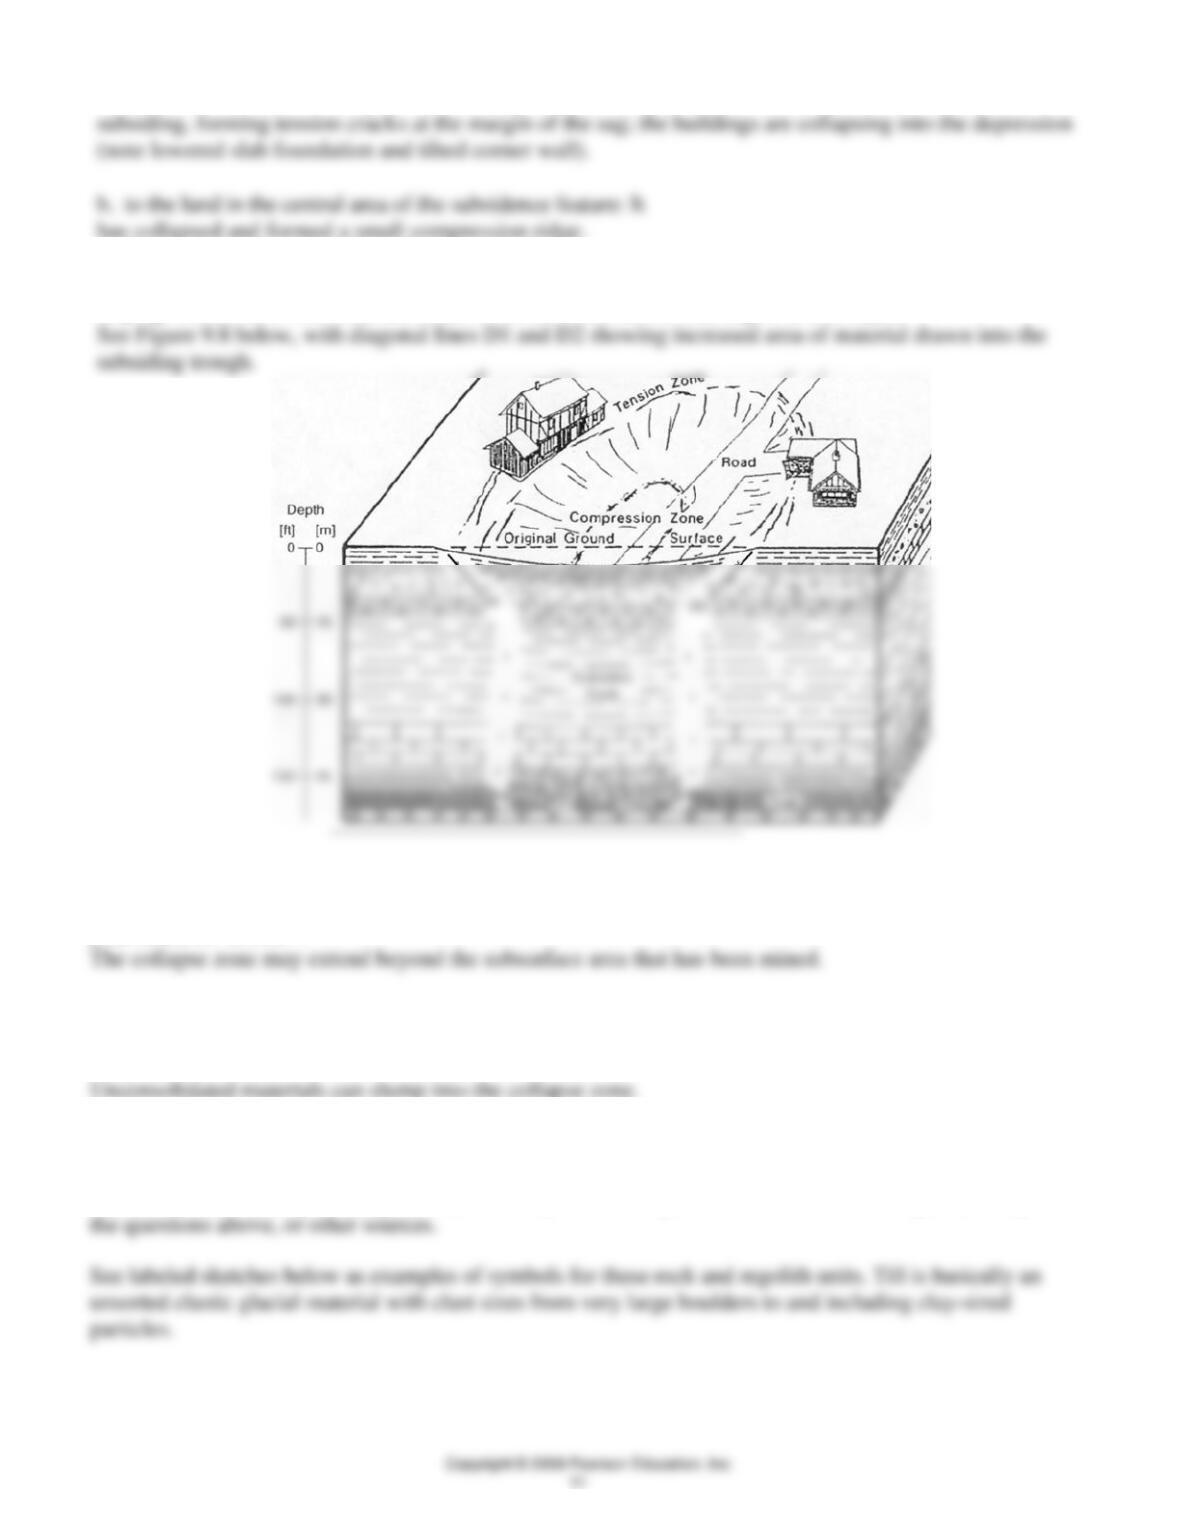
a. to the land and the buildings (visible damage) on the margins of the subsidence feature: The land is
9. a. In Figure 9.8, on the margins of the collapsed area above a depth of ~35 ft draw (and identify) a
sloping line to show the increased width of surface subsidence that begins at this depth.
b. What does the line that you have drawn in this diagram suggest about the difficulty of determining if
your house is “at risk”?
c. The level above which the width of subsidence begins to increase also is where a major change in
geologic materials occurs. Above is unconsolidated glacial till in the regolith; below is limestone bedrock.
Why does the increase in width of the subsidence occur here?
10. Geologists use standard symbols for geologic materials in most cross section diagrams, as in Figure 9.8.
Draw and identify below several of the geologic symbols for the rocks and/or unconsolidated sediments
shown in the block diagram (Figure 9.8). You may use those symbols identified in the diagram, its caption,
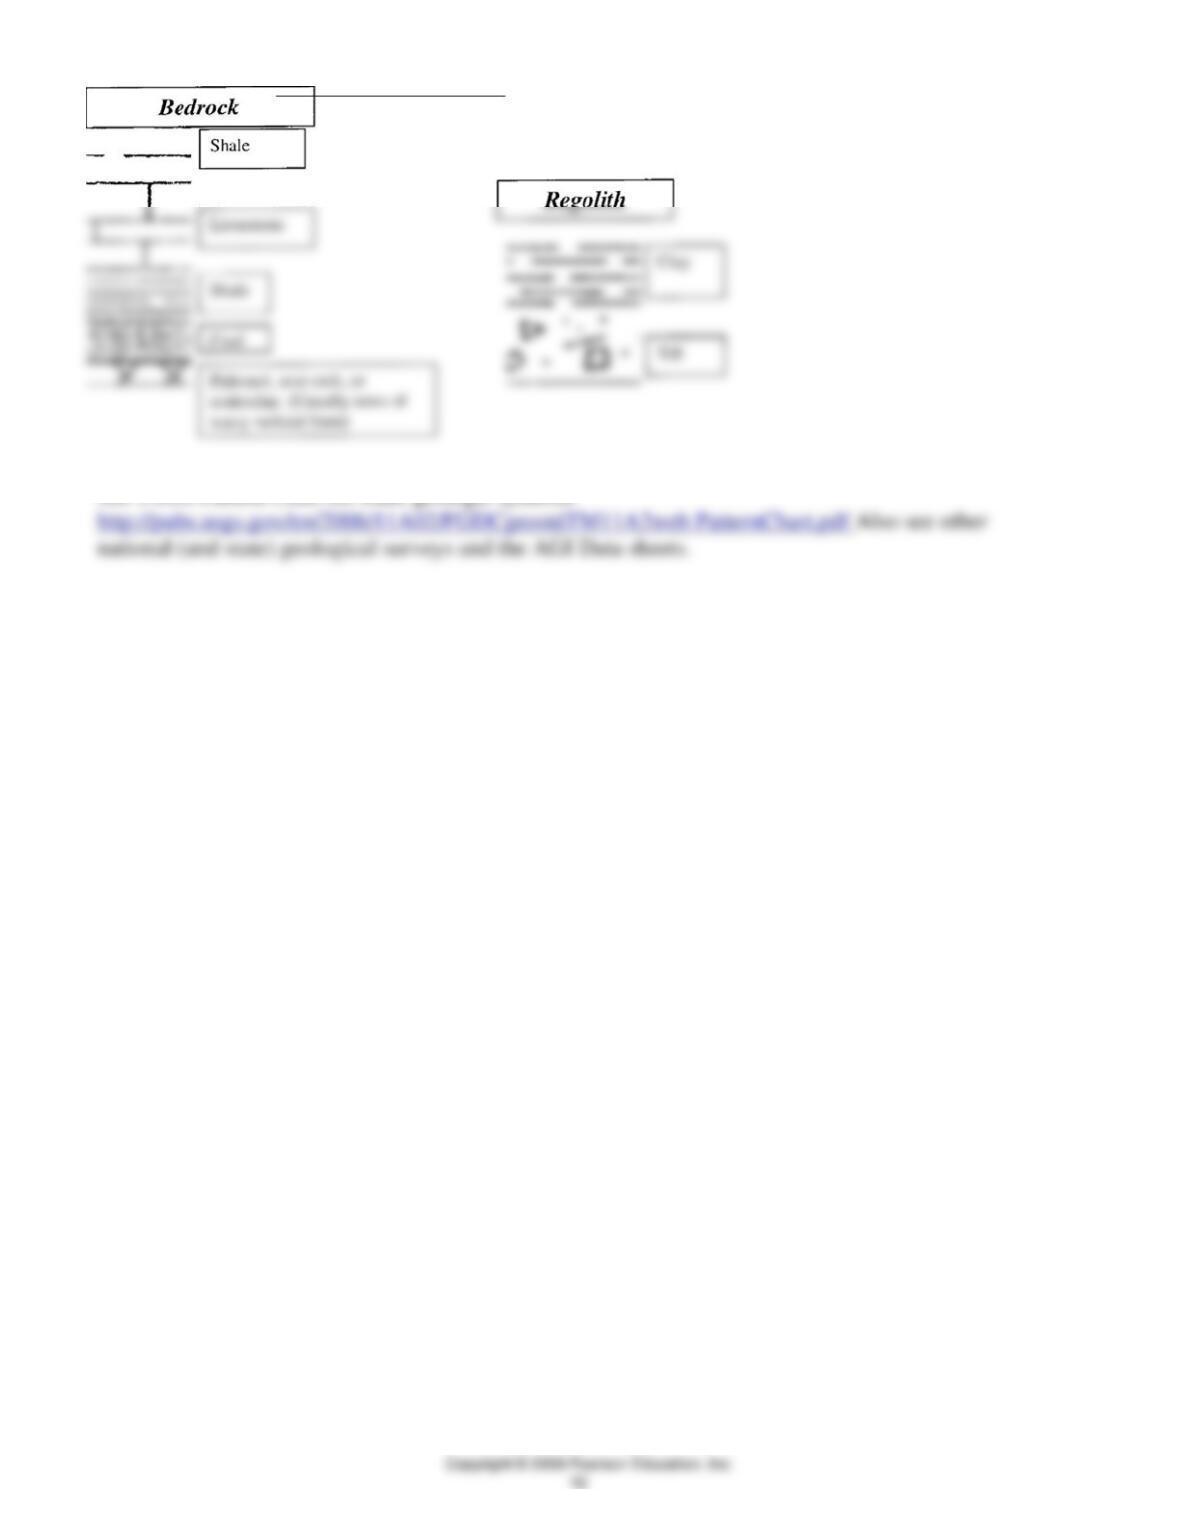
See USGS Pattern Chart for other geologic symbols