
Exercise 8
QUESTIONS 8, PART A
La Conchita, California
Figure 8.4 shows a landslide that occurred in 1995 above the small town of La Conchita,
California. This landslide reactivated in the wet winter of 2005, with disastrous consequences.
Note the shape of contours as they cross the landslide. Figure 8.5 shows a vertical aerial
photograph of the same site, and note how contours appear on this photograph.
1. a. Can you recognize the shape of contours that may indicate a landslide? Check with your
Teaching Assistant before going on to the next question.
Gardiner, Montana
Figure 8.6 is a photograph of the lower part of a landslide complex south of Gardiner, Montana.
Direction of view in the photograph is to the south from the townsite. This is an old landslide, but
it well illustrates hummocky terrain related to landslide deposition.
Refer to Figure 8.7, the aerial photograph, and Figure 8.8, the topographic map.
2. Mark on the aerial photograph (Figure 8.7) the area of the landslide(s). Look for irregular
terrain, typified by hummocky topography.
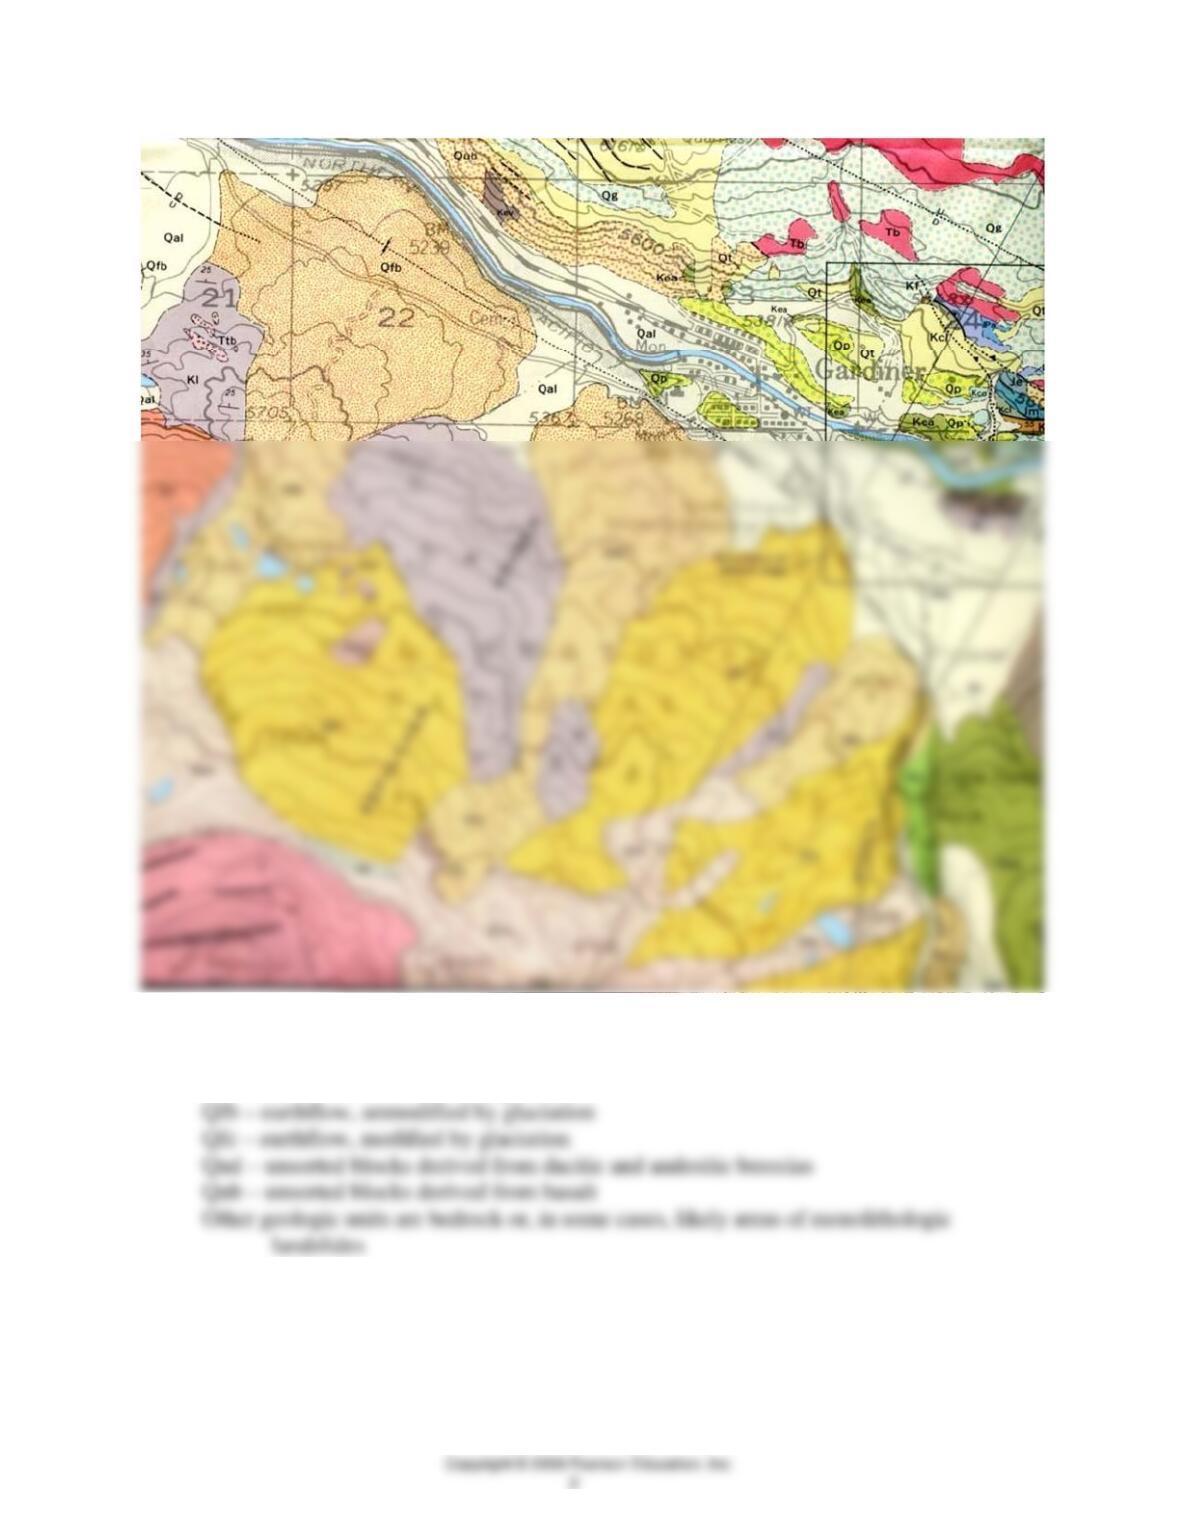
Map key
Qal – alluvium
Qfa – earthflow, unmodified by glaciation
3. On the topographic map (Figure 8.8), mark areas of the landslide(s). Particularly look for areas
of highly crenulated (folded, angular) contours rather than smooth contours. The 5,400-foot

4. What other landslide features identified by Nielson and Brabb (listed above) are present in this
landslide complex?
The easiest features to see are the hummocks, the lakes, several generations of landslides, told by
5. Figure 8.9 is a vertical aerial photograph of the Green River Gorge. Mark on this photograph
areas that you think, based on topography, may have landslides. What landslide characteristics
helped you make your identification?
6. Figure 8.10 is a topographic map of the Green River area. Use this map and see if you can find
any landslide areas. Are there any areas that have similar topographic contours to those shown in
Figures 8.4, 8.5, and 8.8? If so, mark them.
Some areas have similar contours. Especially note the area near Black Diamond Bridge State
7. LIDAR images can show landslides more clearly than either aerial photographs or topographic
maps. LIDAR allows “virtual deforestation:” that is, computer processing that removes trees and
lets the ground surface be mapped. Figure 8.11 is a LIDAR image of the Green River Gorge. It is a
smaller scale (larger area) than Figures 8.9 and 8.10. Mark on this image all the landslides you can
find. Do you agree or not that LIDAR allows identification of more landslides than maps or
photographs?
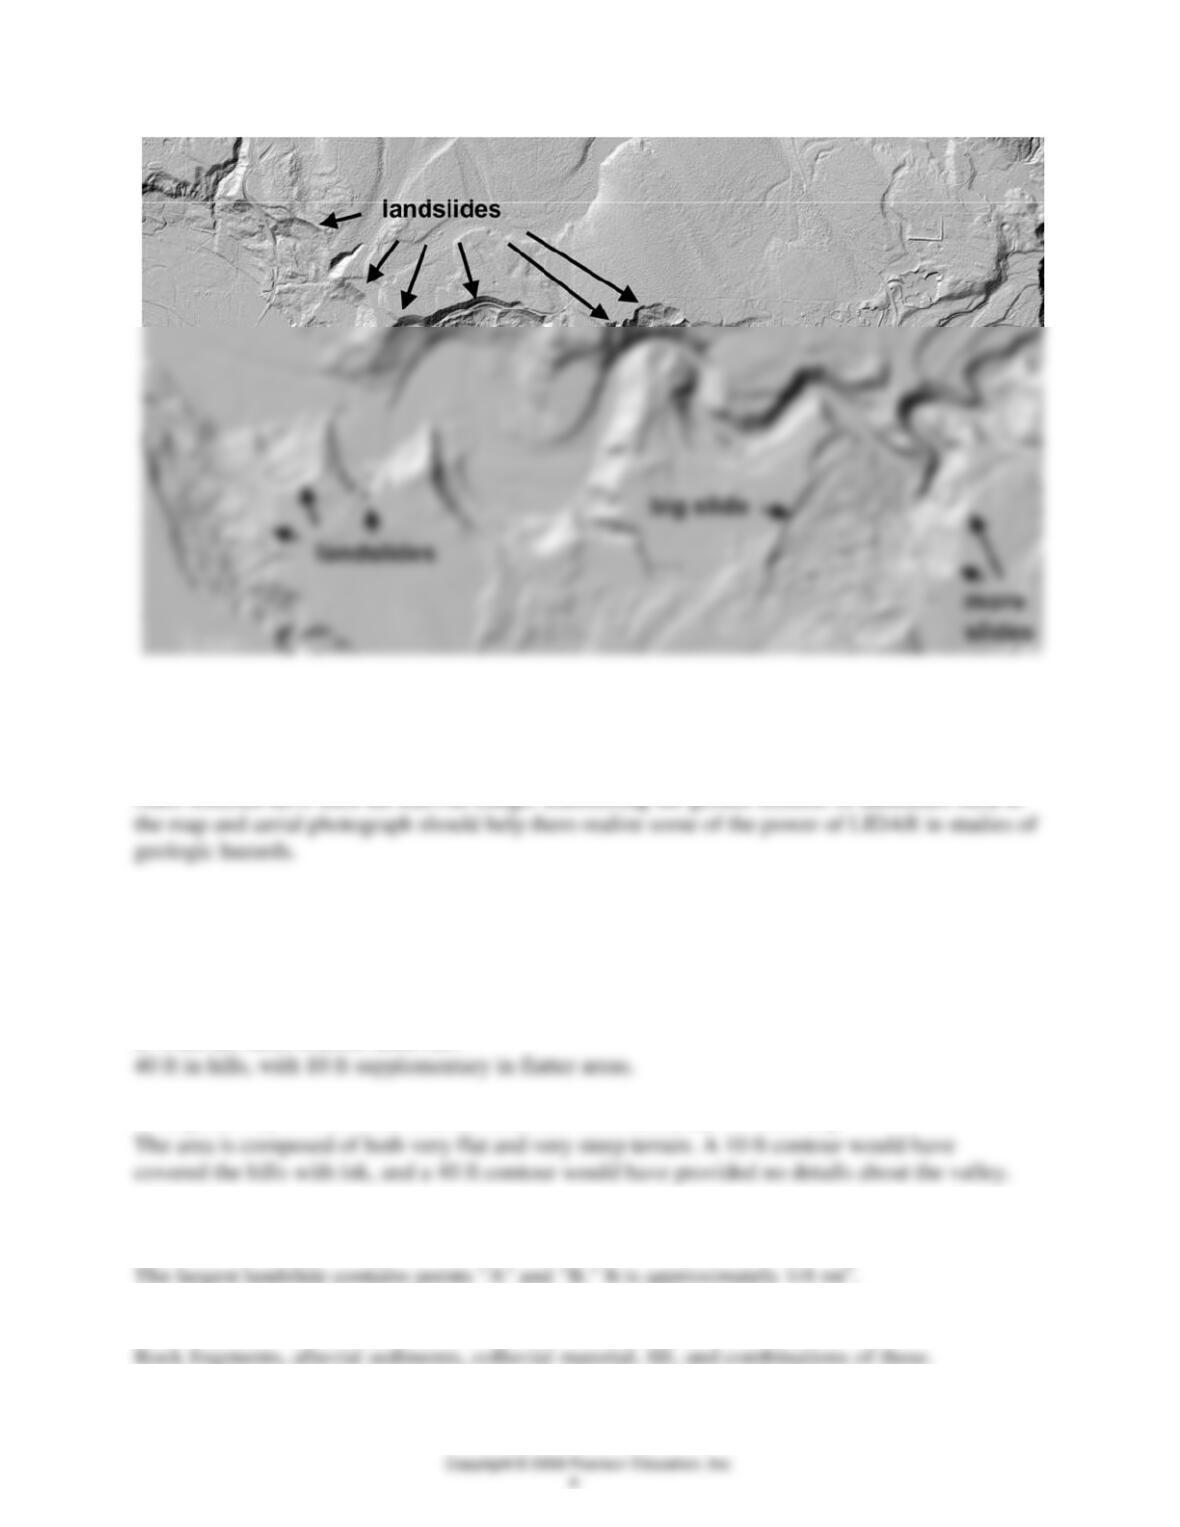
8. Use a colored pencil and transfer these landslides back to the topographic map (Figure 8.10) and
the aerial photograph (Figure 8.9). How many more landslides could you identify on LIDAR than
on the map? The photograph?
Once students have used the LIDAR image, transferring the greater number of landslides back to
QUESTIONS 8, PART B
1. Review Part A, carefully examine Figure 8.12, the explanation for this figure, and the
topographic map for this area (Figure 8.13 in the map section at the back of the book). Note that
two different contour intervals are used on each map.
a. What are these contour intervals?
b. Explain why two different contour intervals were necessary for each map.
2. Place an X in the area of the largest landslide deposit within the enclosed area in the center of
Figure 8.12. What is the approximate area of this slide in square miles?
3. What materials make up the landslide deposit?

4. The density of contour lines changes from the northeast part of the map to the southwest part,
indicating a change from steep to gentle slopes and suggesting an increase in potential for
landslides. What is the difference in elevation between A and B?
5. What is the distance from A to B in miles?
6. What is the average gradient (slope), in feet per mile, from A to B?
800 ft/mi
7. The gradient from X to Y is_____ , and from K to L it is ____ .
8. According to gradient, is the potential for landslide greater at X or K? Explain.
K. The slope is steeper.
9. What is the material labeled “Qal” on the map? (Q is an abbreviation for Quaternary, a
10. What are the two ways in which Qal is formed (see description)?
11. Locate the deposit Qaf. What is it?
These deposits are becoming more common as humans continue to alter the landscape. Some
12. Review the drawing of the mudflow in Figure 8.2. Observe the topography shown on Figure
8.12, and mark with “X” two areas that might be subject to mudflows. Explain your decisions.
(Hint: See Colluvial deposits on the explanation for Figure 8.12.)
a.
13. a. How far (in feet) is Noble School from a landslide deposit or an area of damage from
landslides (refer to Figures 8.12 and 8.14).
b. Are any schools on or closer to mapped landslides?
No

14. Would you expect a landslide to develop under Noble School? Explain.
15. Note that a road in the subdivision had to be abandoned. What road was extended to
accommodate the traffic?
16. In what subdivision are the badly damaged and abandoned houses?
17. Would you purchase a house on the north side of Boulder Drive, east of Sophist Drive (see
Figures 8.12 and 8.14)? Explain.
18. Why have the utility lines been placed above ground on the west side of Boulder Drive?
19. Money and resources are still being used to make this landslide region habitable. What short-
term and long-term solutions to the community’s problems might be appropriate?
Short-term: building codes to insure adequately engineered structures in slide areas. Landslide
20. On Figure 8.15 (1963), outline three major landslides.
21. Are there landslides on Figure 8.16 (1993) that did not appear on the 1963 stereopair? If so
outline them.
22. Mark two areas of additional houses and one other cultural feature that appear in the 1993
23. Using a colored pencil draw the contact between the base of the mountain and the alluvial fan
on which San Jose is built. What is the approximate elevation of this line? (Compare with the map,
Figure 8.13 in the back of the manual or Figure 8.12.)
24. a. What advice would you give to those seeking a building site in the mountain area?

b. As a consulting geologist, what advice would you give to the local zoning commission in this
QUESTIONS 8, PART C
1. Locate Athens, Ohio, on Figure 8.17 the geologic map of Ohio.
a. What is the geologic system (age) of rocks in Athens?
b. From your knowledge of geologic materials (clays, shales, limestones, sandstones, etc., which
are reviewed in Exercise 1) and the detailed descriptions in Table 8.2, which of the four youngest
geologic systems would be the most susceptible to landsliding? Explain.
c. Which formations or members would most likely deform by flow? (Hint: Engineers in Ohio
refer to them as “those d——d redbeds”; Delong 1996.)
d. Much of the Appalachian Plateau (Physiographic Province) is underlain by Pennsylvanian age
and similar rocks. Would you expect similar landslide conditions in other areas of the plateau such
as Pittsburgh, Pennsylvania, to the east of Athens County? Explain.
2. Knowing that the bedrock in Ohio is nearly flat, list those slope stability factors (select from
those in the Introduction to Exercise 8) that are important in causing landslides in Ohio.
Types of earth materials, steepness of slopes, water, type of vegetation present and proximity to
3. List two human activities that could increase the potential for landslides.
Coal mining or other undercutting of slopes and loading the tops of slopes with buildings or
4. Figure 8.18 shows an apartment complex under construction near the top of a hill that has
been graded to produce a flat area for the buildings. On this aerial photo taken in 1968 near
Athens, Ohio, identify:
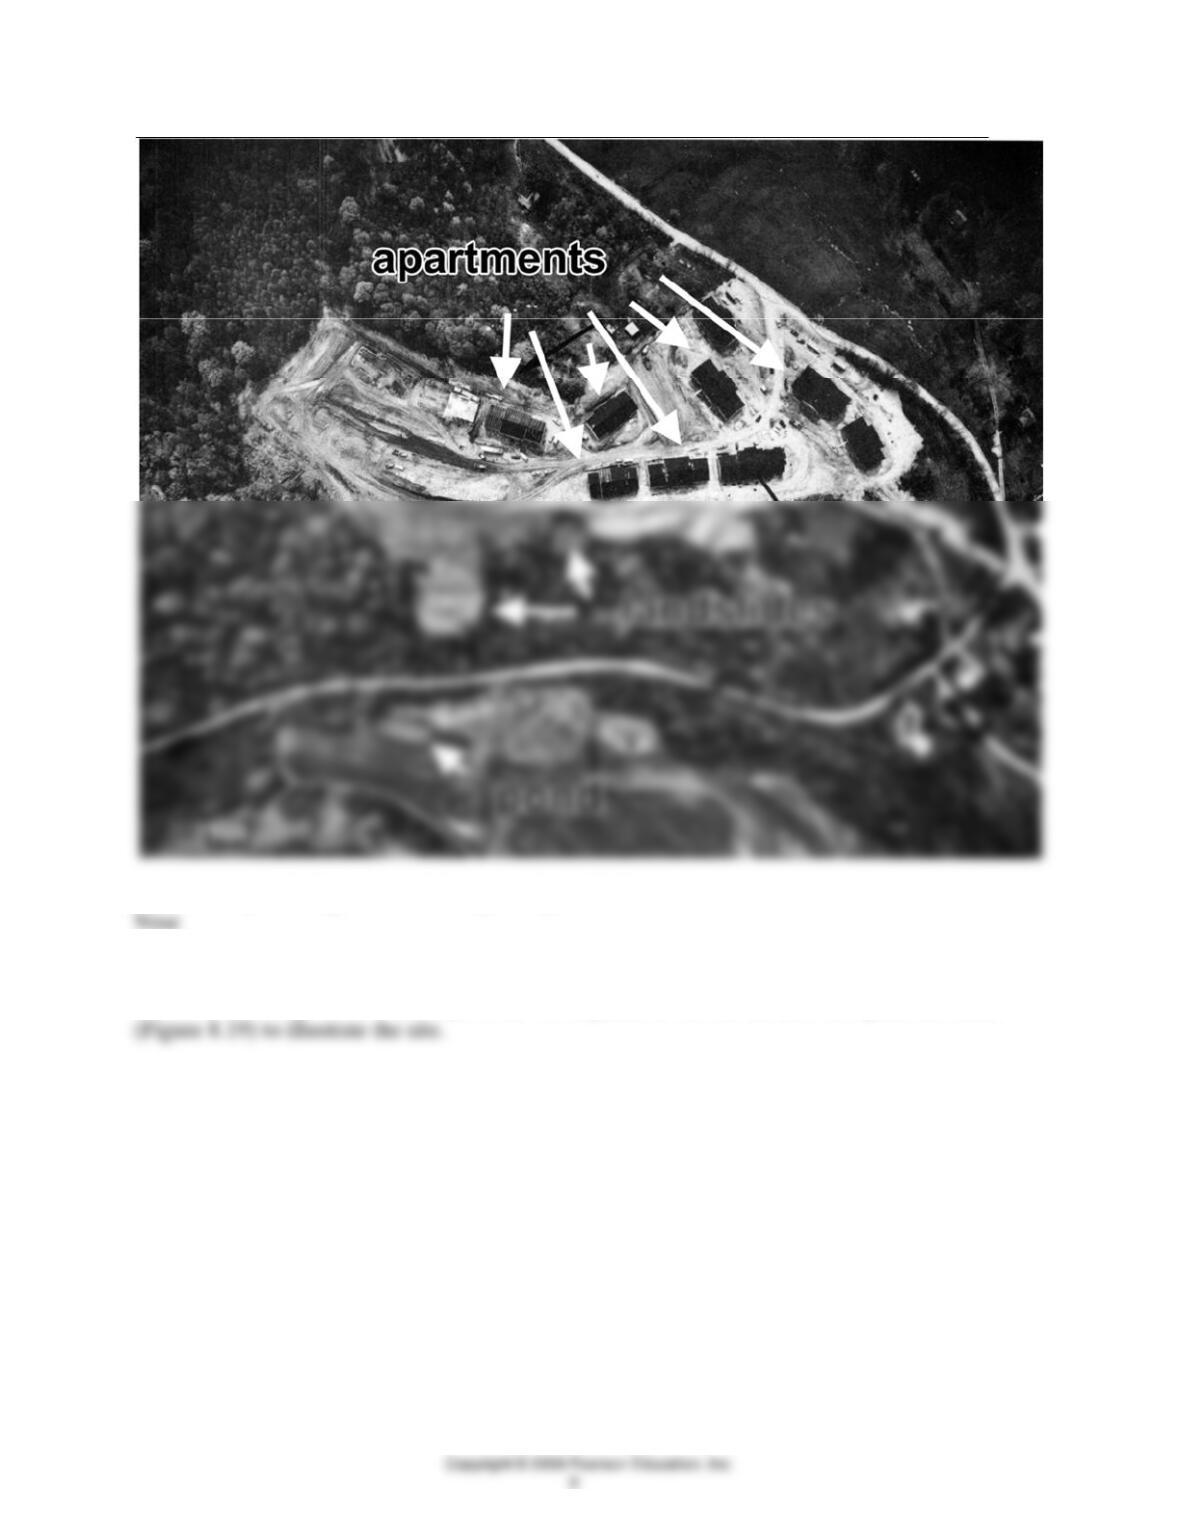
5. How many buildings are roofed or partially roofed?
6. The rock and regolith graded from the high areas of the hillside were used as fill to provide
additional building sites on the slope of the hill adjacent to the cut surface. Complete the sketch
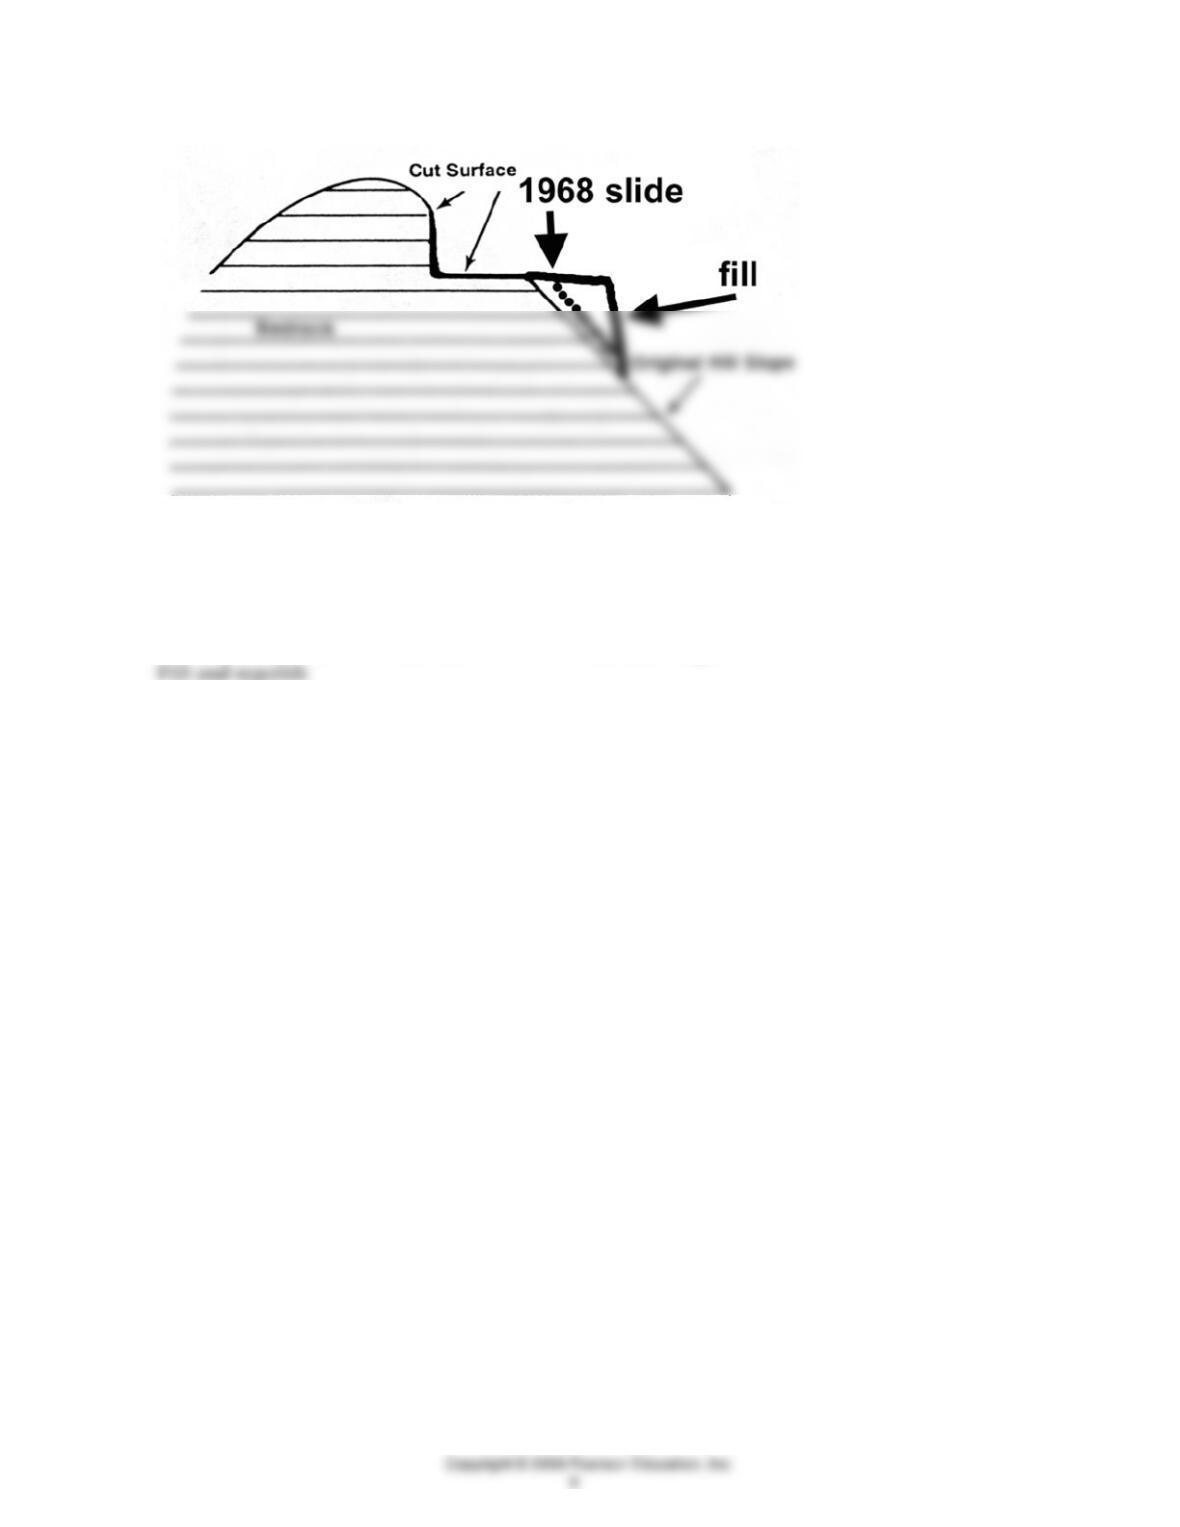
7. a. Where would the landslides observed in the 1968 photo (Figure 8.18) be in your sketch
(Figure 8.19)?
See above
b. What is the material of this landslide: bedrock, fill, or regolith?
8. On the 1971 stereo triplet (Figure 8.20):
a. Mark the area of rockfall hazard for the apartments with (R).
See photo below
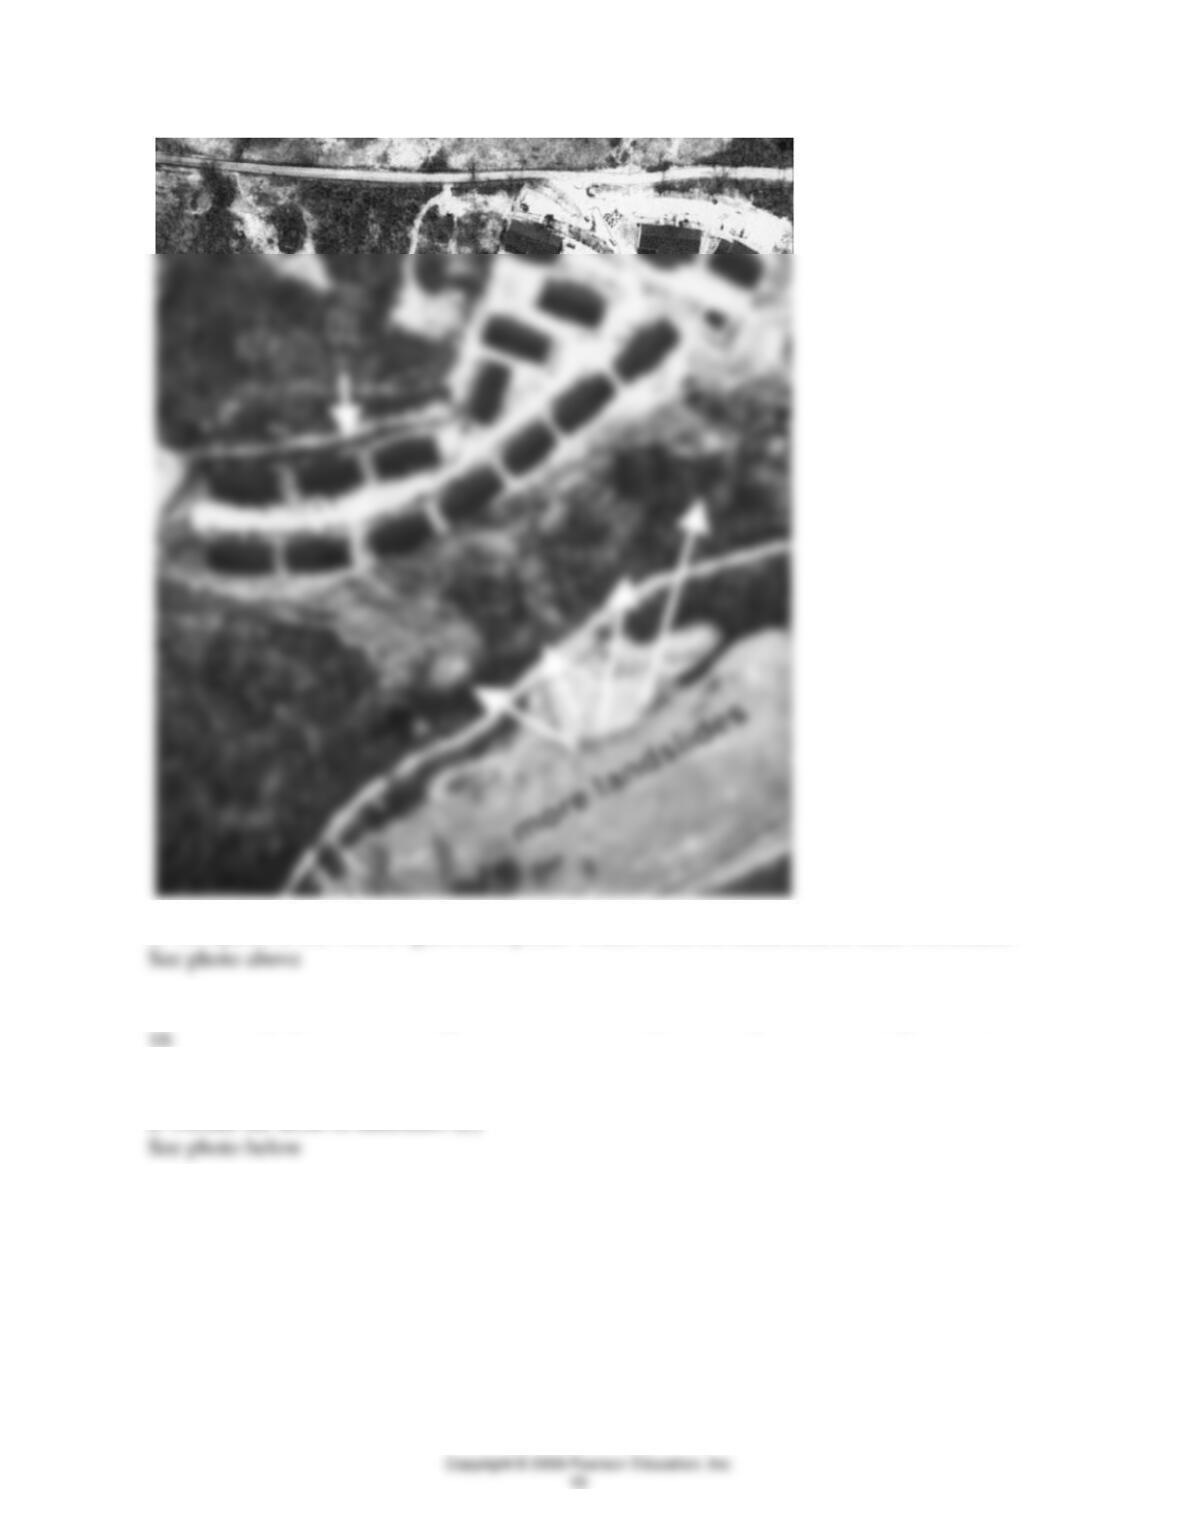
b. Compared to the 1968 (Figure 8.19) photo. Where is the increased area of mass movement?
c. How many apartment buildings are there in the completed complex in 1971 (Figure 8.20)?
9. On the 1975 stereopair (Figure 8.21):
a. Outline the areas of landslides (L)
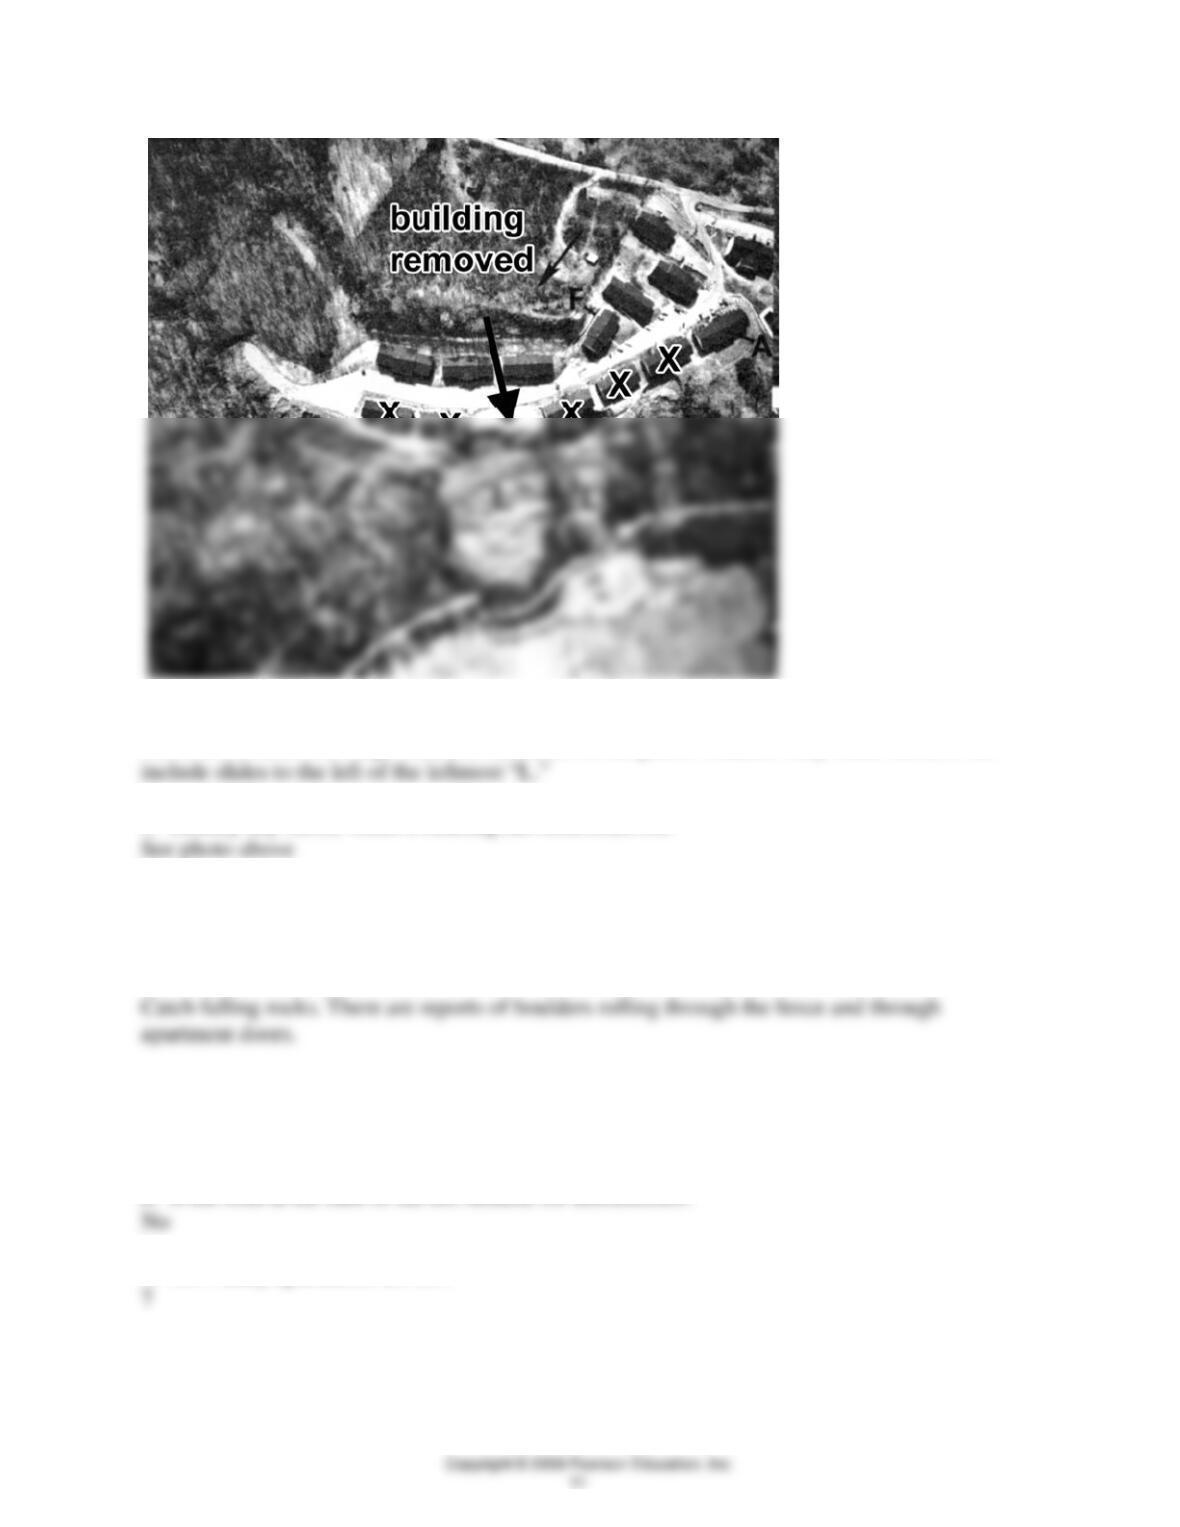
b. How many different landslides can you identify?
There are at least four large slides, as indicated on the photo. Students may count more, if the
c. Identify any site(s) where a building has been removed.
d. Mark buildings with an “X” that you think will be lost or removed because of mass wasting.
See photo above
e. What is the purpose of the chain-link fence (F) behind the apartment?
f. What type of mass wasting deposit would you find adjacent to the fence? Explain.
Colluvium, composed of small rocks (the large ones would have crashed through the fence).
10. From the 1976 image (Figure 8.22):
a. Is the road at the base of the hill suitable for automobiles?
b. How many apartments are left?
c. Why did they not build these structures where it is flat, such as at B?

d. What is the type of mass wasting that destroyed the road?
Earth flow or debris flow component of the toe of the slump (or the slump).
in 1995?
The 1995 map shows 7 (the same ones as the 1975 photograph).
c. On the 1995 map, add the apartment buildings that once existed (see 1975 photo; Figure 8.21).
The maximum number of apartments was 16.
Students should mark the map appropriately.
f. On the 1995 map, mark one location where natural change in the river has occurred following
channelization by humans in the early 1970s. What is the change and what is your evidence that it
has occurred?
By the word “Run” near the bridge closest to the apartments the river has been partially filled in.
The river is mapped as being narrowed. The river is also slightly filled in to the left of the bridge.

14. Now that you have nearly completed the exercise you should be able to see the development of
the major landslide, active before all the apartments were built. Describe changes in the road and
flood plain from the photos:
a. 1968–1971
15. What recommendation would you give to anyone preparing a building site in the vicinity of
and at the same level (and presumably with the same strata) as the apartment site?
QUESTIONS 8, PART D
1. What are the most common slopes for avalanches in degrees and in percent?
2. Why are avalanches not as common on slopes that are less steep or that are more steep? Slopes
3. Where on a slope profile is an avalanche most likely to begin?
4. If the winds from a storm are blowing out of the west, on which side of a mountain will most
of the snow accumulate? Why?
5. Describe three possibilities for a safe route through avalanche terrain.
a. On ridgetops and slightly on the windward side of ridgetops (on windward slopes).
QUESTIONS 8, PART E
Aspen, Colorado

There are two zones of avalanche hazard presented on the Aspen map (Figure 8.29 in the colored
maps section). Darker zones are known avalanche areas, and lighter zones are areas that may
sometimes have small avalanches. Lighter areas also represent extensions of the known areas.
Bryant (1972) notes, “The most obvious avalanche paths are in gullies or on steep treeless [or
sparsely vegetated] slopes below treeline.”
1. Calculate slopes in degrees or percent for the following paths or potential slide areas:
a. The path marked A, just south of Tourtellotte Peak.
b. The path marked B, for its full length from the highest elevation in the shaded zone above the
B, to its lowest point near the word “Fork.”
c. The lighter-colored zone immediately south of Aspen, beneath the ski lift east of Pioneer
Gukh.
d. Describe the relationship between the results you calculated above and your answer to
question 1, part A. Based on your calculations, are the avalanche areas depicted on the map
justifiable on the basis of their slope (as the only data)?
2. Now inspect other slopes that have mapped avalanche paths depicted on Figure 8.29. Are
these slopes likely to have avalanches based on the answer to question 1, part D?
3. In addition to slope, what other kinds of data might the author have used in depicting
avalanche areas on this map?
4. Mears (1976) gives the following formula for calculating the runout distance (defined as the
lower boundary of the track to the outer limit of impact) of an avalanche with a confined path: S
= 214 + 11.4A
where S = distance in meters, and A = area of the starting zone in hectares.
This formula is based on snow and terrain conditions found in Colorado, and may not be as
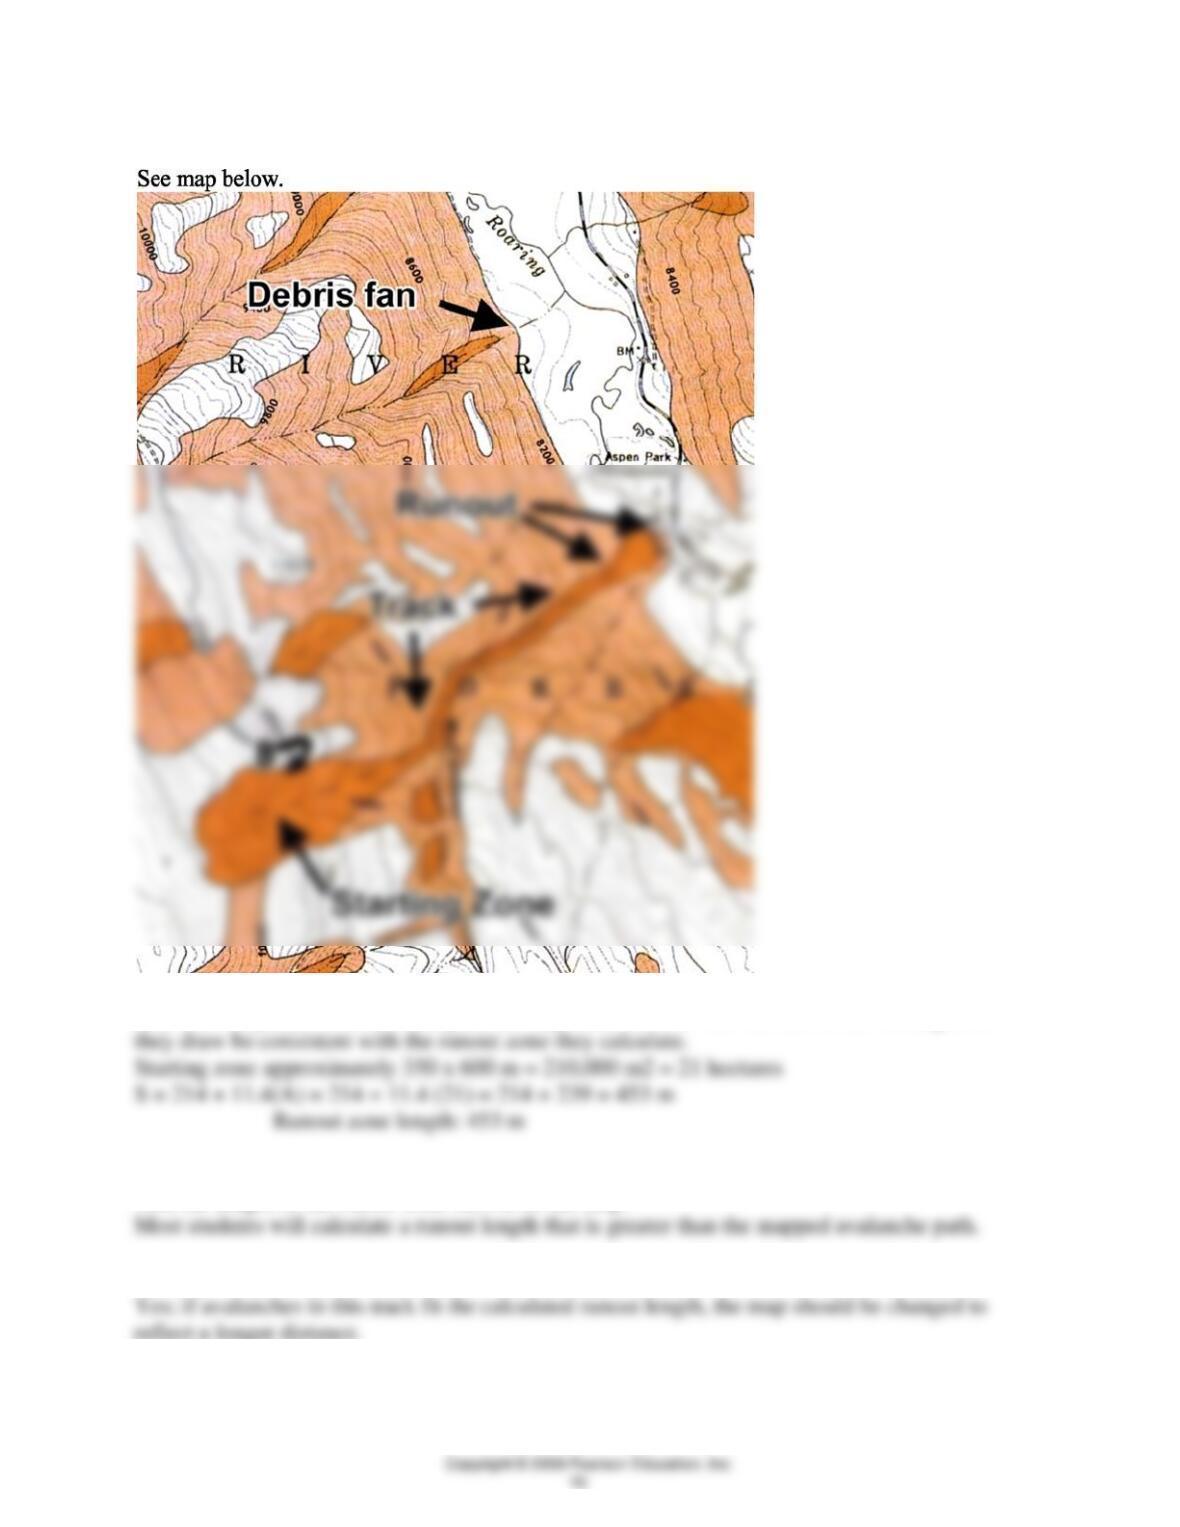
For this exercise, estimate the starting zone area by approximating it with a rectangle. Students
may draw slightly different rectangles; the important factor is that the size of the starting zone
5. a. How does the runout distance you calculated for the McFarlane Creek runout zone compare
with the length of the runout zone shown on the map?
b. Do the results suggest any changes for the map?

6. Notice that the contours at the mouth of McFarlane Creek bend away from the range front out
into the valley. They represent a debris fan or alluvial fan. Are there other debris fans along the
valley of Roaring Fork that could be related to avalanche activity? If so, where are they? See
7. What evidence would you look for in the field to determine whether debris fans, such as at the
mouth of McFarlane Creek, is related to stream deposition or avalanches?
Students may struggle with this question (“How am I supposed to know that?”). They could look
8. The colored map of the Aspen area was published in 1972. Did McFarlane Creek avalanches
present a hazard to people at that time? Explain your answer.
9. Compare Figures 8.28 and 8.29 (the colored map). Identify changes in human use of the land at
10. How have changes in human use of the land at the base of McFarlane Creek increased or
decreased hazards from avalanches since 1972?
11. First, let’s look at a typical small-avalanche site on the Alta map (Figure 8.30). Carefully
identify, in the general area marked A (the gully west of the Flagstaff Mine, on the southeast side of
Flagstaff Mountain), a starting zone for an avalanche that might travel down the gully. Also mark
the track and identify a runout zone. Determine the slope angle for the track and calculate the
length of the runout zone, based on your data and using the formula given in Question 4. (The
formula may not really apply here, but it gives an approximation.) Show your work.
Slope ____
Runout zone length _____
12. The Alta Guard Station and other buildings are shown along the road. Are these buildings at
risk for a small avalanche? Explain.

13. Now let’s look at the risk of an unconfined avalanche on the same map. From the east side of
peak 10277, which is north of Hellgate Spring and southwest of Flagstaff Mountain, draw a line
along the 10,000 ft contour for 1 mile east. Refer to Figure 8.26 as a guide, and mark clearly on the
map about how far you think that the runout zone from an unconfined avalanche with a mile-long
starting zone might have gone. Was the town of Alta at risk for this type of an avalanche? Explain.
Students should draw the line as indicated on the map. Runout zone calculations don’t mean