QUESTIONS 3, PART A
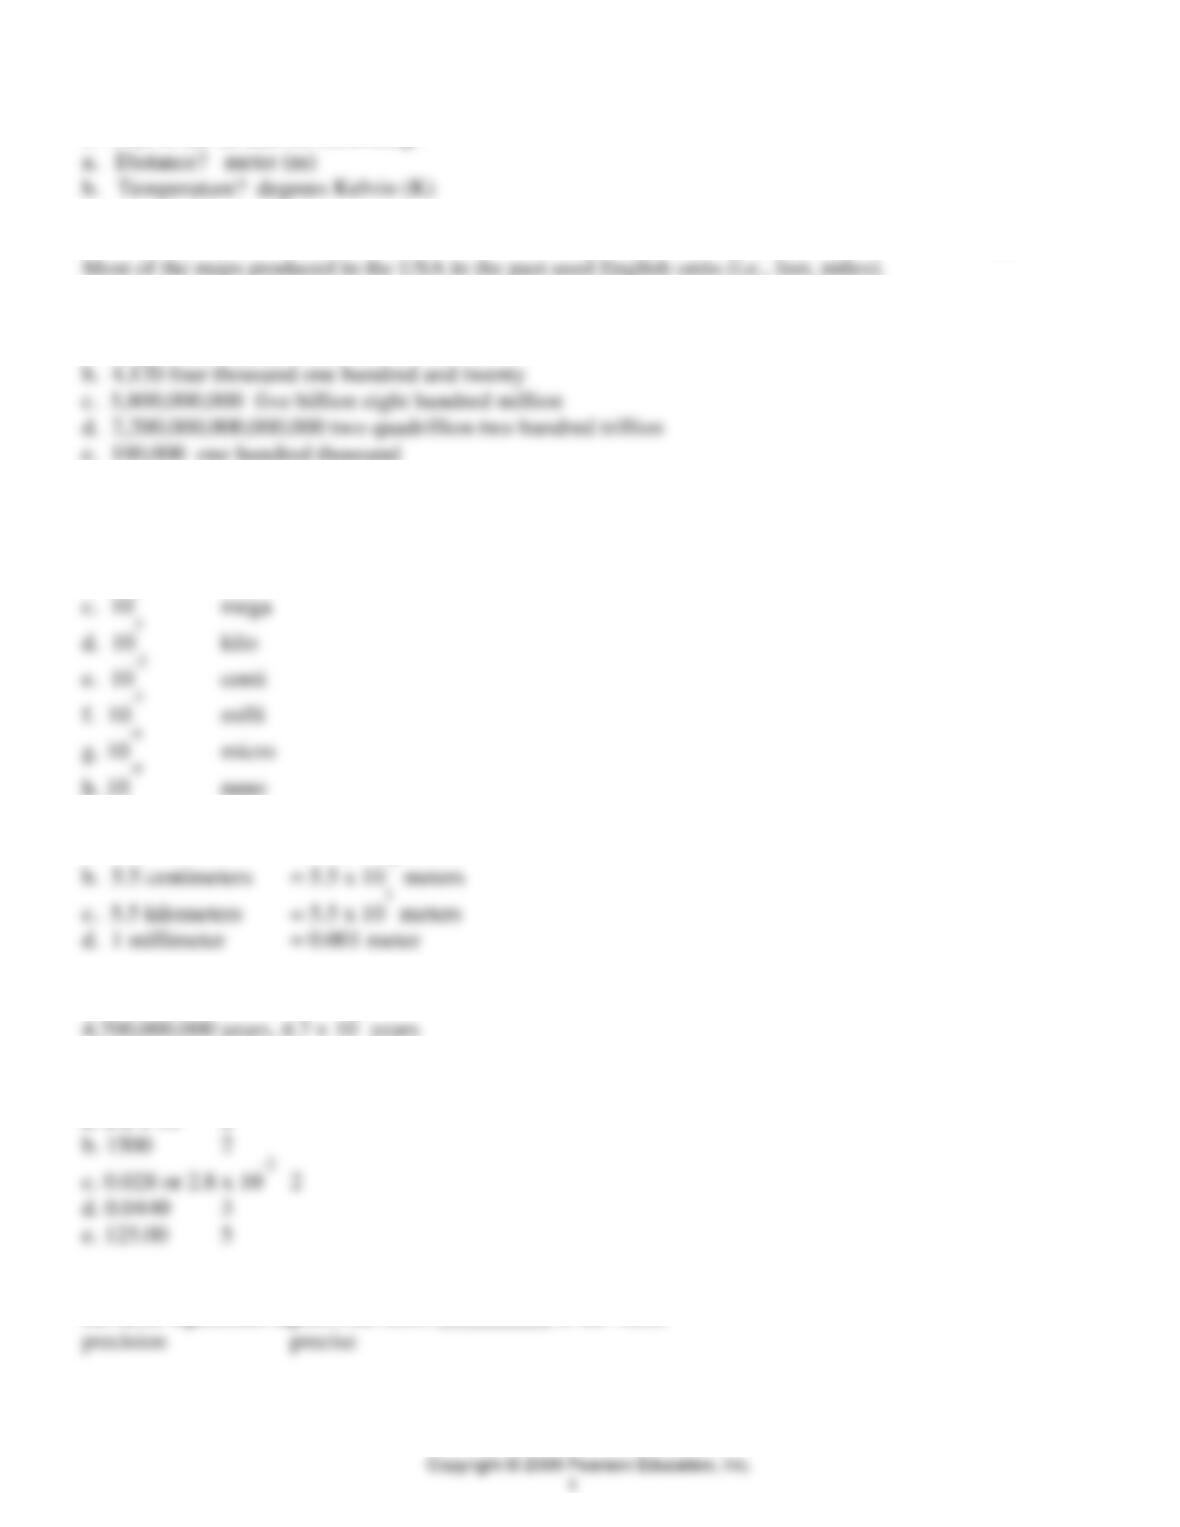
1. What is the SI unit for measuring:
2. Why might geoscientists not use SI Units in working with some maps produced in the United States?
3. Give the value in words and numbers for the following numbers, which are given in scientific notation (the
first is given for you).
4. Consult Appendix I to determine the value and name for the following prefixes in the International System of
Units:
b. 109 giga
5. Complete the blanks in the columns to provide the name and equivalent values in meters.
6. Write in long form and scientific notation the equivalent of 4.7 Gyr?
7. Give the significant figures for the following:
a. 2.2 x 10² 2
8. Complete the sentence. The number of significant figures in a number is an indication of the __________;
the more significant figures, the more __________ is the value.
QUESTIONS 3, PART B
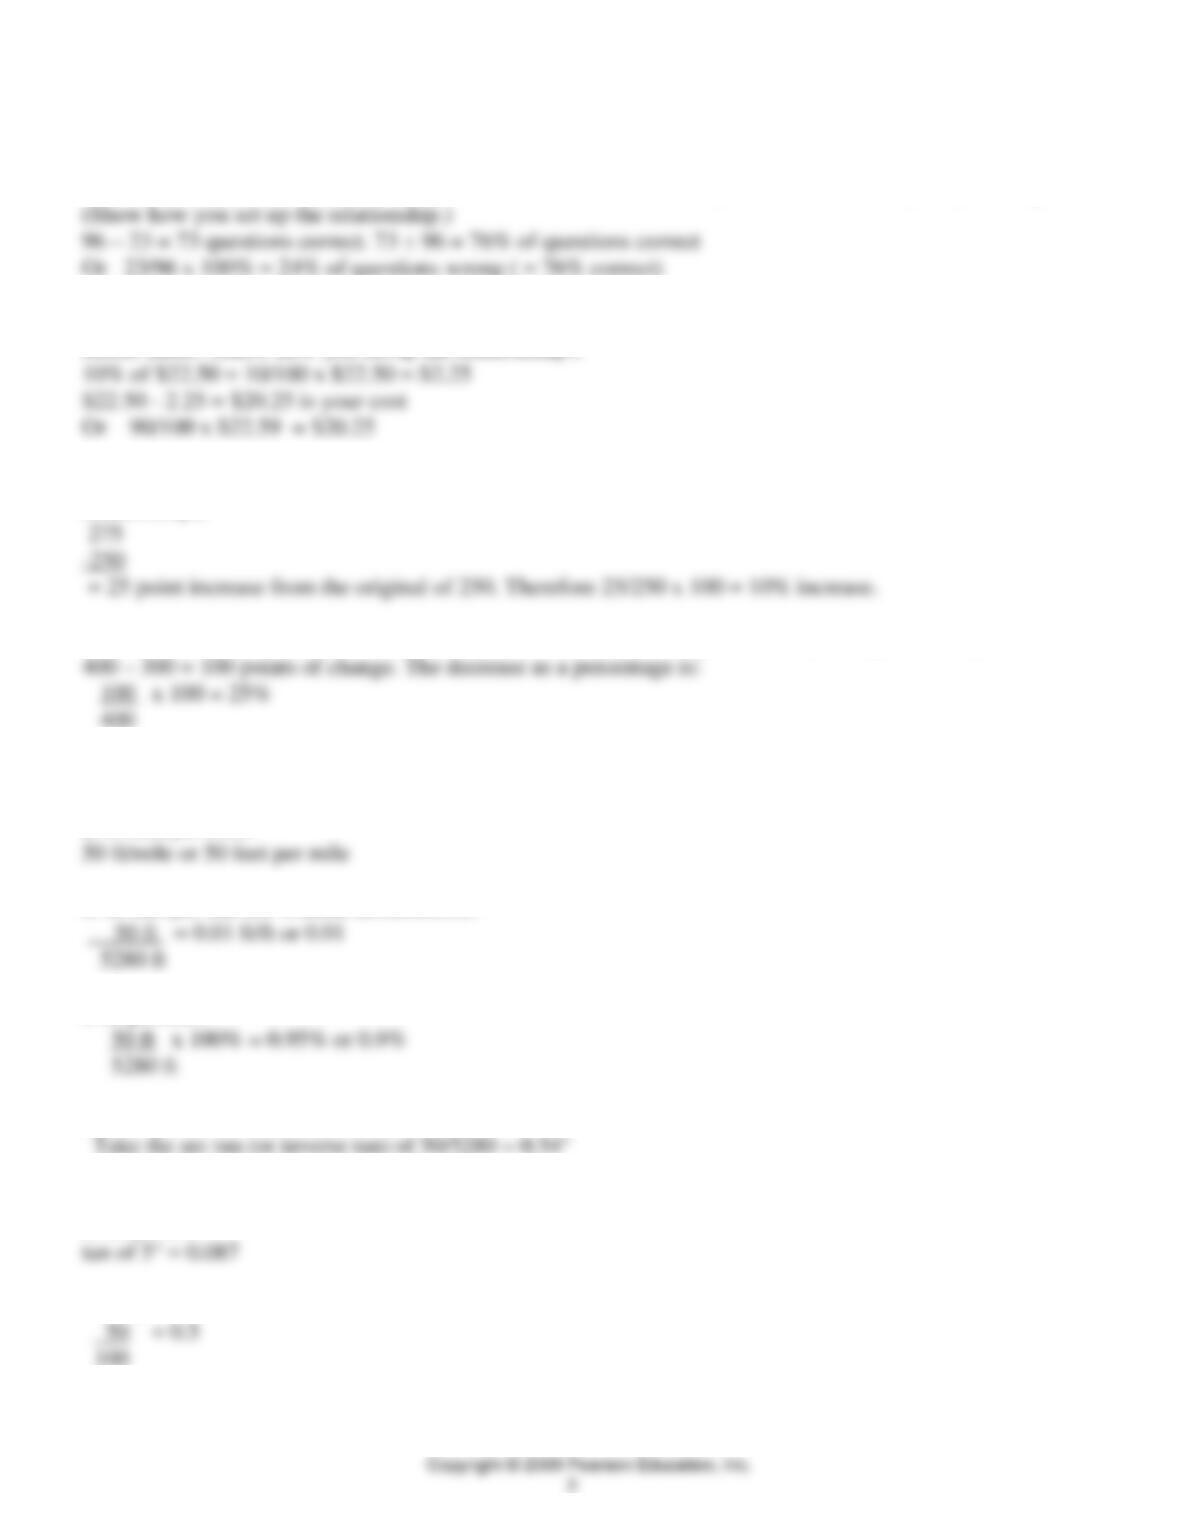
1. You had 23 questions incorrect on an exam that had a total of 96 questions. What was your percentage score?
2. You had a 10 percent deduction in the price of a book that had a list price of $22.50. What was your cost,
before taxes? (Show how you set up the relationship.)
3. Ozone levels increased from 250 to 275; what was the percentage increase? (Show how you set up the
relationship.)
4. Ozone levels decreased from 400 to 300; what was the percentage decline? (Show your work.)
5. What is the slope between two points on a map, B and S, given that B has an elevation of 150 feet and S has
an elevation of 100 feet above sea level and they are 1 mile apart?
a. In feet per mile?
b. In feet per feet (or without dimensions)?
c. In percent?
d. In degrees?
6. What is the gradient or slope of the following?
a. Slope of 5°?
b. Slope of 50%?
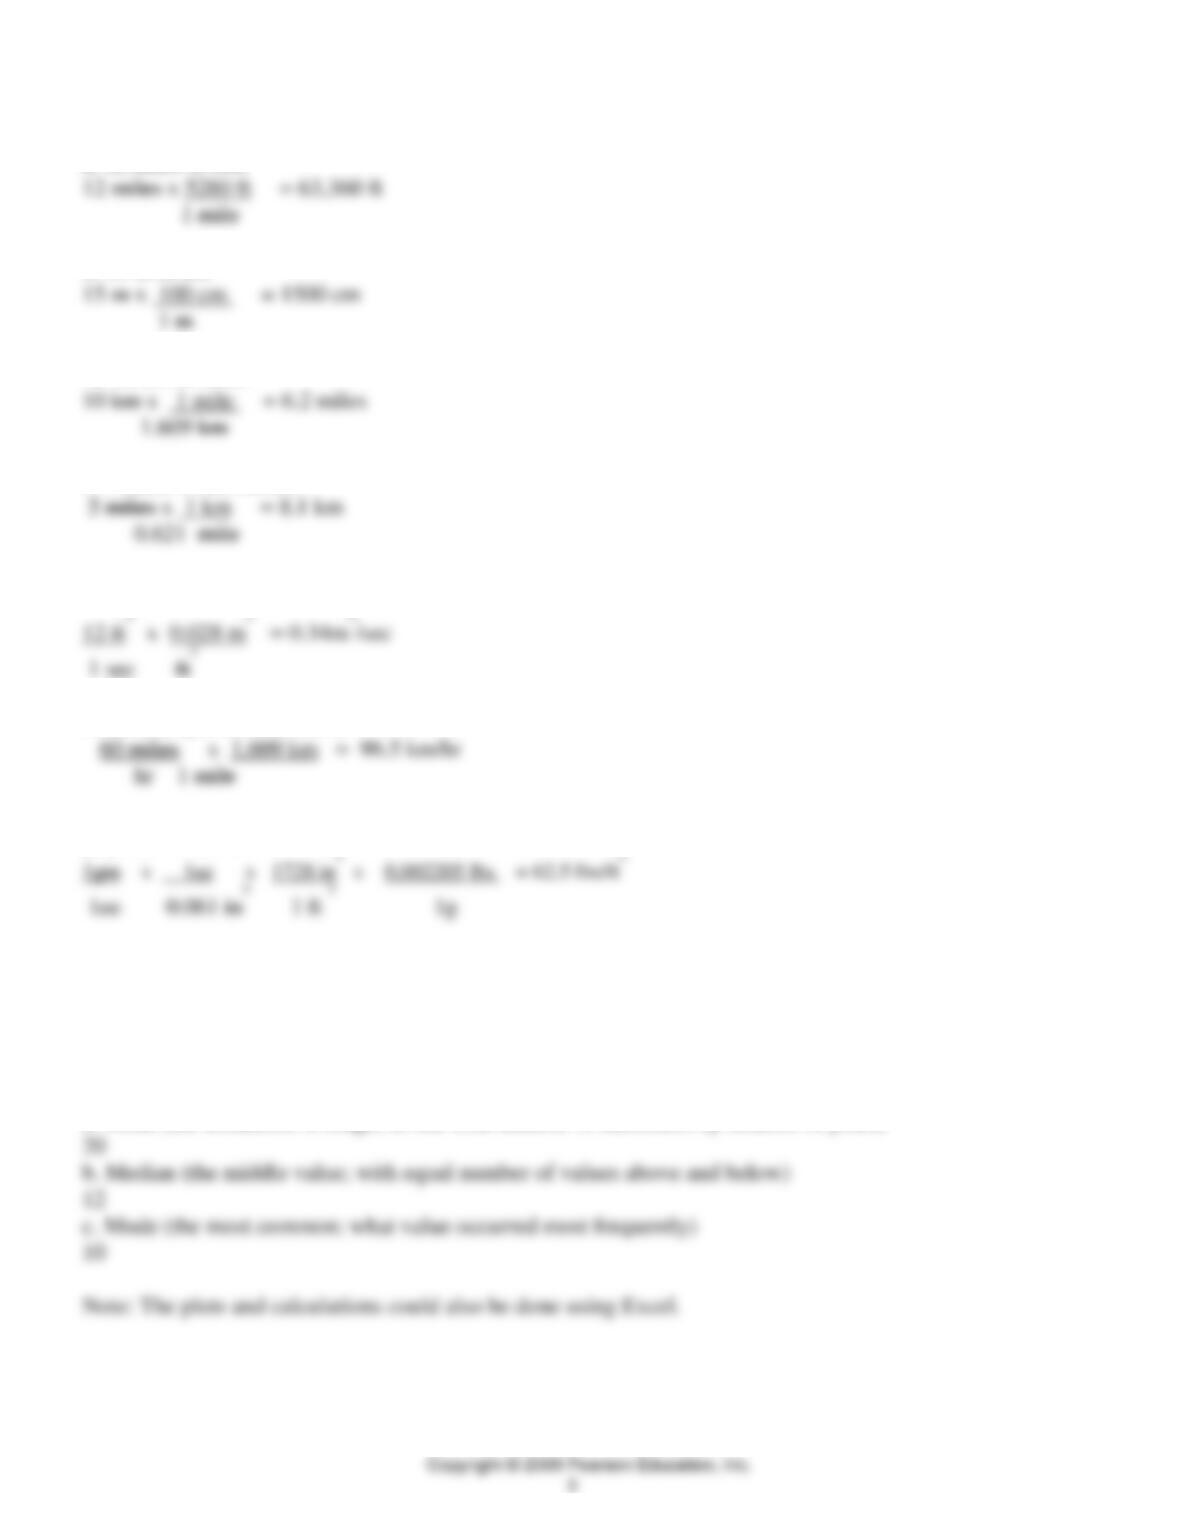
7. Convert the following, showing your work using a dimensional relationship.
a. 12 miles to feet
b. 15 m to cm
c. 10 km to miles
d. 5 miles to kilometers
e. 12 cubic feet/sec to m3 /sec
f. 60 miles per hour to km/hr
g. gm/cc to lbs/ft3
QUESTIONS 3, PART C
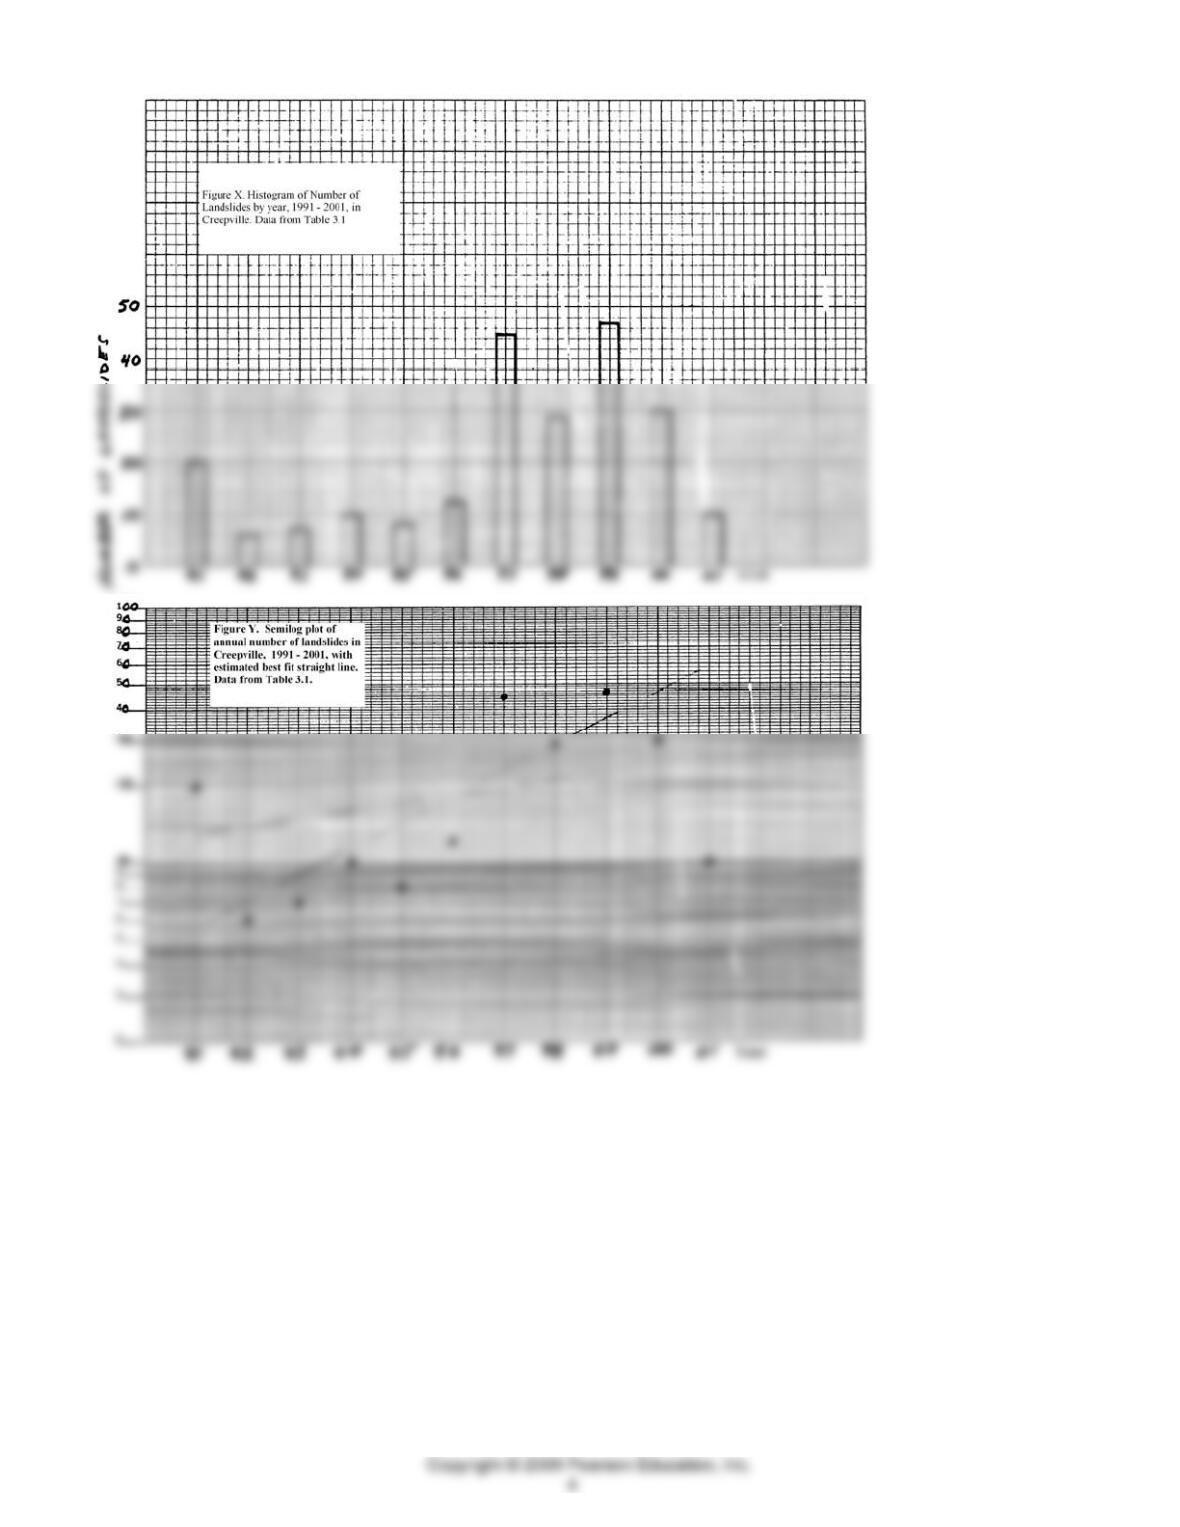
1. On the two types of graph paper provided here, plot the number of landslides by year, using the data in Table
3.1. Add captions.
See Figures X and Y below.
2. From the data in Table 3.1, determine the following for the number of landslides per year.
a. Mean (the arithmetic average; divide total number of landslides by number of years)