– 1 –
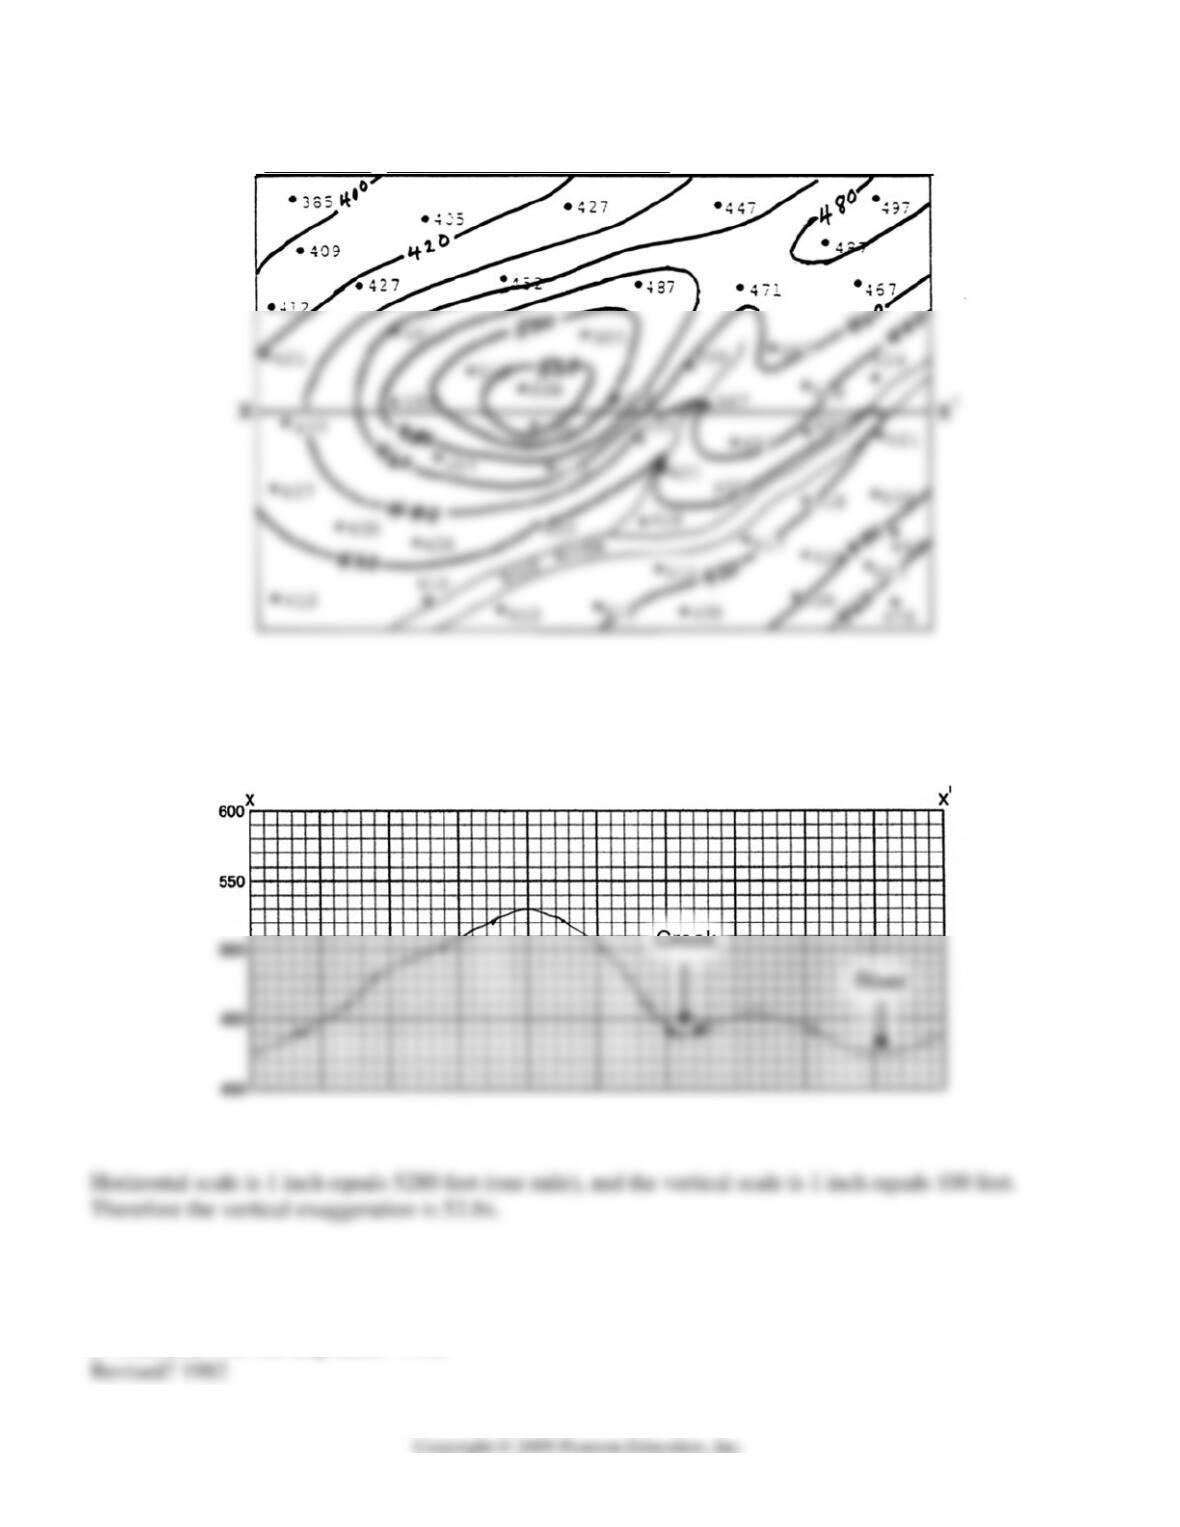
2. Construction of a Topographic Profile. State the vertical scale and vertical exaggeration in the spaces
provided.
3. Use either Figure 2.7 or a map supplied by your instructor to answer the following questions. The
answers below are based on Figure 2.7, topographic map of the Kalispell area, Montana.
a. What year was the map made? 1962
QUESTIONS 2, PART A
1. Construction of a Contour Map.

– 2 –
b. What year were the photographs taken that were used to create the map? 1956
Were later photographs also taken? If so, when? 1978
c. What are the UTM values for the southeast corner of the map? 5333600m N, 704650m E
The northing value can be determined by scaling the distance on the east side of the map between
The easting value can be determined in a similar way, but the map makes this a bit more difficult. Students
will have work eastward from the printed value of 702000mE to determine which marks on the bottom of
the map have values of 703000mE and 704000mE. The 703000mE line is just to the left of the word
d. What are the latitude and longitude values for the southeast corner of the map? 48 degrees, 07 minutes,
and 30 seconds N; 114 degrees, 15 minutes, and 00 seconds W
e. What is the scale of the map? 1:24,000 was the scale of the original map. This is an unintentional trick
question, if students note that the map in the book has been reduced. The scale of the map, as published, is
approximately 1:50,400 (one inch equals about 4200 feet).
4. True North (TN) and Magnetic North seldom are exactly the same and magnetic north changes
continually.
a. What is the mean magnetic declination on the Zanesville West, Ohio, map (Figure 10.5 in the color

– 3 –
We suggest instead that you refer to the Kalispell map, and note that at the end of 2008, the declination
was approximately 14 degrees and 55 minutes east, drifting about 0.10 degree west per year.
6. Use Figure 2.9 (inside front cover and also in the color plate section), the description of symbols used on
U.S. Geological Survey topographic maps, and Figure 2. 10, the Bloomington, Indiana, minute quadrangle
(in the color map section at the back of this book) to answer this question.
a. What is the fractional or ratio scale?
The scale of the Bloomington map has been reduced slightly to fit the book. Students can use a ruler and
the foot scale to determine that one inch is approximately 2500 feet. This means that one inch is
approximately 30,000 inches, or that the fractional scale of the map is 1:30,000.
– 4 –
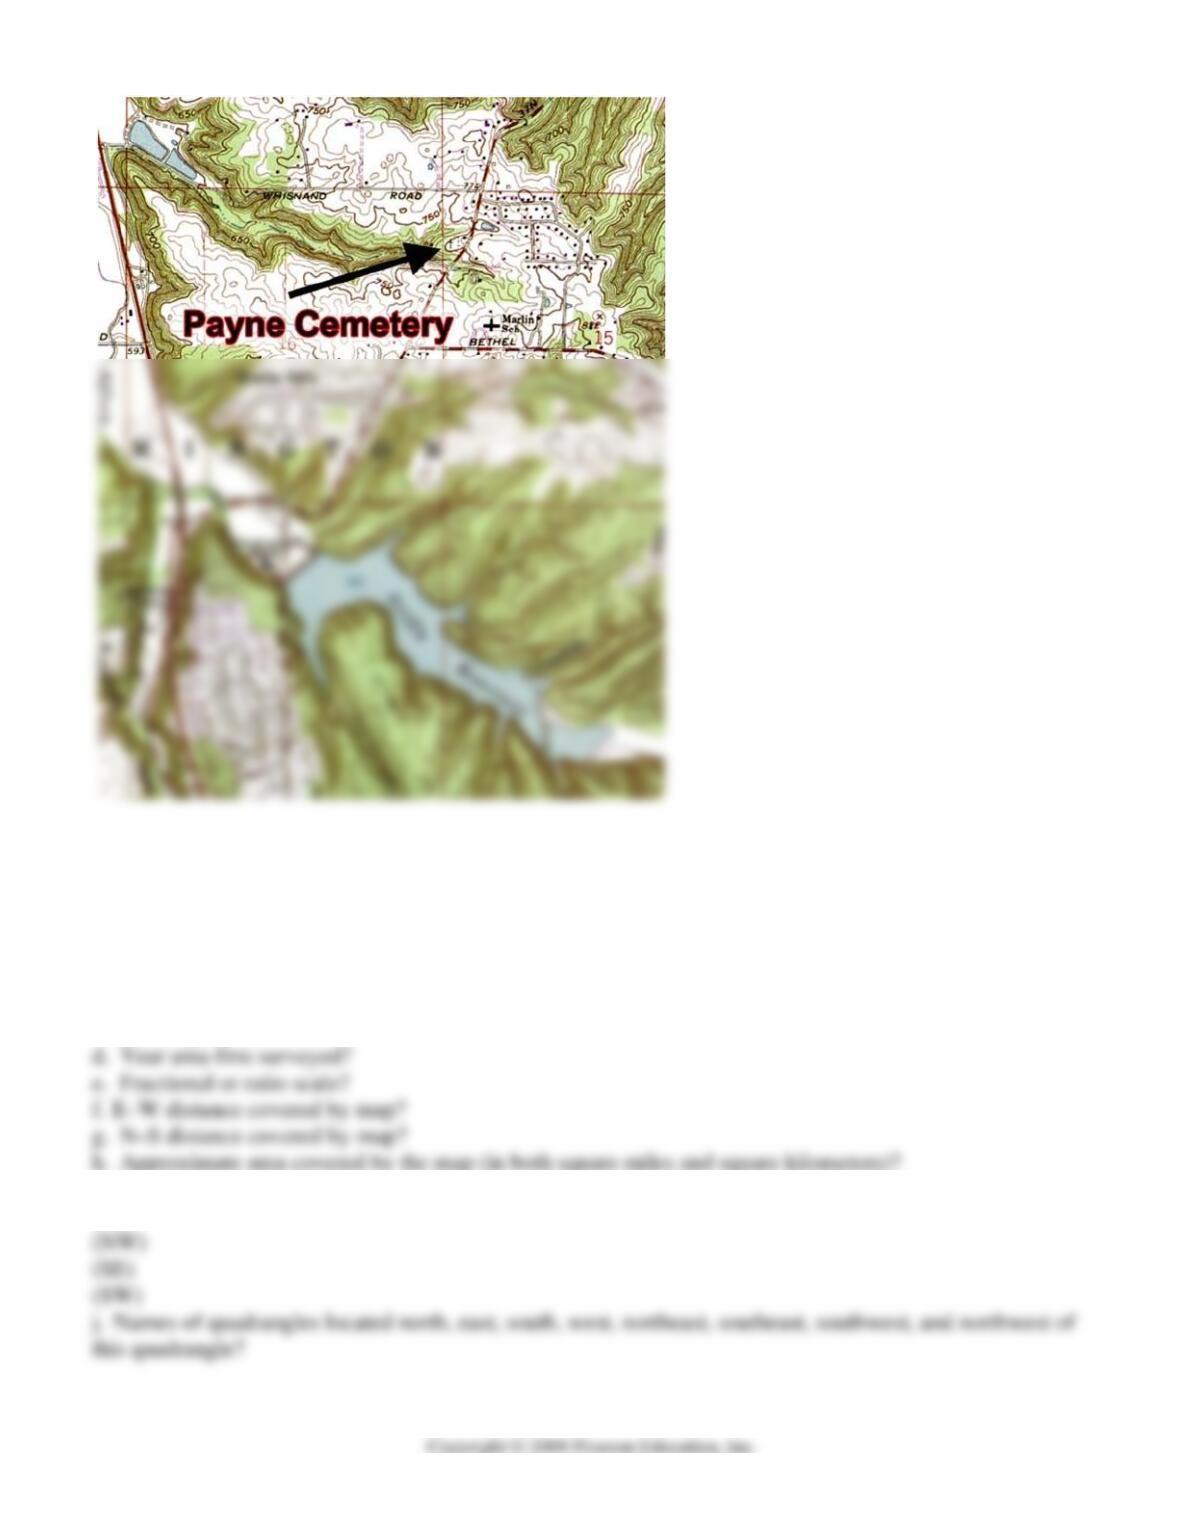
e. What is the elevation of the major contour adjacent to the cemetery?
The 750′ contour runs through the cemetery.
7. Using a topographic map of your local area (provided by your instructor), fill in the following
information:
a. Name of the map?
b. Contour interval?
c. Datum plane?
i. Latitude and longitude of the northeast, northwest, southeast, and southwest corners of the map?
(NE)
– 5 –
k. Note the variety of symbols used on the map. Find examples of each of the following and give its
location by either latitude and longitude coordinates or by township, range, section, and quarter-section
locations. Also note the relationship to major features or to the general area covered.
QUESTIONS 2, PART B
1. Using Table 2.1 and the explanation for Figure 2.11, give the words for the following
symbols: pCm – middle Precambrian
2. What is the age in millions of years of the boundary between the Cambrian and the Precambrian (Hint:
3. Almost all of the Precambrian rocks are metamorphic or igneous?
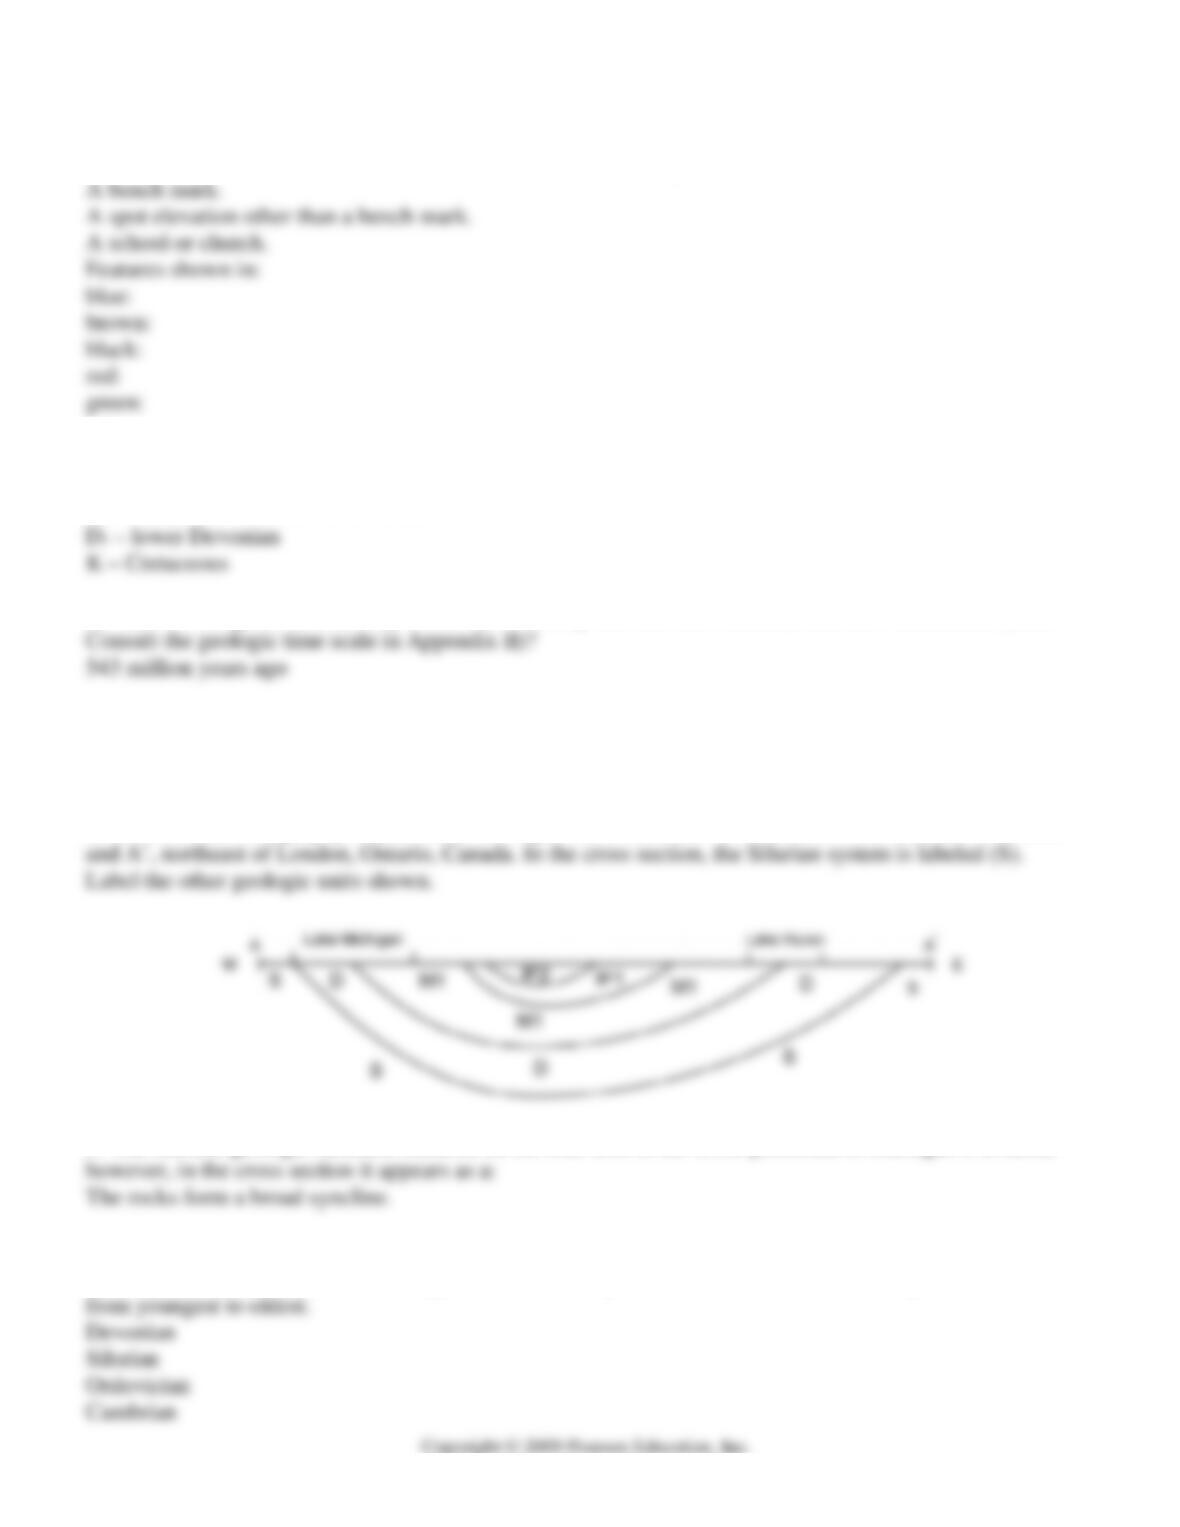
4. The geologic cross section (Figure 2.12) for the bedrock geology map of central North America (Figure
2.11) shows the stratigraphy of part of the Michigan Basin between A, northwest of Milwaukee, Wisconsin
5. The circular geologic structure centered on the blue area in the lower peninsula of Michigan is a basin;
6. If you drilled a hole at the “D” north of Milwaukee, what geologic systems would you pass through
before you reached the Precambrian igneous or metamorphic basement rocks? List the sequence of rocks
– 6 –
Copyright © 2009 Pearson Education, Inc.
7. Which of the following cities is underlain by the oldest bedrock? (check one)
QUESTIONS 2, PART C
Meteor Crater
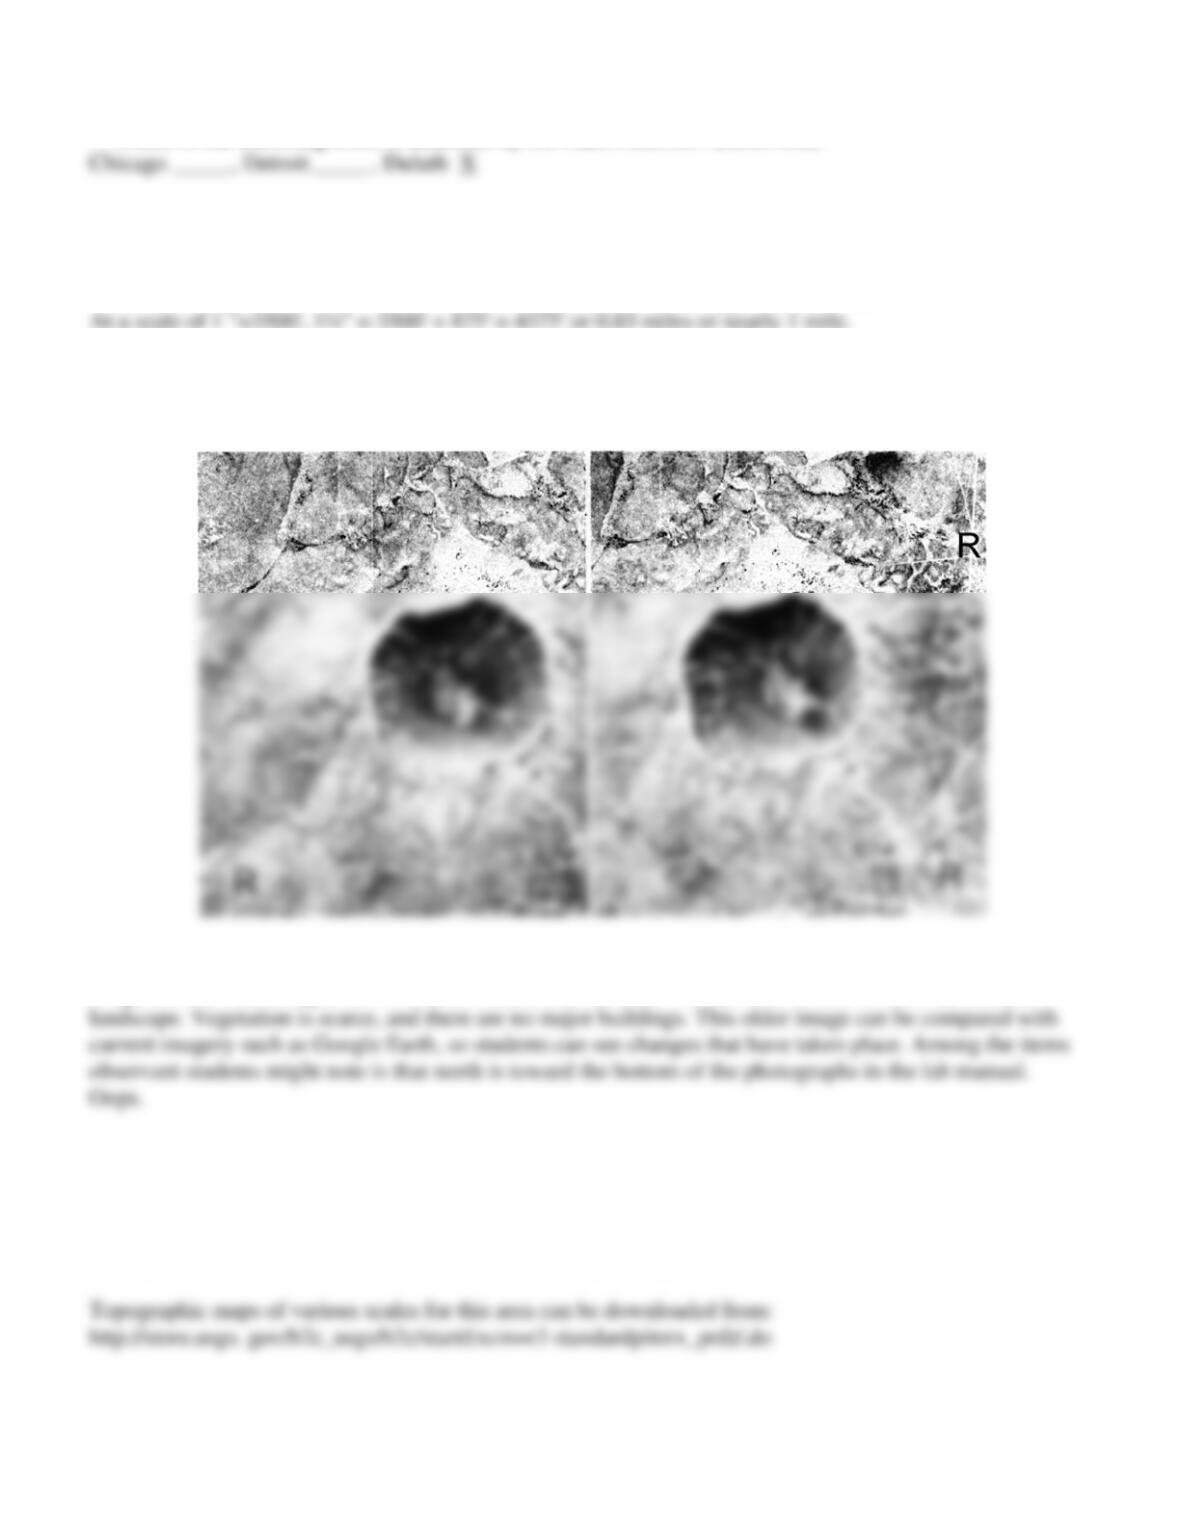
1. Examine Figure 2.13. Given the scale in the caption, what is the approximate diameter of the crater?
2. Using a stereoscope to see the third dimension in Figure 2.13, outline the floor of the crater and mark
the lowest point with an “L.”
3. On Figure 2.13, label any other visible relief features, vegetation, roads and buildings. See above
image. In this older image, there are a few roads, marked with “R,” that form linear features across the
Boston
The following questions refer to Figure 2.14, which is in the color map section at the back of this book. If
available, using Google Earth or a similar program may help students visualize the Boston area. Note that
photographs of many of these sites are available through Google Earth (or at other sites on the internet).

– 7 –
Study the color high altitude photograph (Figure 2.14) using a magnifying glass or hand lens if necessary to
identify geologic and cultural features. Label the following features on the photo, using the corresponding
numbers 1–15.
1. park
2. airport runway
7. road
8. bridge
9. railway
10. pond
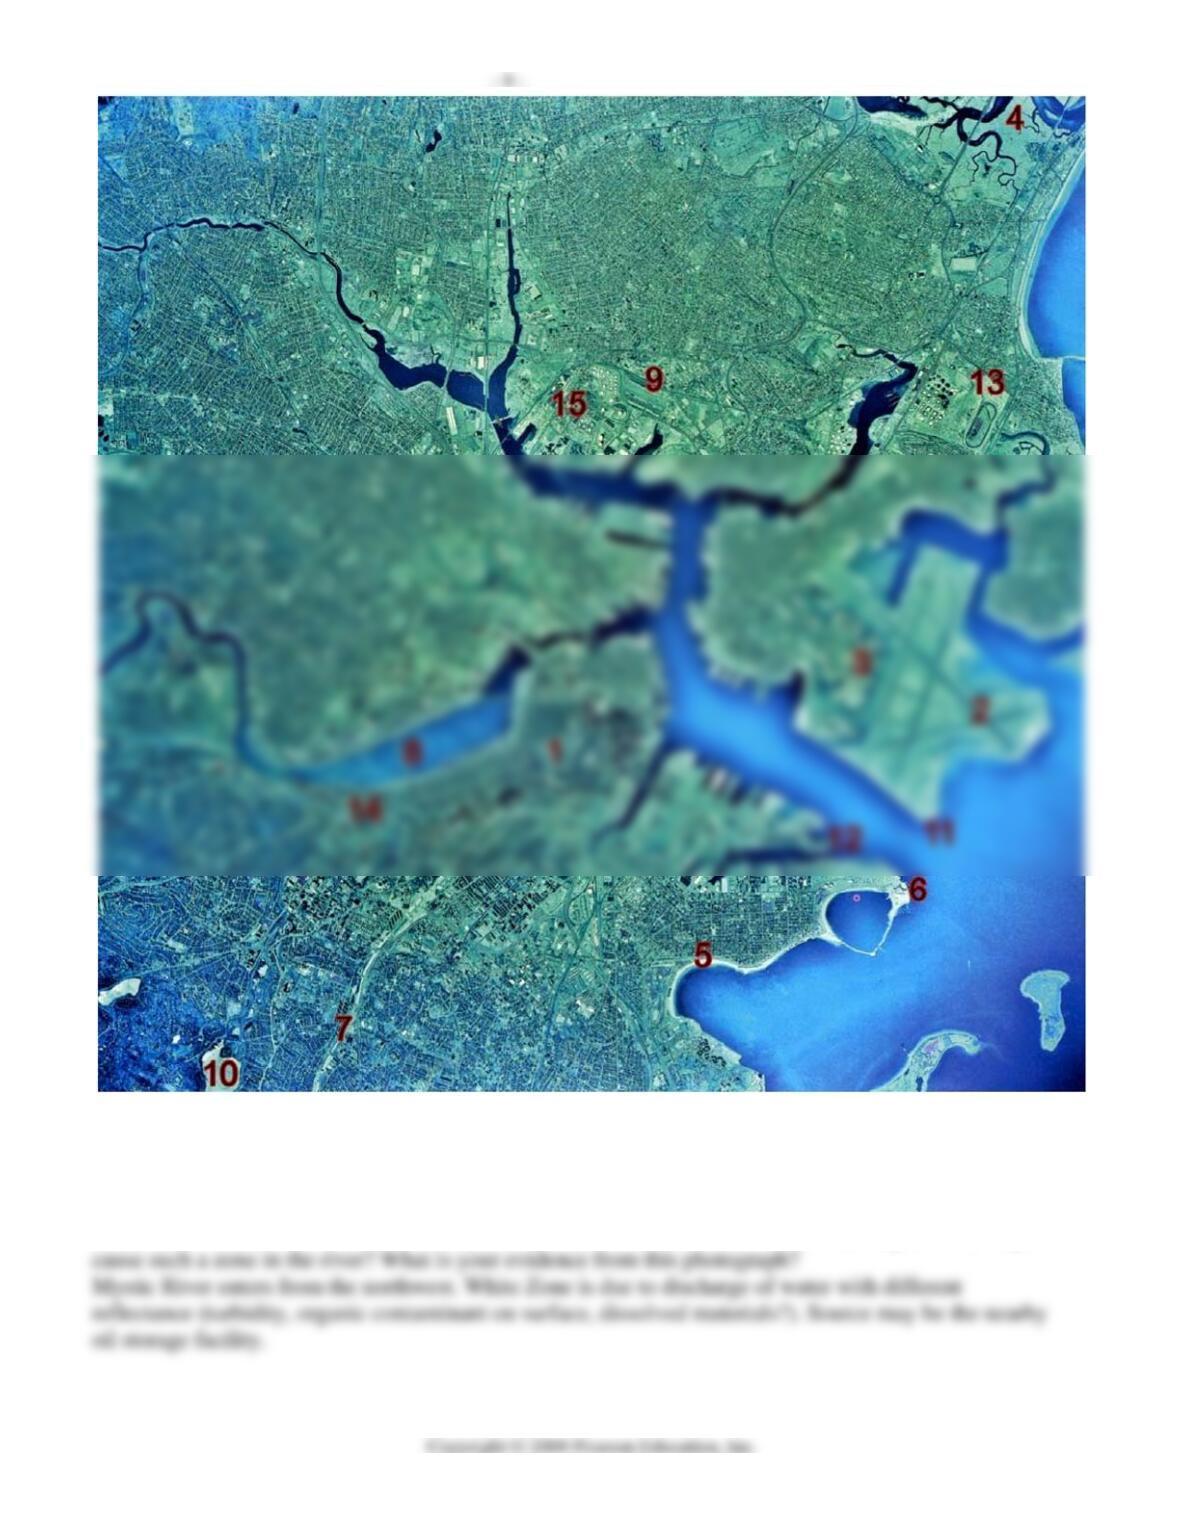
5. In which direction is the small boat traveling at the entrance to Boston Inner Harbor?
Northwest
6. Notice the diffuse white zone in the Mystic River, between the first and second bridges. What might

8. The L Street Beach, which is located west of the circular bay in the SE quarter of the image, has
9. Many elongated hills in this glaciated landscape have influenced street patterns. In the NE quarter of
the photograph is Suffolk Downs Racetrack.
Suffolk Downs Racetrack is number 13 on the image above.
What is the direction of elongation (which gives the ice-flow direction) and the name of the landforms
10. If the long axis of Suffolk Downs is 650 m (2100 ft), what is the scale of the photograph?
1 cm = 650m; scale = 1:65,000 or 3/8″ = 2100 ft; 1″ = 67,200″; scale = 1:67,200″
Salt Lake City, Utah
The following questions refer to Figures 2.14 and 2.16. Figure 2.15 is a black and white stereo pair of aerial
photographs taken of the Salt Lake City area in 1958. Figure 2.16 (back of book) shows color aerial stereo
photographs of an area south of the black and white photographs. The color stereo photographs were taken
12. Using a pocket stereoscope, examine the stereo pair in Figure 2.15 to determine the nature of the
landscape. The shades of gray indicate vegetation or soil moisture differences. Identify a feature that
13. Identify the natural or built feature at each of the following sites on Figure 2.15: Most can be
identified without the stereoscope.
The top of the image is to the north. There is no “L.”
A. Race track

– 10 –
E. Orchard
F. Gravel pit
M. Woods
14. What land uses are visible in the 1958 stereopair (Figure 2.15)? Are other land uses visible on the
1992 photographs (Figure 2.16)?
15. Use the definitions provided below to help determine in which geomorphic feature site “J” (Figure
2.15) is located. What is your evidence?
16. a. In Figure 2.15 what is the distance between the middle of the G to the middle of the H? 45 mm
b. Given that the scale of the photo is 1:14,400, what is the distance on the ground between G and H? 0.65
17. Compare similar features on the black and white stereo photographs (Figure 2.15) with those on the
color stereo photographs (Figure 2.16).
a. Are the two sets of photographs the same or different scales? What is your evidence? Students
might note that roads appear slightly wider in the black and white photos, which suggests that they are at a
b. What are some advantages of using color stereo photographs over using black and white stereo
photographs?
differences in rock types are more visible.
c. What are some advantages (if any) of using black and white photographs over color photographs?
San Francisco, California

– 11 –
San Francisco, California
Figure 2.17 is on the back cover of the lab manual.
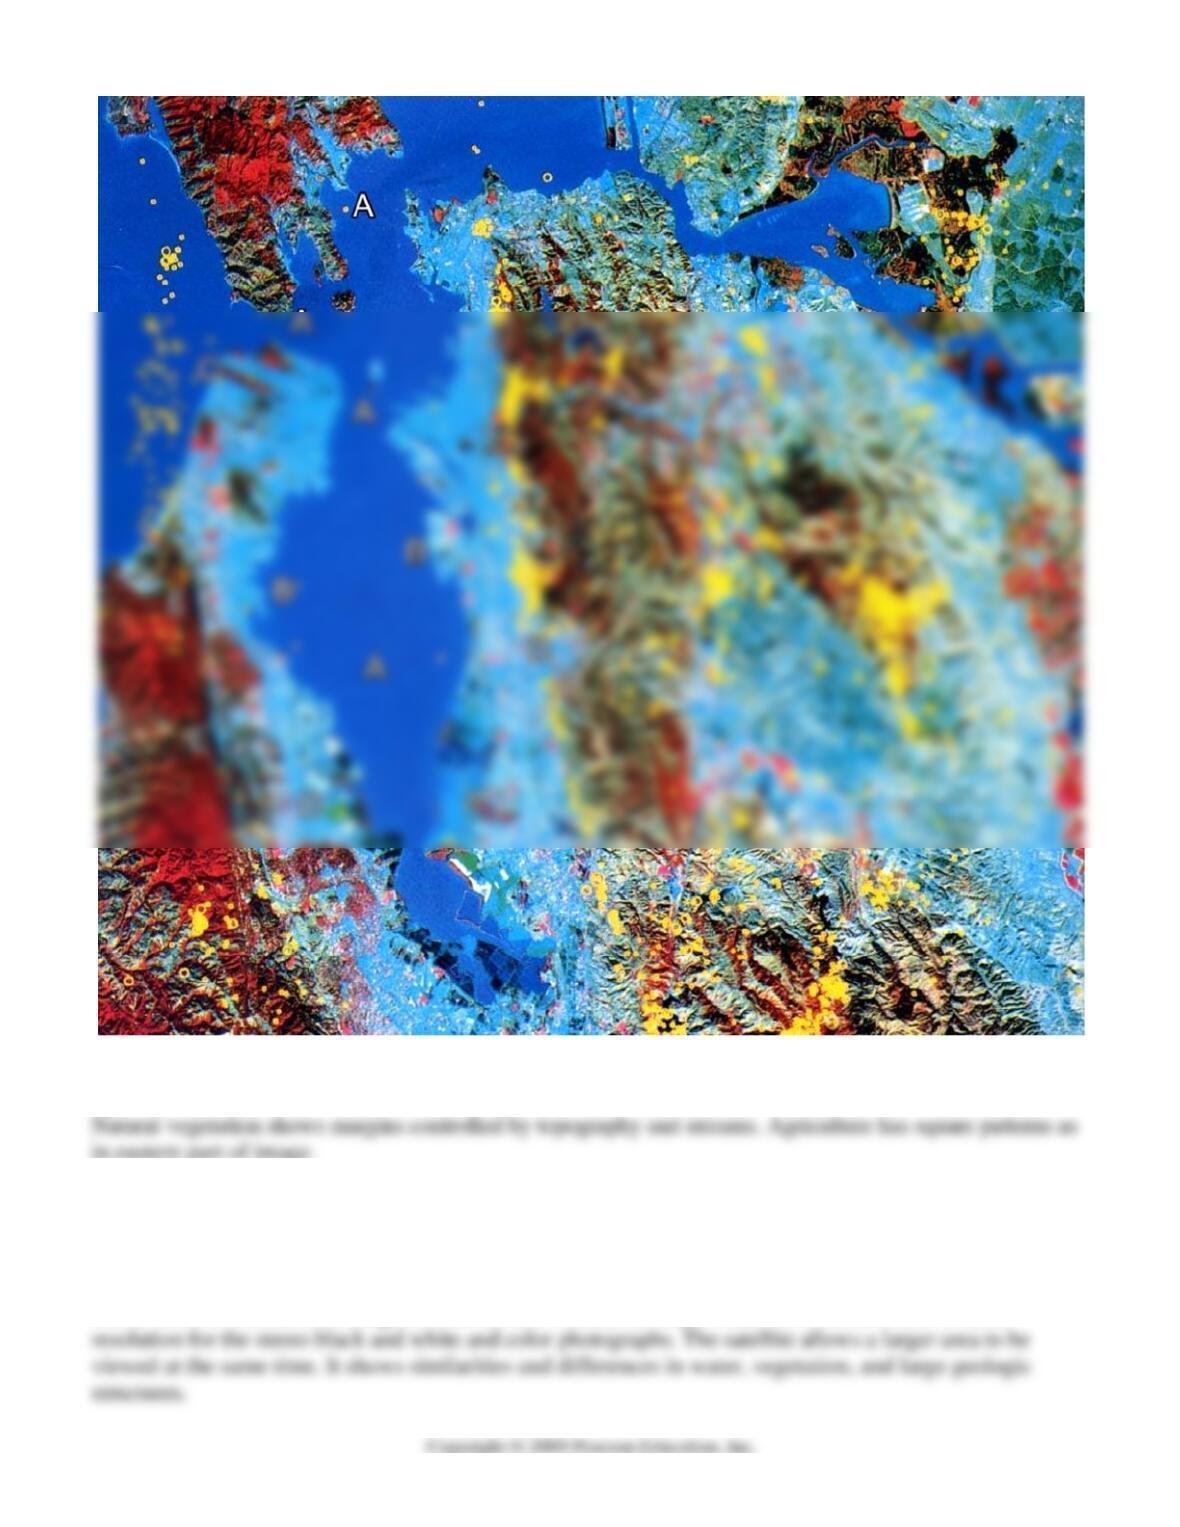
18. Locate examples of the following land uses on the satellite image. Mark these features and a north
arrow on the outline map of the San Francisco Bay area (Figure 2.18):
The north arrow is given on the figure.
– 12 –
19. What pattern differences help distinguish natural vegetation areas from vegetation patterns in
agricultural areas?
20. Compare natural and human features on this satellite image with those on the black and white and color
stereo photographs. What are some of the advantages and disadvantages of using satellite images rather than
aerial photographs in environmental studies? Under what conditions do you think that satellite images
might be especially useful?
At the scale of this satellite image, houses are not visible, but major roads are visible. There is better

– 13 –
21. What are the kinds of features that can more easily be seen on the LIDAR image than on the
topographic map? Which of these features are natural and which are related to human activity? What is
your evidence?
The general trend of topography (in this case, drumlins from the last glaciations) is more immediately
22. What are the kinds of features that can more easily be seen on the topographic map than on the
LIDAR image?
23. How does having a topographic map help interpret human-related features on a LIDAR image? When
looking for natural features, such as a fault (see Figure 6.14 on page 99 for another LIDAR example),
24. When would the use of each type of map be an advantage? A disadvantage?
Want to know the lay of the land, especially when the area is heavily forested? Use LIDAR. Want to