89
Chapter 6
MANAGING CASH FLOW
FOCUS
In this chapter, we focus on short-term financial planning involving projecting monthly financial
statements for one year or less. The availability of cash is what drives the entrepreneurial
venture. Inadequate cash often constrains the venture’s ability to grow, is a primary cause of
financial distress, and can result in bankruptcy even though the venture may be profitable in an
LEARNING OBJECTIVES
LO 6.1: Describe the types of financial planning needed at various stages in a venture’s life
cycle.
LO 6.2: Explain why cash is so important in early-stage ventures.
CHAPTER OUTLINE
6.1 FINANCIAL PLANNING THROUGHOUT THE VENTURE’S LIFE CYCLE
6.2 SURVIVING IN THE SHORT RUN
6.3 SHORT-TERM CASH-PLANNING TOOLS
6.4 PROJECTED MONTHLY FINANCIAL STATEMENTS
DISCUSSION QUESTIONS AND ANSWERS
1. What does short-term financial planning involve?
Short-term financial planning usually involves projecting monthly financial statements and
Chapter 6: Managing Cash Flow
90
2. Provide a description of the financing cost implications associated with a venture’s need for
additional funds.
The cost of obtaining additional funds may be explicit, such as additional interest expense
associated with debt. Interest expense shows up directly on the projected income statement
3. What is meant by a cash budget? Describe how a cash budget is prepared.
A cash budget is a financial tool showing the inflows and outflows of the firm’s cash balance
4. Besides the cash budget, what additional financial statements are projected monthly in
conjunction with short-term financial planning?
Additional statements that can be prepared on a monthly basis to provide a clear financial
1. What is meant by a venture’s operating cycle?
A venture’s operating cycle is the time it takes to purchase raw materials, assemble a product, book a
sale, and collect on it.
2. Describe the cash conversion cycle (C3).
3. What are the three components of the cash conversion cycle (C3)? How is each component
calculated?
The three components of the cash conversion cycle are inventory-to-sale conversion period, sales-to–
cash conversion period, and purchase-to-payment conversion period. The inventory-to–sale
4. Briefly explain how changes in the conversion times of the components of the C3 can be interpreted.
A lengthening of the inventory-to-sale conversion period indicates less efficient inventory
management. A lengthening of the sale-to–cash conversion period indicates less efficient collections
Chapter 6: Managing Cash Flow
91
9. From the Headlines – Sustainable Northwest: Describe Sustainable Northwest’s short-term
inflows and outflows of cash. What would you expect to be the main ingredients of each part
of the cash conversion cycle?
Sustainable Northwest is a nonprofit organization with a for-profit wholesale lumberyard
INTERNET ACTIVITIES
EXERCISES/PROBLEMS AND ANSWERS
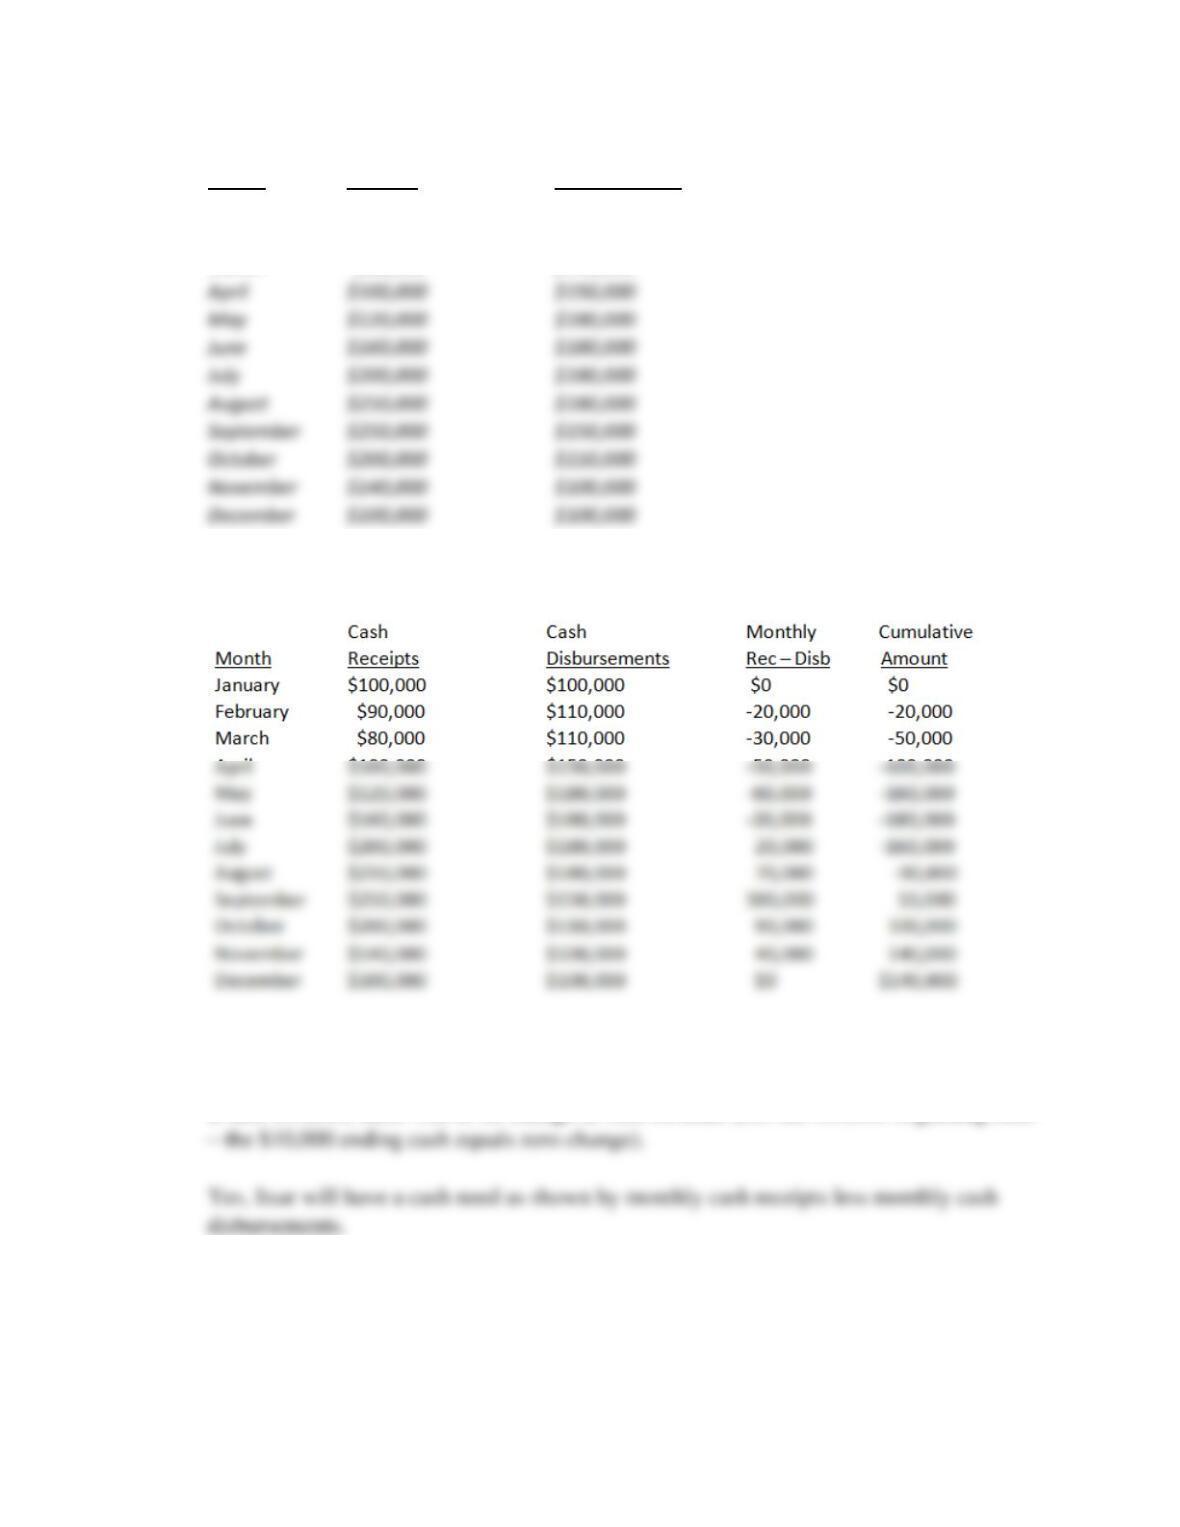
1. [Short-Term Financial Planning] The Itsar Products Company has made the following
monthly estimates of cash receipts and cash disbursements when preparing cash budgets for
the next twelve months. Itsar Products has beginning cash on hand of $10,000 and wants to
maintain this minimum cash level throughout the next year.
Chapter 6: Managing Cash Flow
92
Cash Cash
Month Receipts Disbursements
January $100,000 $100,000
February $90,000 $110,000
March $80,000 $110,000
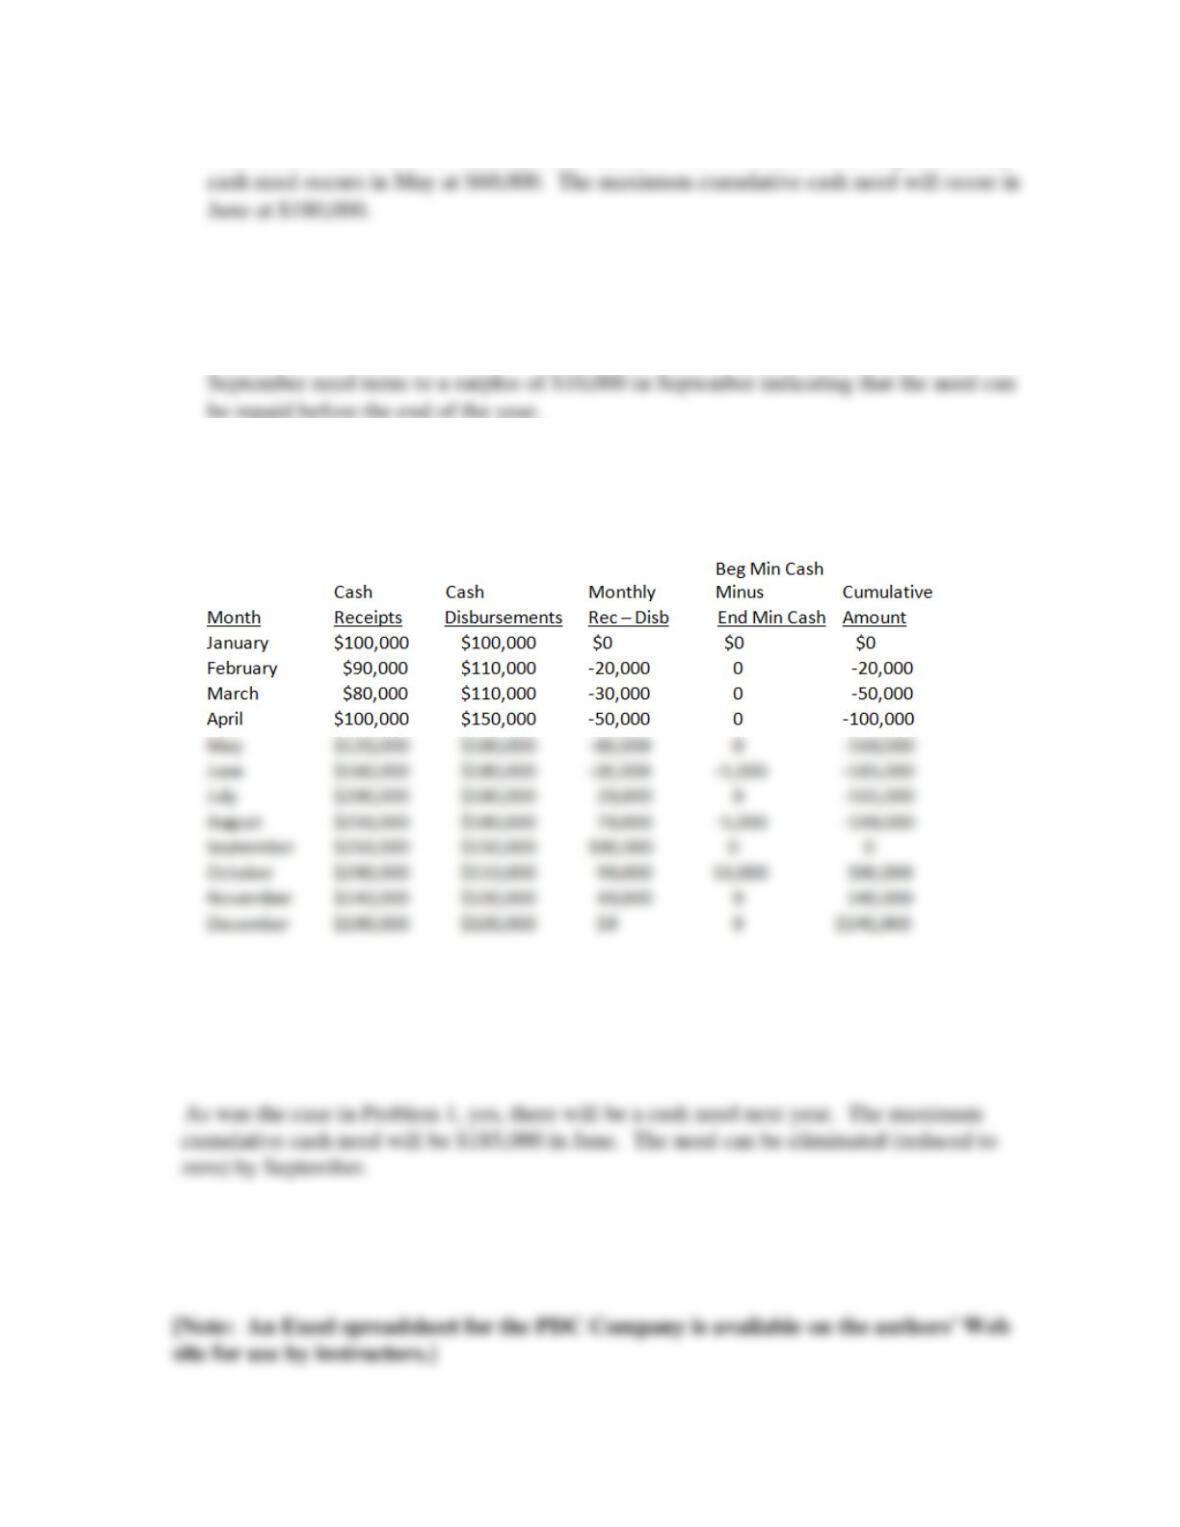
A. Determine whether Itsar Products will have a cash need during the next year.
Note: the January beginning cash on hand is $10,000. Since the minimum end of cash
month
B. If Itsar Products has a cash need, indicate the month when the need will begin and
determine the month and amount when the maximum need will occur.
Chapter 6: Managing Cash Flow
93
A cash need will occur in February when $20,000 will be needed. The largest monthly
C. Determine whether the cash need (if any) can be repaid within the next year.
As previously noted, a cash need of $20,000 occurs in February and increases to a
maximum cumulative monthly cash need of $180,000 in June. The cumulative
2. Rework Problem 1 assuming minimum cash on hand requirements are $10,000 a month
through May, increase to $15,000 in June and July, increase further to $20,000 in August
and September, and return to the $10,000 per month level beginning in October.
Note: Beginning cash on hand for January was $10,000. Since the target ending cash on
hand amount also was $10,000, there was no change in monthly cash on hand need. In
June, the beginning cash on hand was $10,000; however, the target ending cash on hand was
$15,000, which meant that an additional $5,000 ($10,000 – $15,000) was needed.
3. [Short-Term Financial Planning] The PDC Company was described during the early part of
this chapter. Refer to the PDC Company’s projected monthly operating schedules in Table
6.2. PDC’s sales are projected to be $80,000 in September 2020.
Chapter 6: Managing Cash Flow
94
A. Prepare PDC’s sales schedule, purchases schedule, and the wages schedule for August
2020.
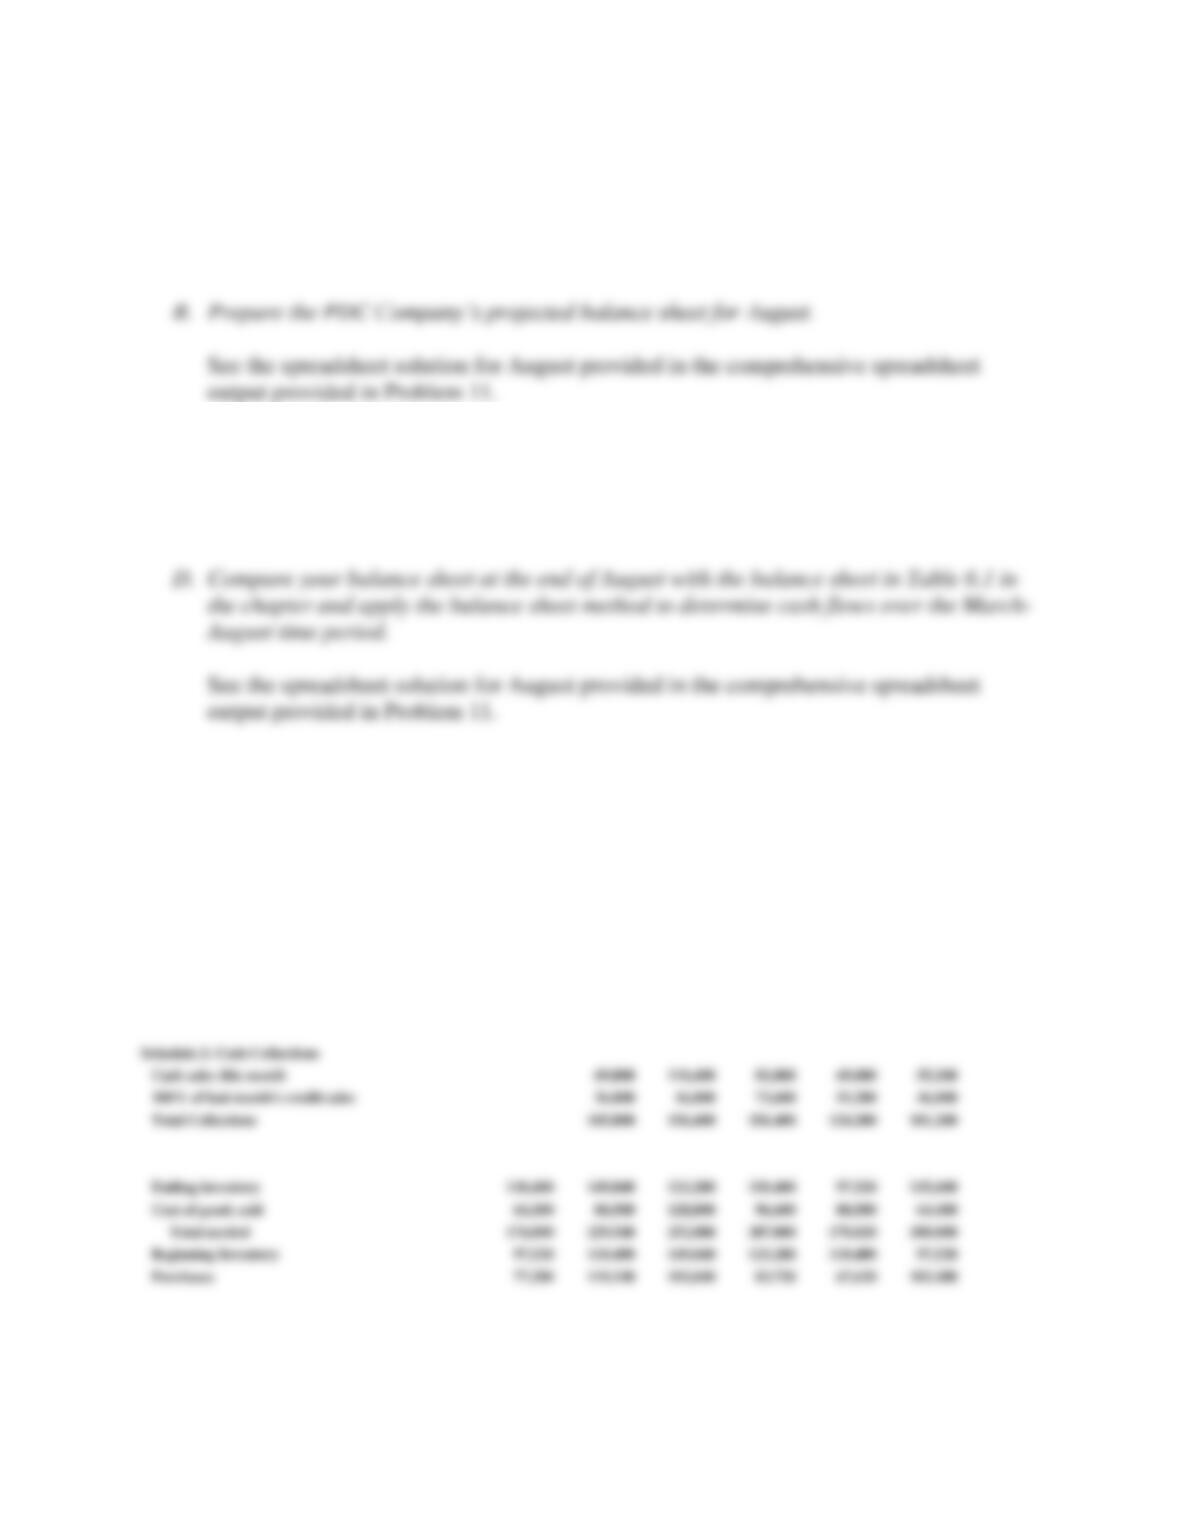
See the spreadsheet solution for Problem 11. Here we are focusing just on projecting the
month of August.
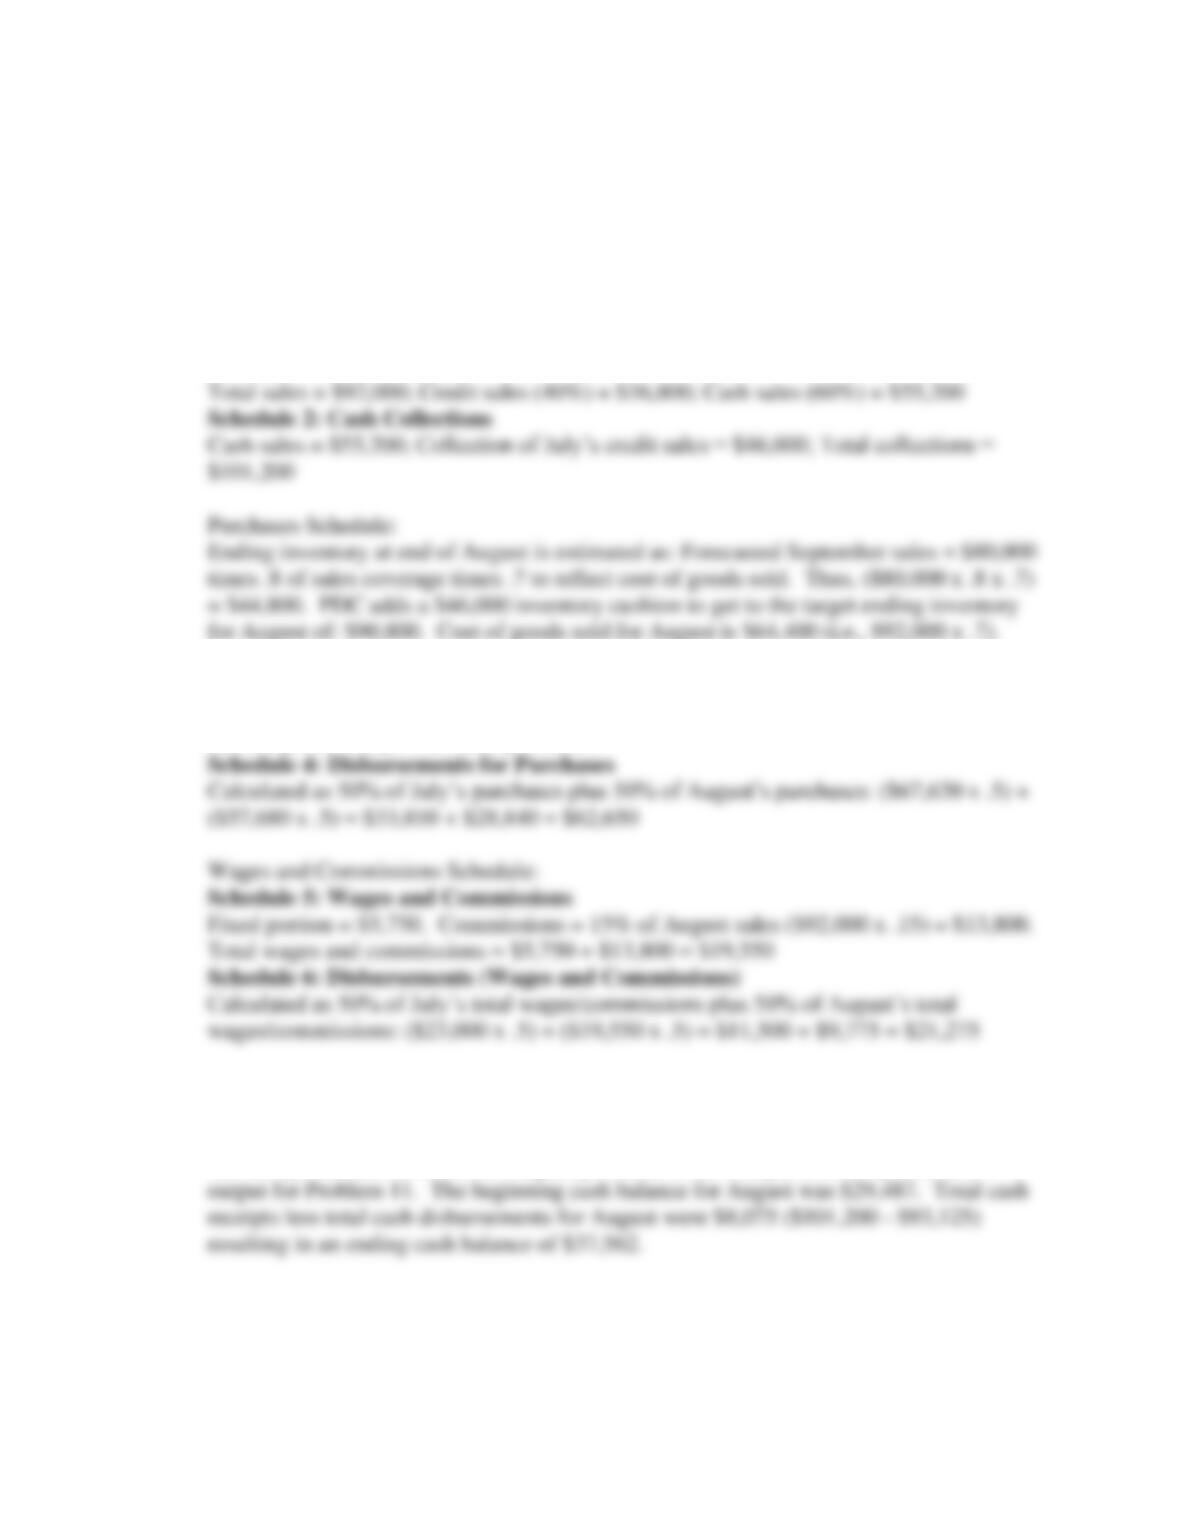
Sales Schedule:
Schedule 1: Sales Forecast
Total inventory needed is $90,800 + $64,400 = $155,200
Schedule 3: Purchases
$155,200 total inventory needed minus $97,520 beginning inventory (i.e., ending
inventory from July) = $57,680 purchases
B. Prepare a cash budget for August 2020 for the PDC Company and describe how the
forecast affects the end-of-month cash balance.
See the spreadsheet solution for August provided in the comprehensive spreadsheet
4. [Short-Term Financial Planning] The PDC Company was described during the early
part of this chapter. Refer to the PDC Company’s projected monthly operating schedules
in Table 6.2. PDC’s sales are projected to be $80,000 in September 2020.
Chapter 6: Managing Cash Flow
95
A. Prepare the PDC Company’s projected income statement for August.
See the spreadsheet solution for August provided in the comprehensive spreadsheet
output provided in Problem 11.
C. Prepare the PDC Company’s projected statement of cash flow for August.
See the spreadsheet solution for August provided in the comprehensive spreadsheet
output provided in Problem 11.
5. [Short-Term Financial Planning] Rework Problem 3 based on the assumption that, because
of an unexpected order, the PDC Company’s sales are forecasted to be $160,000 for
September 2020.
March April May June July Aug. Sept.
Schedule 1: Sales Forecast 92,000 115,000 184,000 138,000 115,000 92,000 160,000
Credit sales, 40% 36,800 46,000 73,600 55,200 46,000 36,800
Cash sales, 60% 55,200 69,000 110,400 82,800 69,000 55,200
Chapter 6: Managing Cash Flow
96
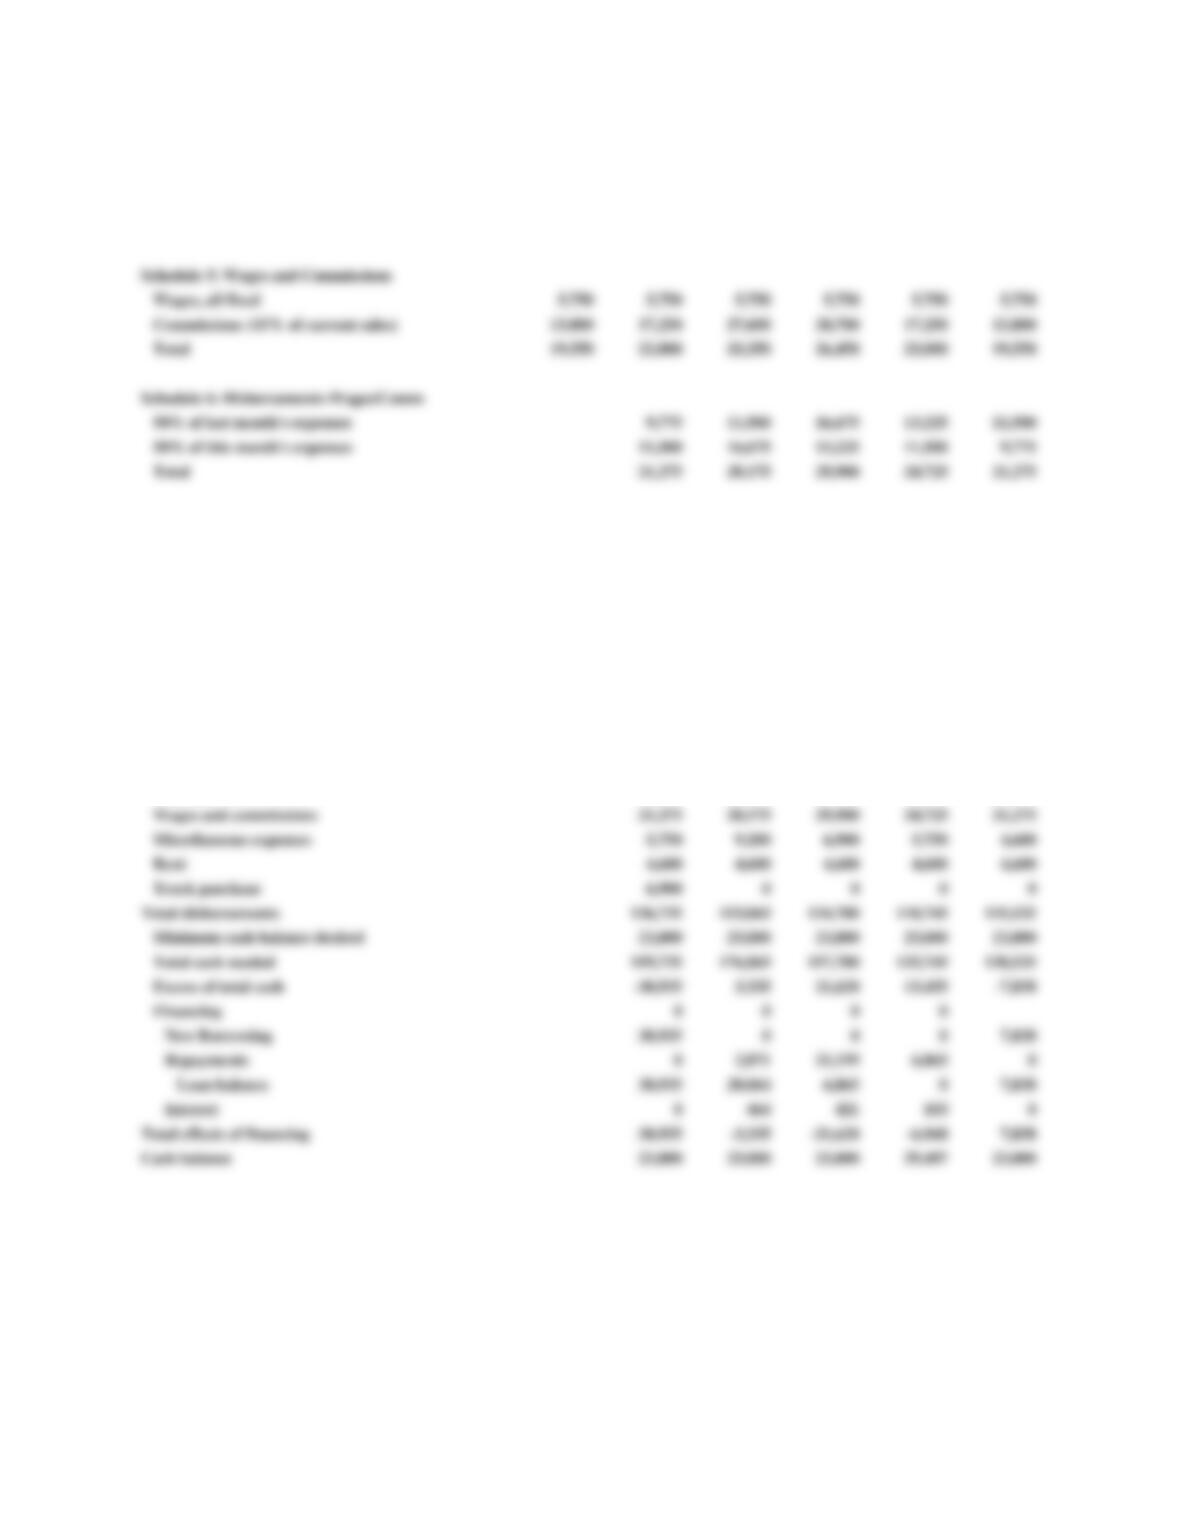
Schedule 4: Disbursements for Purchases
50% of last month’s purchases 38,640 59,570 51,520 41,860 33,810
50% of this month’s purchases 59,570 51,520 41,860 33,810 51,240
Disbursements for merchandise 98,210 111,090 93,380 75,670 85,050
Cash Budget April May June July Aug.
Beginning cash balance 23,000 23,000 23,000 23,000 29,487
Cash receipts 0 0 0 0
Collections from customers 105,800 156,400 156,400 124,200 101,200
Total cash available for needs, before fin. 128,800 179,400 179,400 147,200 130,687
Cash disbursements: 0 0 0 0
Merchandise 98,210 111,090 93,380 75,670 85,050
Chapter 6: Managing Cash Flow
97
6. [Short-Term Financial Planning] Rework Problem 4 based on the assumption that, because
of an unexpected order, the PDC Company’s sales are forecasted to be $160,000 for
September 2020.
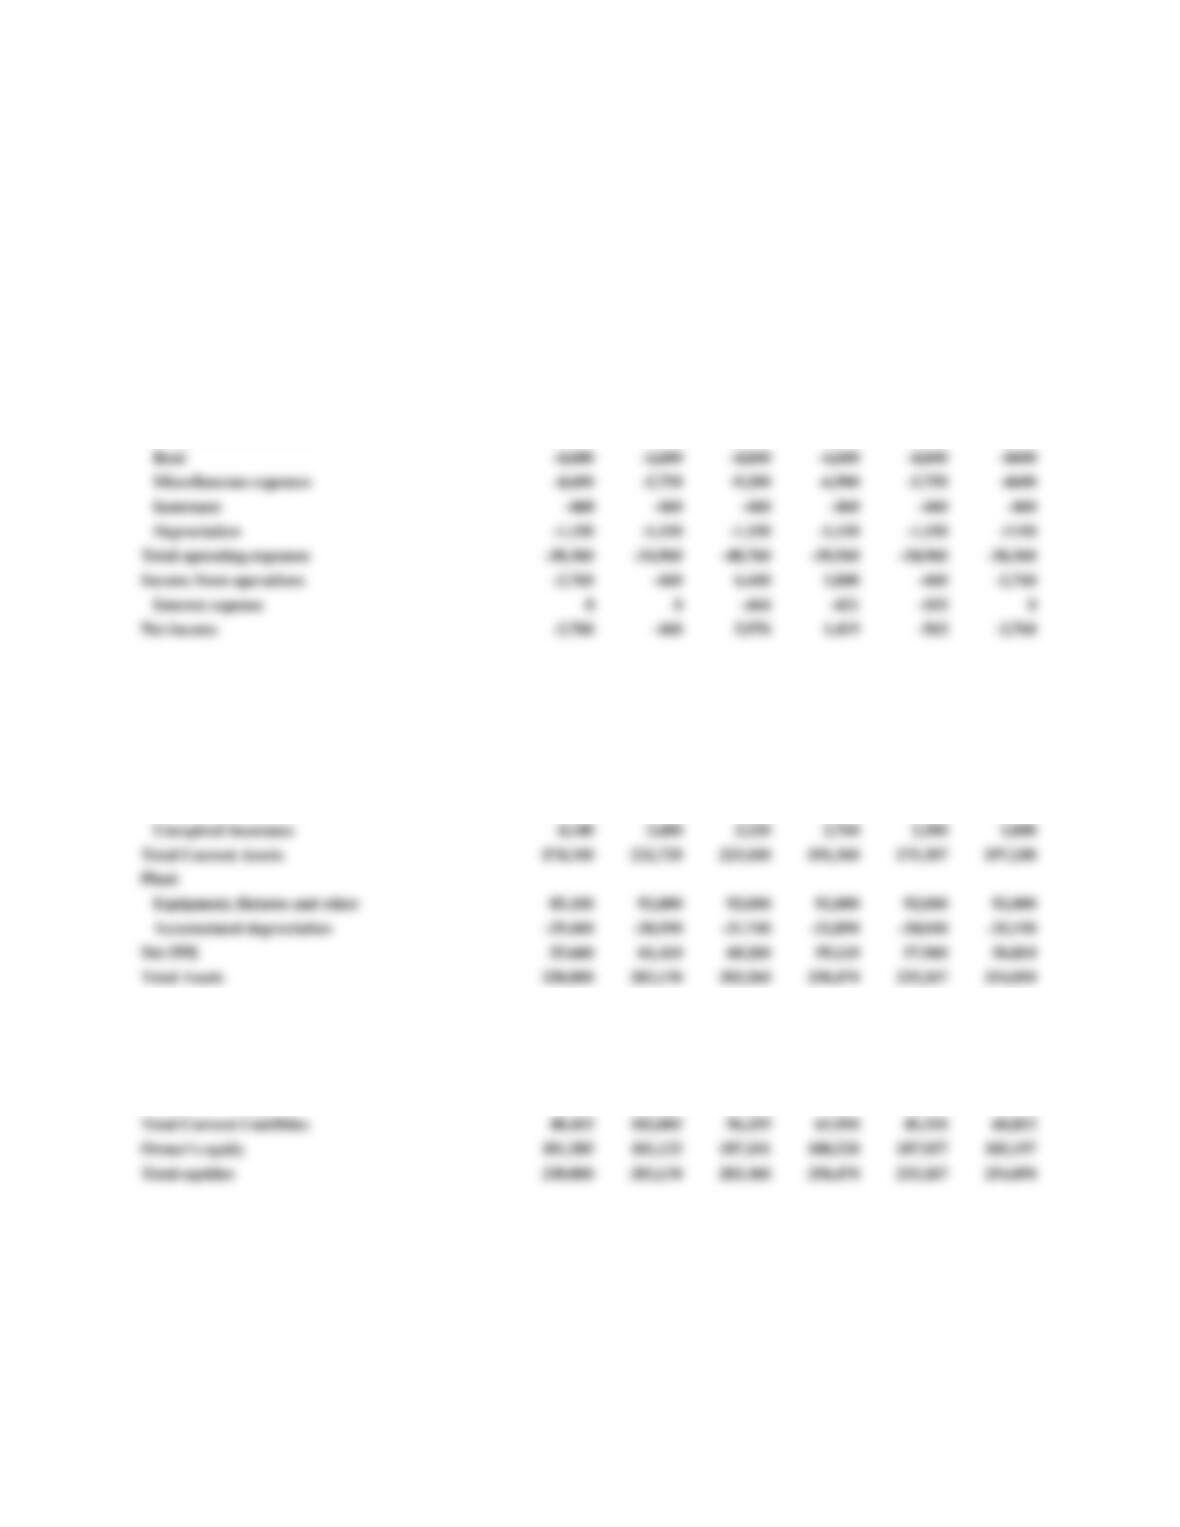
Budgeted Income Statements
Sales 92,000 115,000 184,000 138,000 115,000 92,000
COGS -64,400 -80,500 -128,800 -96,600 -80,500 -64,400
Gross Margin 27,600 34,500 55,200 41,400 34,500 27,600
Operating Expenses 0 0 0 0 0
Wages and commissions -19,550 -23,000 -33,350 -26,450 -23,000 -19,550
Balance Sheets
Current Assets:
Cash 23,000 23,000 23,000 23,000 29,487 23,000
Accounts receivable 36,800 46,000 73,600 55,200 46,000 36,800
Merchandise inventory 110,400 149,040 123,280 110,400 97,520 135,600
Current Liabilities
Accounts payable 38,640 59,570 51,520 41,860 33,810 51,240
Accrued wages and commissions payable 9,775 11,500 16,675 13,225 11,500 9,775
Loan 0 30,935 28,064 6,865 0 7,838
Chapter 6: Managing Cash Flow
98
7. [Short-Term Financial Planning] Artero Corporation is a traditional toy products retailer
that recently also started an Internet-based subsidiary that sells toys online. A markup is
added on goods the company purchases from manufacturers for resale. Swen Artero, the
company president, is preparing for a meeting with Jennifer Brown, a loan officer with First
Banco Corporation, to review year end financing requirements. After discussions with the
company’s marketing manager, Rolf Eriksson, and finance manager, Lisa Erdinger, sales
over the last three months of 2020 are forecasted to be:
Accounting Statement of Cash Flows
Cash Flows From Activities
Net Income -460 5,976 1,419 -563 -2,760
Adjustments to Net Inc for CF
Depreciation Expense 1,150 1,150 1,150 1,150 1,150
Net Cash Flow From Opps (Acct.) -24,035 2,871 21,199 13,352 -14,325
Cash Flows From Investing
Capex -6,900 0 0 0 0
Net Cash Used by Ops/Investments -30,935 2,871 21,199 13,352 -14,325
Chapter 6: Managing Cash Flow
99
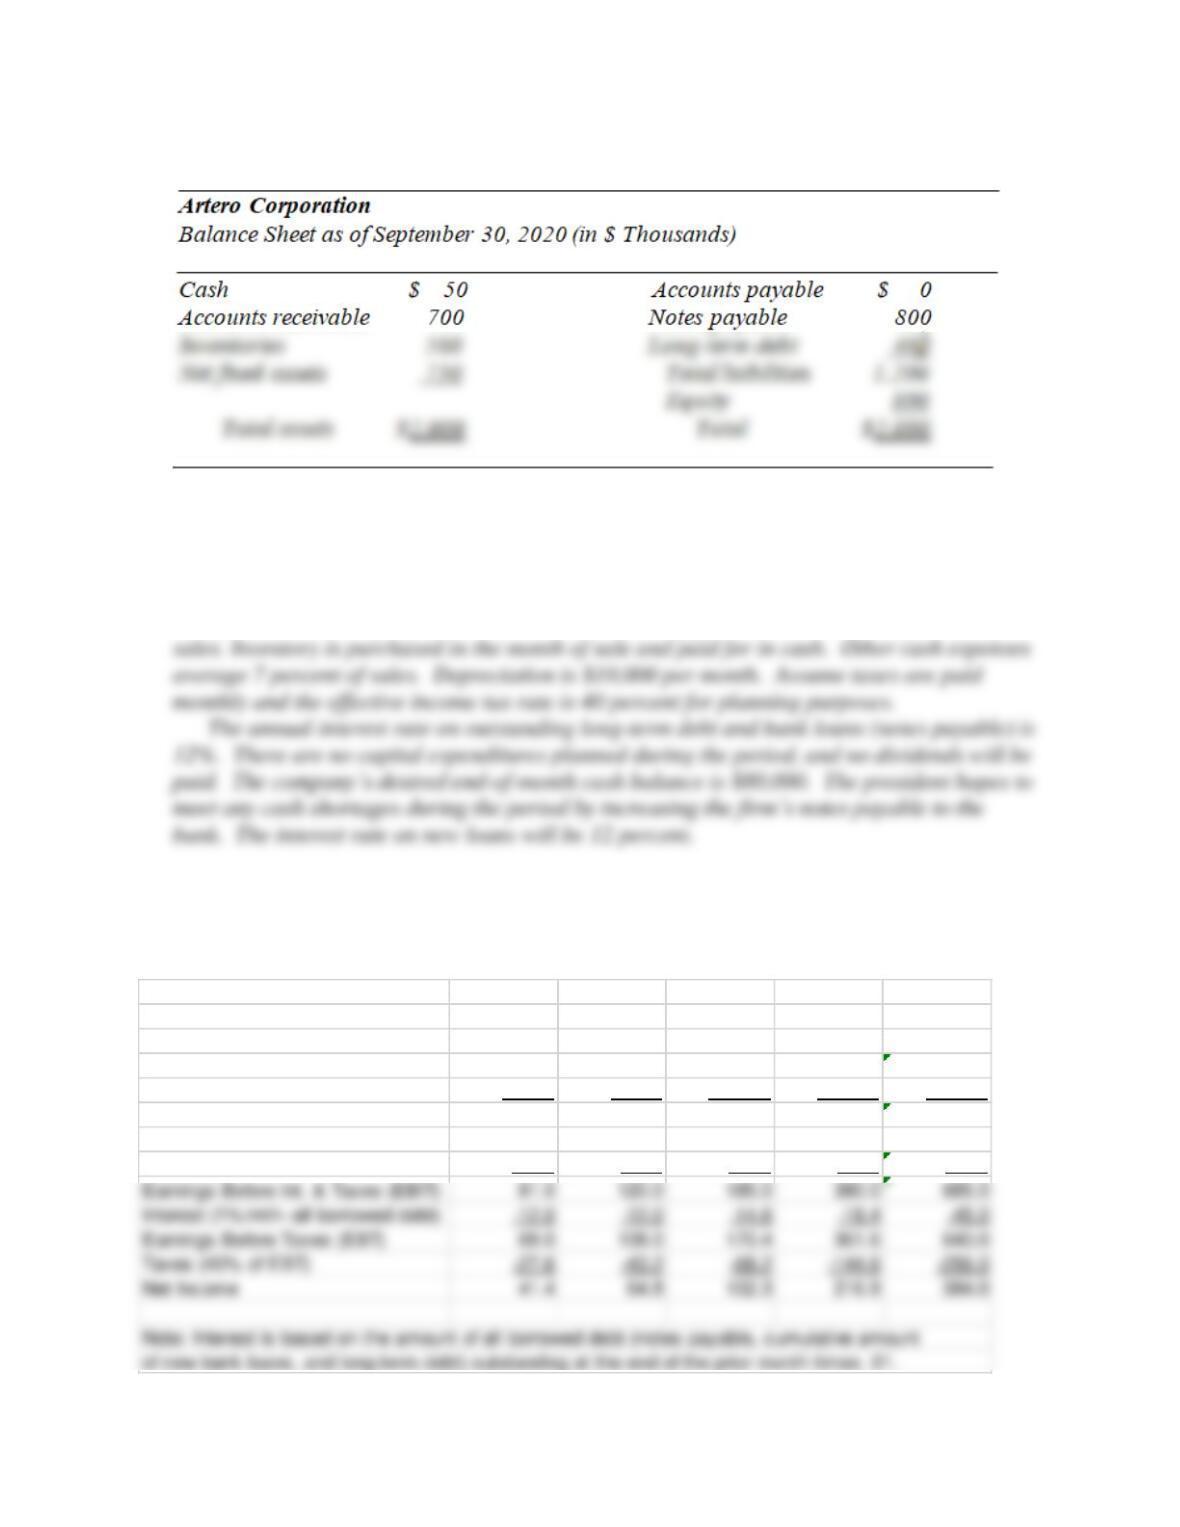
Artero’s balance sheet as of the end of September, 2020 was as follows.
All sales are made on credit terms of net 30 days and are collected the following month and
no bad debts are anticipated. The accounts receivable on the balance sheet at the end of
September thus will be collected in October. The October sales will be collected in
November, and so on. Inventory on hand represents a minimum operating level (or “safety”
stock), which the company intends to maintain. Cost of goods sold average 80 percent of
A. Prepare monthly pro forma income statements for October, November, and December,
and for the quarter ending December 31, 2020.
Artero Corporation Solution Quarter
Ch 6, Prob. 7 (In $ Thousands) Actual Projected Projected Projected Ending
Income Statements Sept. 2020 Oct. Nov. Dec. Dec. 2020
Sales 700.0 1000.0 1500.0 3000.0 5500.0
Cost of Goods Sold (80% of Sales) –560.0 –800.0 -1200.0 -2400.0 -4400.0
Gross Profit 140.0 200.0 300.0 600.0 1100.0
Other Expenses (7% of Sales) -49.0 –70.0 –105.0 –210.0 –385.0
Depreciation –10.0 -10.0 -10.0 -10.0 -30.0
Chapter 6: Managing Cash Flow
100
B. Prepare monthly pro forma balance sheets at the end of October, November, and
December, 2020.
C. Prepare both a monthly cash budget and pro forma statements of cash flows for October,
November, and December 2020.
Balance Sheets Sept. 2020 Oct. Nov. Dec.
Required Cash 50.0 80.0 80.0 80.0
Surplus Cash 0.0 0.0 0.0 0.0
Accounts Receivable 700.0 1000.0 1500.0 3000.0
Inventories 500.0 500.0 500.0 500.0
Cash Budget Sept. 2020 Oct. Nov. Dec.
Collection of Receivables 700.0 1000.0 1500.0
Purchases –800.0 -1200.0 -2400.0
Other Cash Costs (7% of Sales) –70.0 –105.0 –210.0
Chapter 6: Managing Cash Flow
101
D. Describe your findings and indicate the maximum amount of bank borrowing that is
needed.
Based on the financial projection above, a maximum of $1,916,000 is needed.
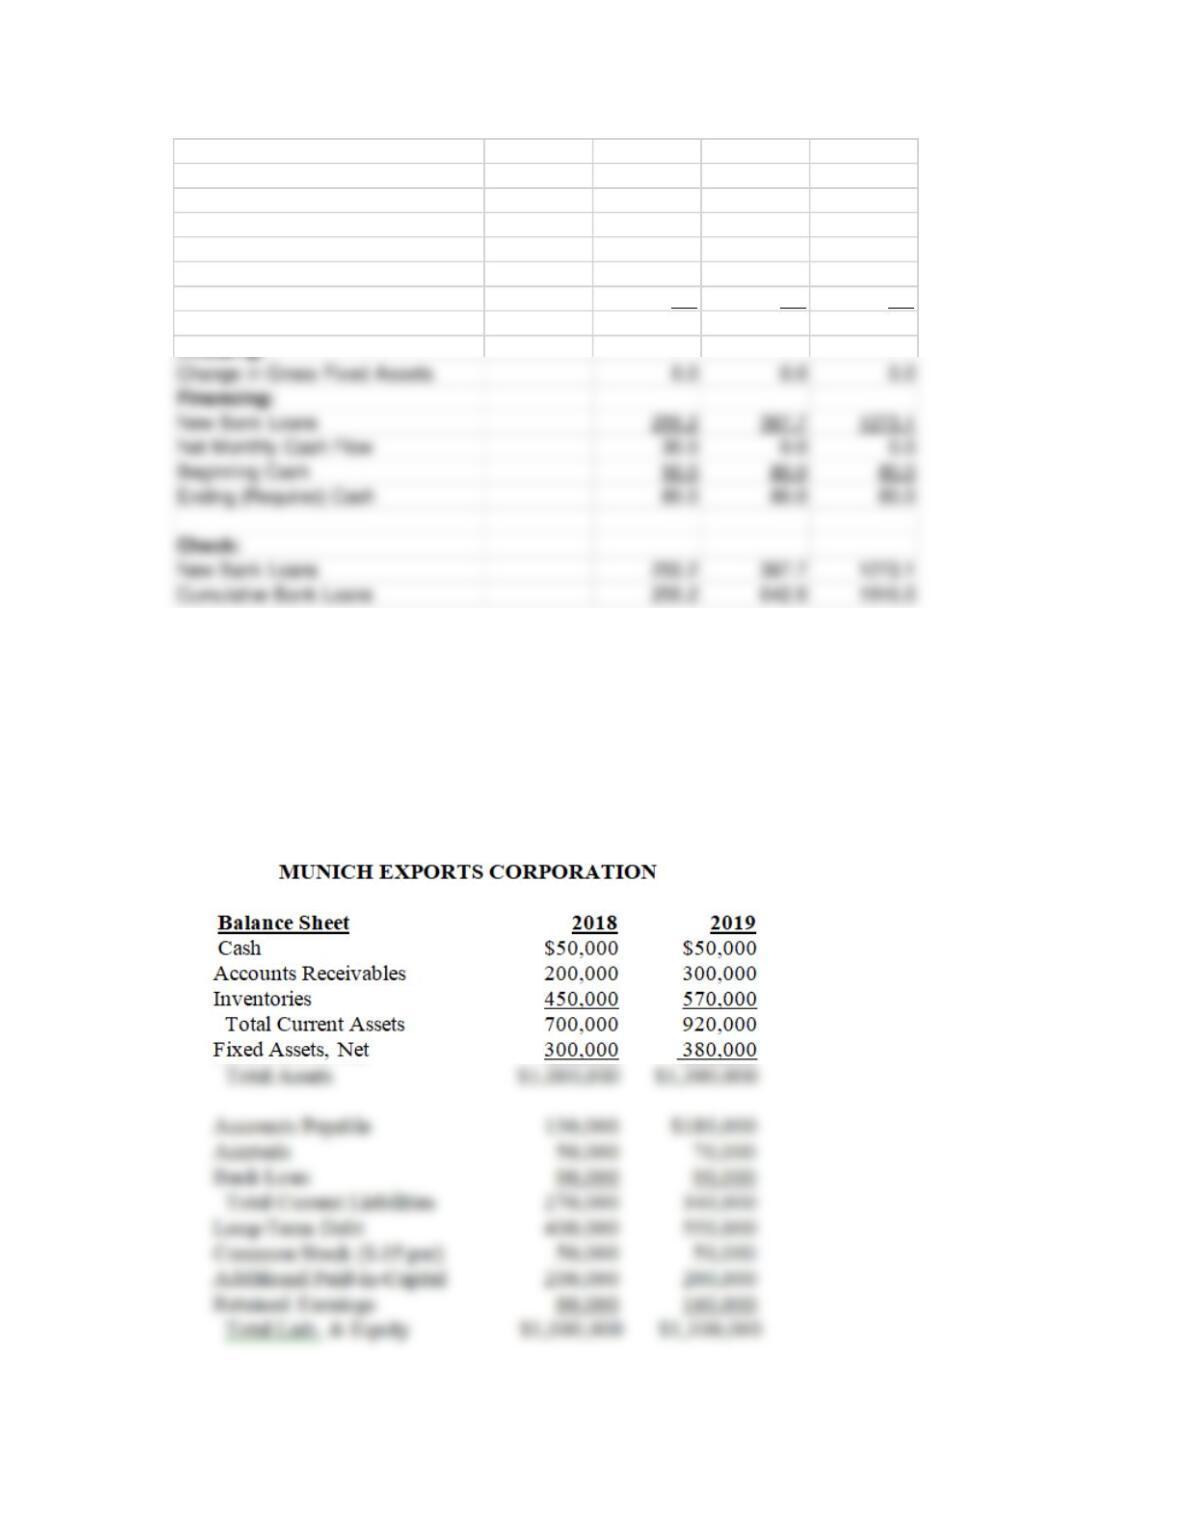
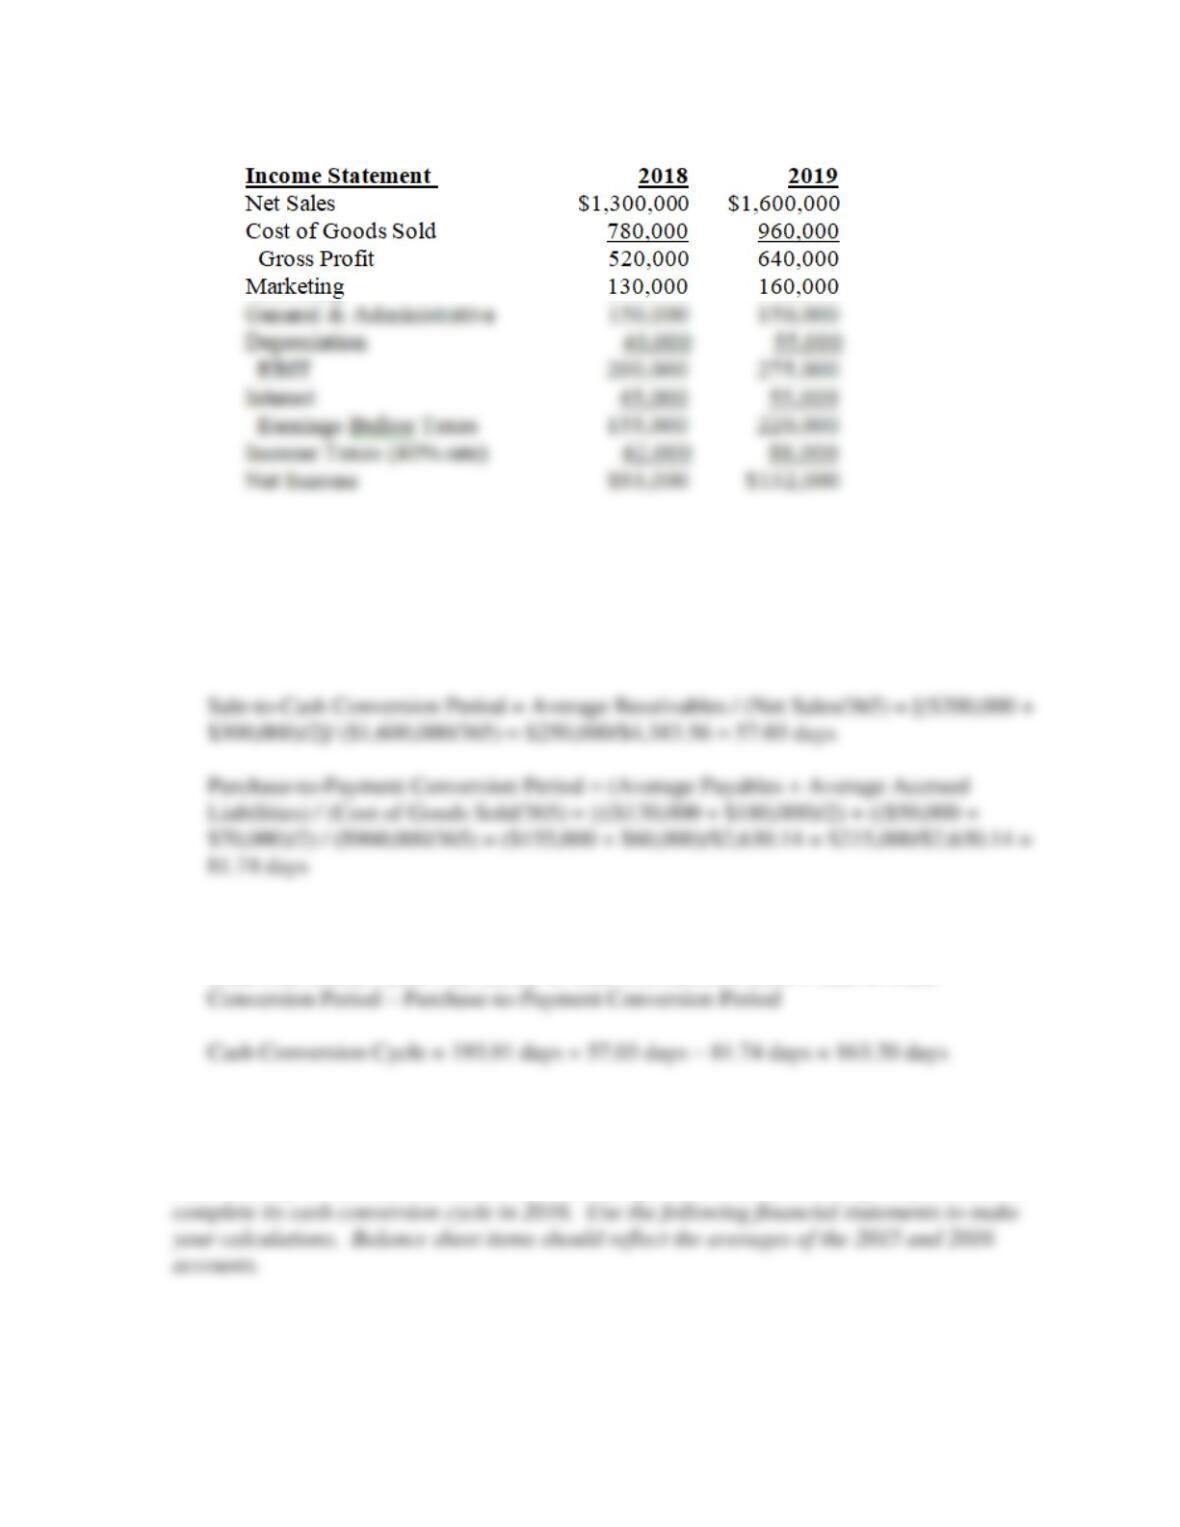
8. Cash Conversion Cycle] Two years of financial statement data for the Munich Export
Corporation are shown below.
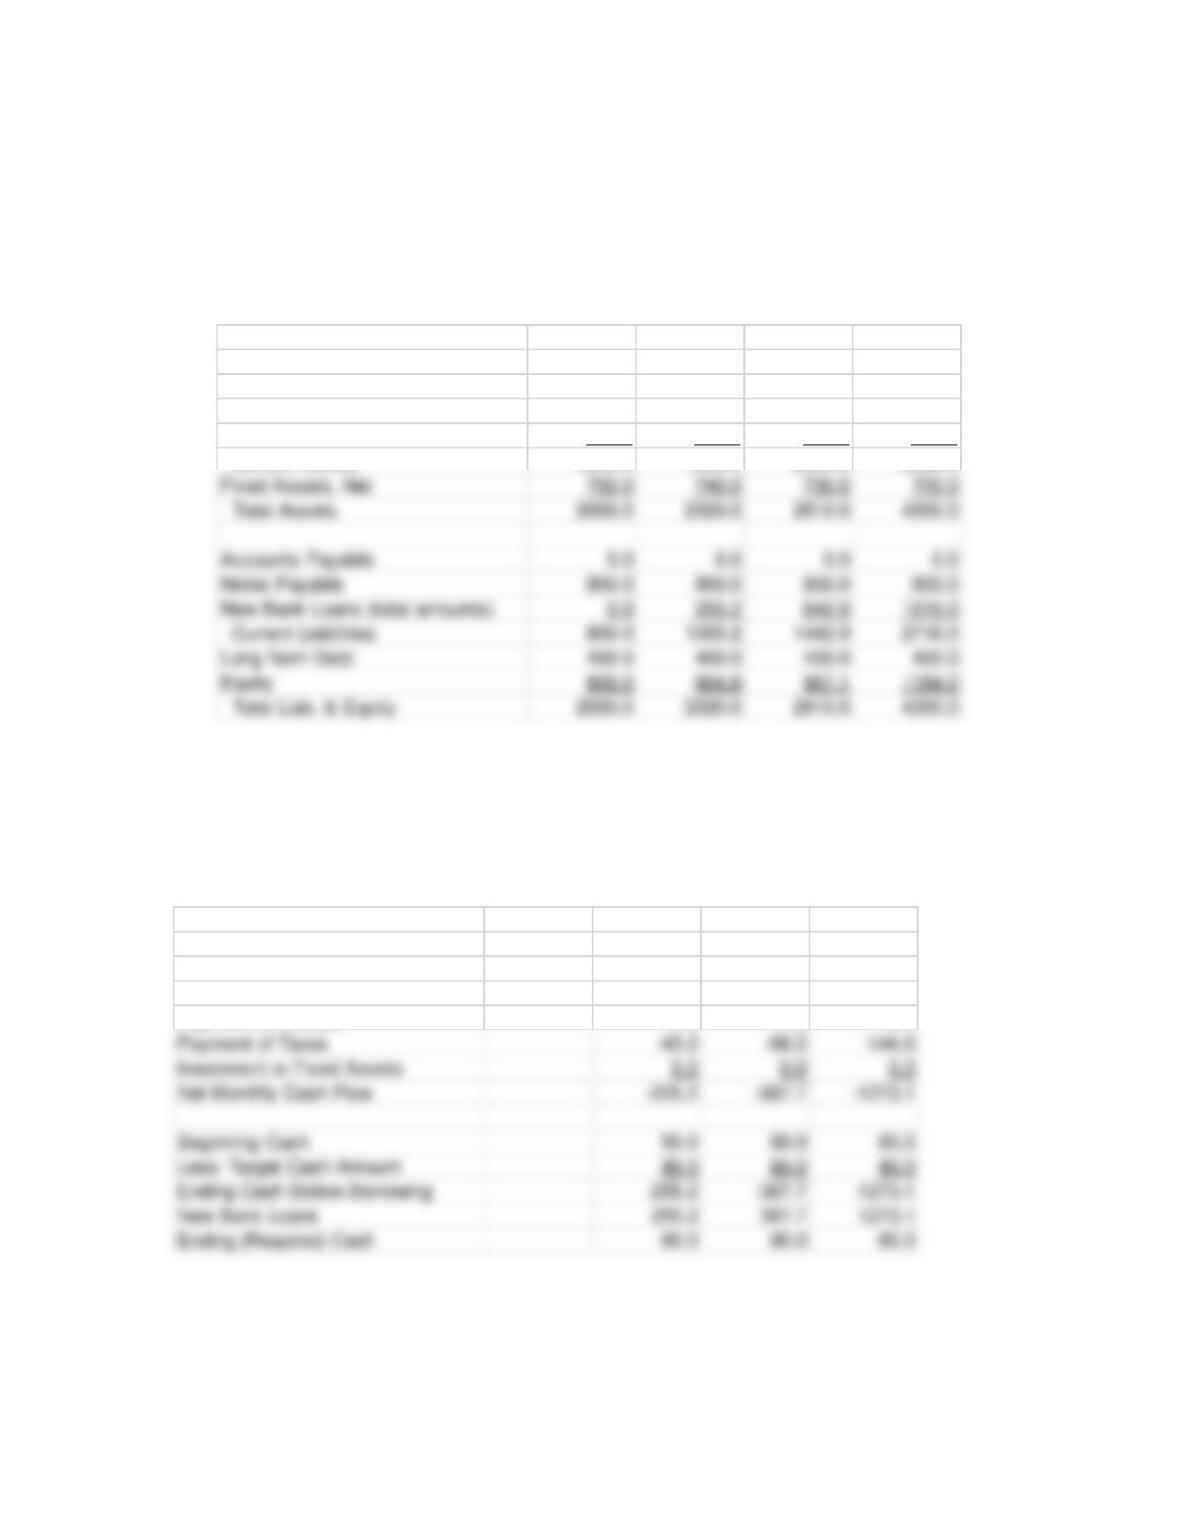
Statement of Cash Flows Sept. 2020 Oct. Nov. Dec.
Operating:
Net Income 64.8 102.3 216.9
Depreciation 10.0 10.0 10.0
Change in Accts. Receivable –300.0 -500.0 –1500.0
Change in Inventories 0.0 0.0 0.0
Change in Accts. Payable 0.0 0.0 0.0
Cash Flow from Operations –225.2 -387.7 –1273.1
Chapter 6: Managing Cash Flow
102
A. Calculate the inventory-to-sale, sale-to-cash, and purchase-to-payment conversion
periods for Munich Exports for 2019.
Inventory-to-Sale Conversion Period = Average Inventories / (Cost of Goods Sold/365) =
[($450,000 + $570,000)/2]/$960,000/365 = $510,000/$2,630.14 = 193.91 days
B. Calculate the length of Munich Exports’ cash conversion cycle for 2019.
Cash Conversion Cycle = Inventory-to-Sale Conversion Period + Sale-to-Cash
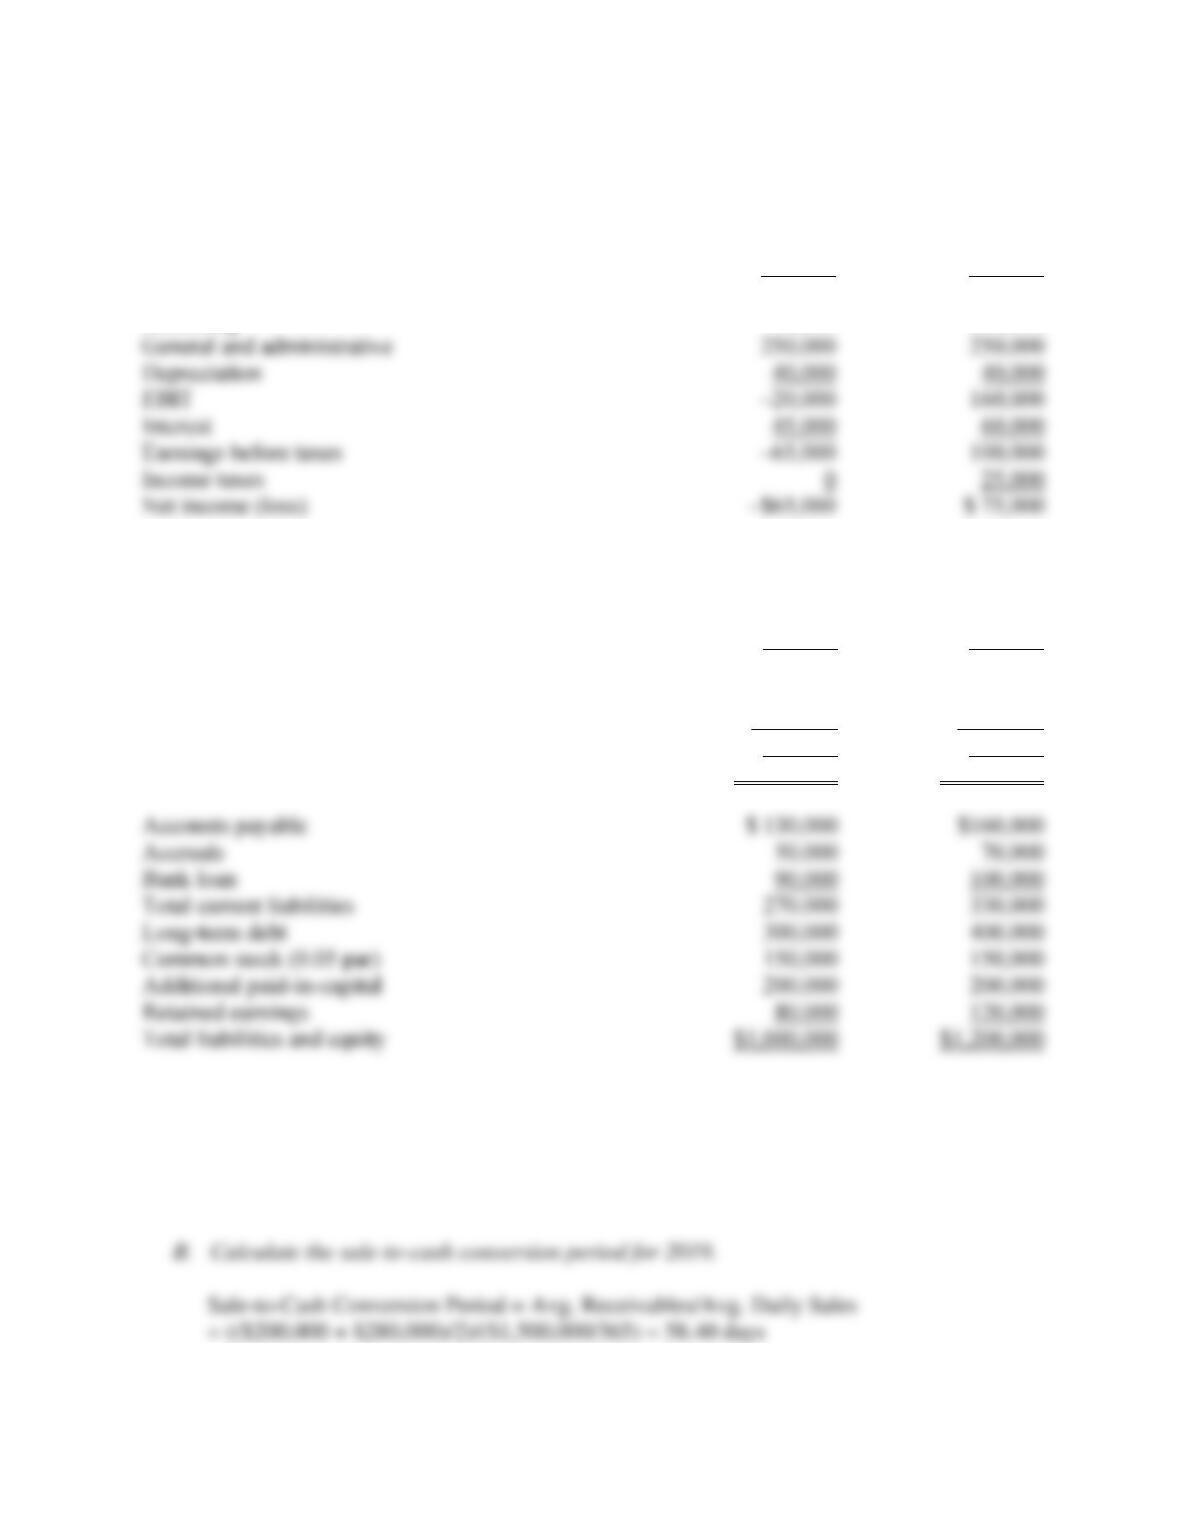
9. [Cash Conversion Cycle] Castillo Products Company improved its operations from a net loss
in 2018 to a net profit in 2019. While the founders, Cindy and Rob Castillo, are happy about
these developments, they are concerned with trying to understand how long the firm takes to
Chapter 6: Managing Cash Flow
103
CASTILLO PRODUCTS COMPANY
INCOME STATEMENT
2018
2019
Net sales
$900,000
$1,500,000
Cost of goods sold
540,000
900,000
Gross profit
360,000
600,000
Marketing
90,000
150,000
General and administrative
250,000
250,000
Depreciation
40,000
EBIT
160,000
Interest
45,000
Earnings before taxes
100,000
Income taxes
Net income (loss)
BALANCE SHEET
2018
2019
Cash
$ 50,000
$ 20,000
Accounts receivable
200,000
280,000
Inventories
400,000
500,000
Total current assets
650,000
800,000
Gross fixed assets
450,000
540,000
Accumulated depreciation
–100,000
–140,000
Net fixed assets
350,000
400,000
Total assets
$1,000,000
$1,200,000
Accounts payable
$ 130,000
Accruals
Bank loan
100,000
Total current liabilities
270,000
330,000
Long-term debt
300,000
400,000
Common stock (0.05 par)
150,000
150,000
Additional paid-in-capital
200,000
200,000
Retained earnings
120,000
Total liabilities and equity
$1,000,000
$1,200,000
A. Calculate the inventory-to-sale conversion period for 2019.
Inventory-to-Sale Conversion Period = Avg. Inventory/Avg. Daily COGS
= (($400,000 + $500,000)/2)/($900,000/365) = 182.50 days
Chapter 6: Managing Cash Flow
104
C. Calculate the purchase-to-payment conversion period for 2019.
Purchase-to-Payment Conversion Period
= (Avg. Payables + Avg. Accruals)/Avg. Daily CGS
= (($130,000 + $160,000)/2 + ($50,000 + $70,000)/2)/($900,000/365) = 83.14 days
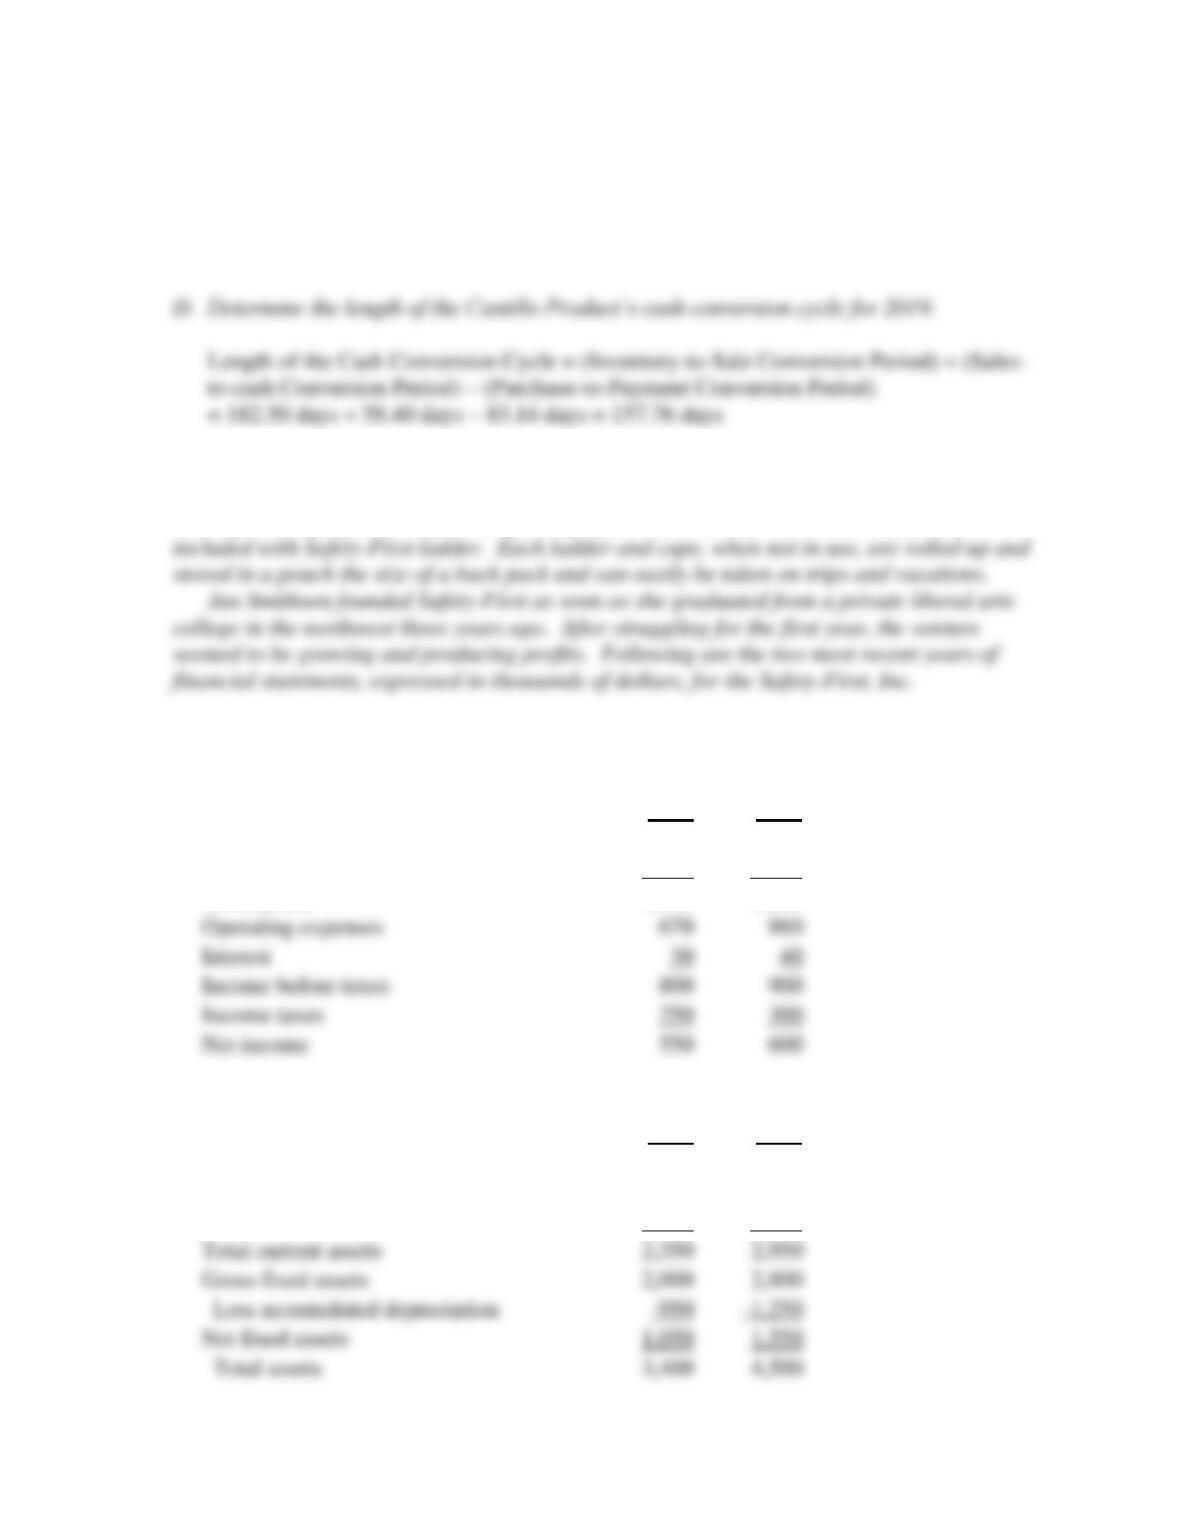
10. [Cash Conversion Cycle] Safety-First, Inc. makes portable ladders that can be used to exit
second floor levels of homes in the event of fire. Each ladder consists of fire resistant rope
and high strength plastic steps. A lightweight fire resistant cape with a smoke filter is
SAFETY-FIRST, INC.
Income Statements (in $ Thousands)
2018
2019
Net sales
3,750
4,500
Cost of goods sold
2,250
2,700
Gross profit
1,500
1,800
Operating expenses
670
860
Interest
Income before taxes
800
900
Income taxes
250
300
Net income
550
600
Balance Sheets (in $ Thousands)
2018
2019
Cash
400
150
Accounts receivable
500
800
Inventories
1,450
2,000
Total current assets
2,350
2,950
Gross fixed assets
2,000
2,800
Less accumulated depreciation
Net fixed assets
1,050
1,550