CAPSTONE CASE 1: ECO-PRODUCTS, INC.
End-of-Case Assignments: Suggested Discussions and Analyses
A. Describe Eco-Products’ early history (1990 through 2003). Would you view the firm
during that period as being a life-style business, an entrepreneurial venture, or? Why?
Steve Savage and his father founded the company in 1990 with the intent to provide eco–
B. Discuss Eco-Products’ revenue growth–based “business model” that evolved over the
2004 through early 2008 period in terms of (a) production versus distribution, (b)
product line development, (c) branding, etc.
The company remained a local marketer of green janitorial paper and building supplies
until 2004 when the company was set on a new course with both business supply and
building supply divisions. The management team was expanded and sales in the business
supply division grew rapidly as a result of a focus on brand and Internet strategies.
a) In 2004-05 Eco-Products remained primarily a distributor of eco-friendly
b) Steve Savage emphasized the development of a signature Eco-Products line from
c) As wholesale distribution grew, existing product manufacturers restricted Eco-
C. What is the size of the domestic and global markets for foodservice disposable
packaging? Who are the major competitors producing/selling environmentally-friendly
food service products. What intellectual property or competitive advantages does Eco-
Products, Inc. possess?
Capstone Case 1: Eco-Products, Inc.
The global food service disposable industry produces an estimated $30 billion in sales
D. Exhibits 2 and 3 present Eco-Products’ financial statement information for 2005, 2006,
and 2007. Prepare a ratio analysis of the firm’s financial performance over the 2005-07
period.
Note: the financial statements for 2005 and 2006 were unaudited. For 2007, the
income statement and statement of cash flow were “reviewed” while the balance
sheet was “audited.” As a result, some discrepancies exist when trying to reconcile
2005 COGS/Revenues = 2,584,326/3,649,799 = .708 = 70.8%
2006 COGS/Revenues = 3,684,492/5,751,787 = .641 = 64.1%
2007 COGS/Revenues = 7,726,455/10,867,104 = .711 = 71.1%
2005 Gross Profit Margin = 1,065,473/3,649,799 = .292 = 29.2%
2006 Gross Profit Margin = 2,067,295/5,751,787 = .359 = 35.9%%
2007 Gross Profit Margin = 3,140,649/10,867,104 = .289 = 28.9%
Capstone Case 1: Eco-Products, Inc.
As Eco-products moved from being a distributor/retailer of other manufacturers’ products
to producing/wholesaling its own products, its profit margins declined from 2005 to
2007. In fact, the firm had a net loss in 2007 due in large part to the nearly $200,000
An accompanying Excel spreadsheet provides the following ratio calculations for
2007 and 2008 (data were not available until 2009).
E. Exhibit 4 presents Eco-Products’ Statement of Cash Flows for 2007. Was the firm
building or burning cash in its operating activities? When also considering cash flows
from investing activities, was Eco Products in a net cash build or burn position in 2007?
In Chapters 4 and 6 we discussed the preparation of the Statement of Cash Flows. We
use the indirect method which begins with an accounting period’s (usually one year) net
Selected Ratios: 2007 2008
GOGS/Revenues 71.1% 75.7%
Gross Profit Margin 28.9% 24.3%
Operating Profit Margin 1.2% 3.2%
Net Profit Margin –0.3% 1.6%
Capstone Case 1: Eco-Products, Inc.
Also, as noted in the prior question, only the 2007 balance sheet was audited. Other
financial statements were only “reviewed by a CPA firm. This makes it more difficult to
separately prepare (using the indirect method) a statement of cash flows for Eco-Products
for 2007. While many of the changes in balance sheet accounts between 2006 and 2007
match with the amounts presented in the consolidated statements of cash flow in Exhibit
4, others do not. Thus, for this question we suggest that students concentrate on Exhibit 4
to determine the extent to which Eco-Products was building or burning cash in 2007.
Note: there may be deferred income taxes as well as changes in other less common
current asset and current liability accounts (as shown in Exhibit 4) that must be accounted
for in determining net cash used in operating activities. These include prepaid expenses
and other assets, income tax receivable, deposits, other current liabilities, deferred lease
liability, and deferred revenue and are considered below.
Cash Burn = 10,786,740 [i.e., 7,726,455 + 1,822,206 +1,102,437 + 187,918 (interest &
Capstone Case 1: Eco-Products, Inc.
F. Describe the early rounds of financing that occurred from Eco-Products’ inception in
1990 through 2006. Beginning in 2007, the need for external financing began
increasing. Describe the sources, amounts, and types of financing obtained during
2007and the early part of 2008.
Exhibit 5 in the case summarizes previous rounds of financing. Eco-Products was started
G. In mid-2007, Eco-Products’ management prepared a five-year (2007-2011) projection of
revenues and expenses (see Exhibit 1). What annual rates of growth were projected for
net sales? Make a “back-of-the-envelope” estimate of the amounts of additional assets
needed to support the sales forecasts. How might these assets be financed? Prepare a
“rough” estimate of the possible size of external financing needed to support these sales
projections.
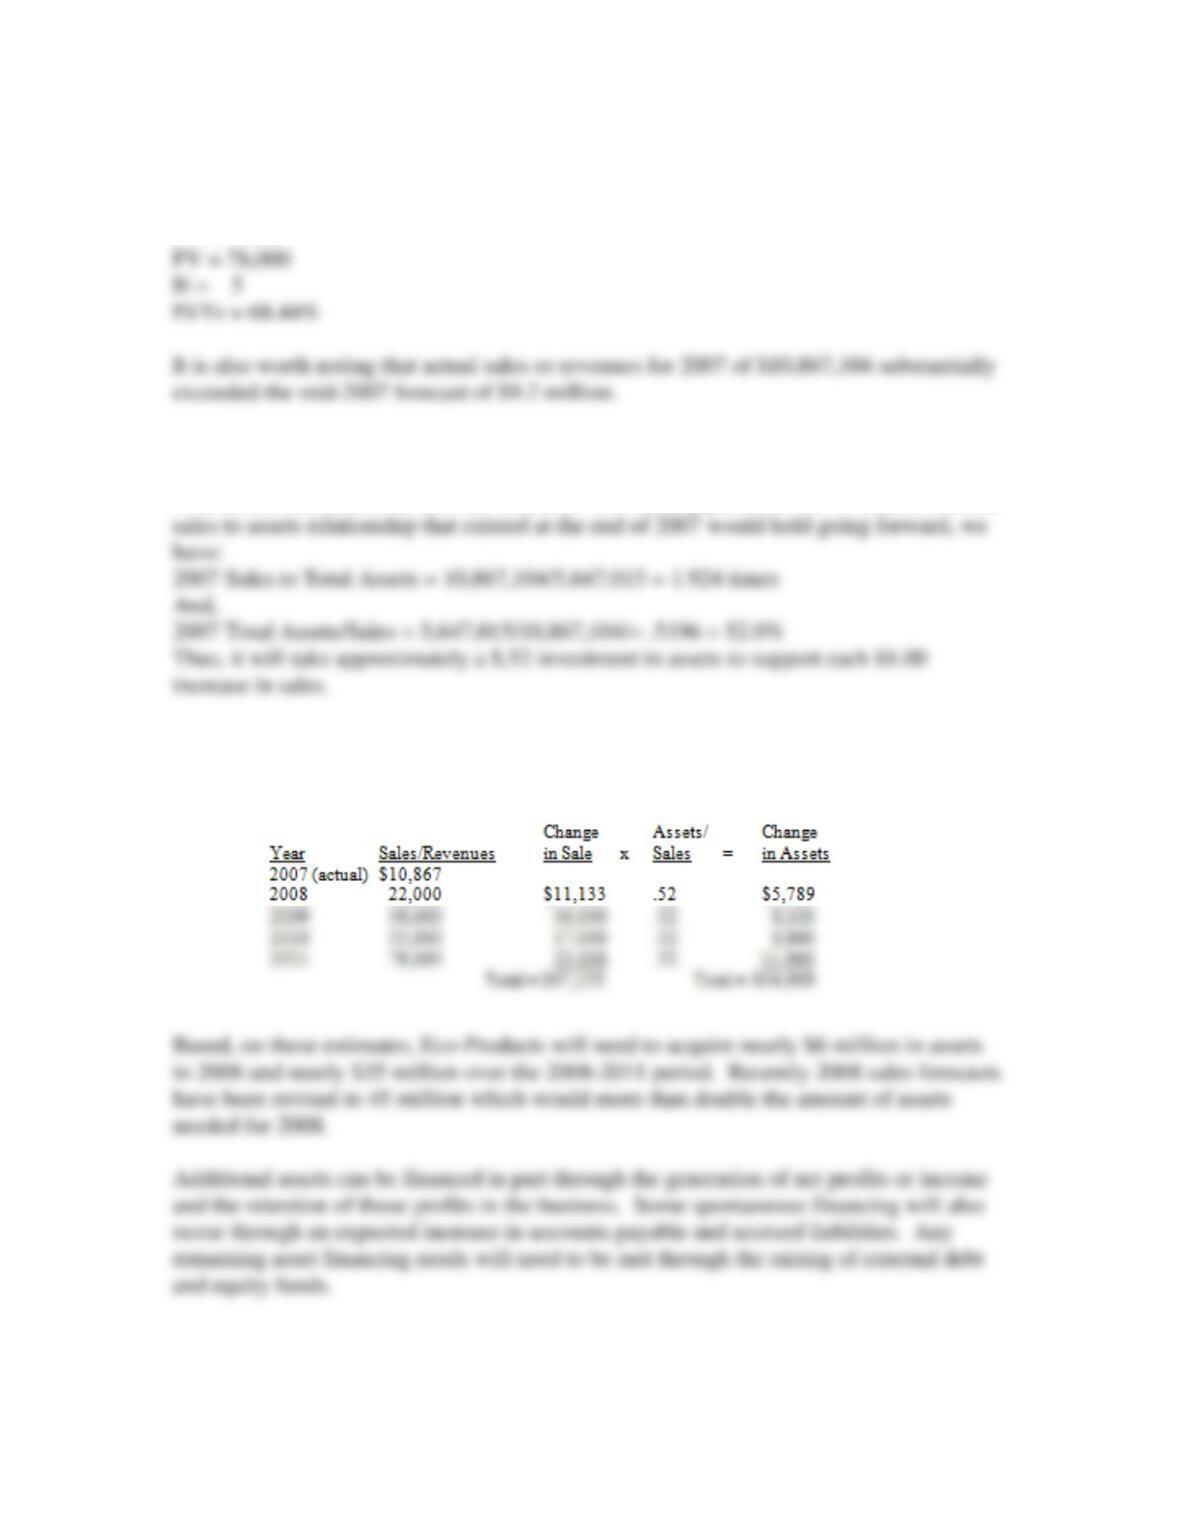
First, let’s review recent actual sales growth rates:
Year Sales/Revenues Percent Increase
2005 $3,649,799
Capstone Case 1: Eco-Products, Inc.
Actual revenues for 2006 were 5,751,787 or in Thousands of Dollars rounded to 5,752.
The five-year compound rate of growth between 2006 actual revenues and projected 2011
revenues of 78,000 is:
PV = -5752
Over the 2005-2007 period, Eco-Products changed from being primarily a retail
distributor of eco-friendly paper and plastic products produced by other manufacturers to
a wholesale distributor of its own “branded” eco-friendly products. If we assume that the
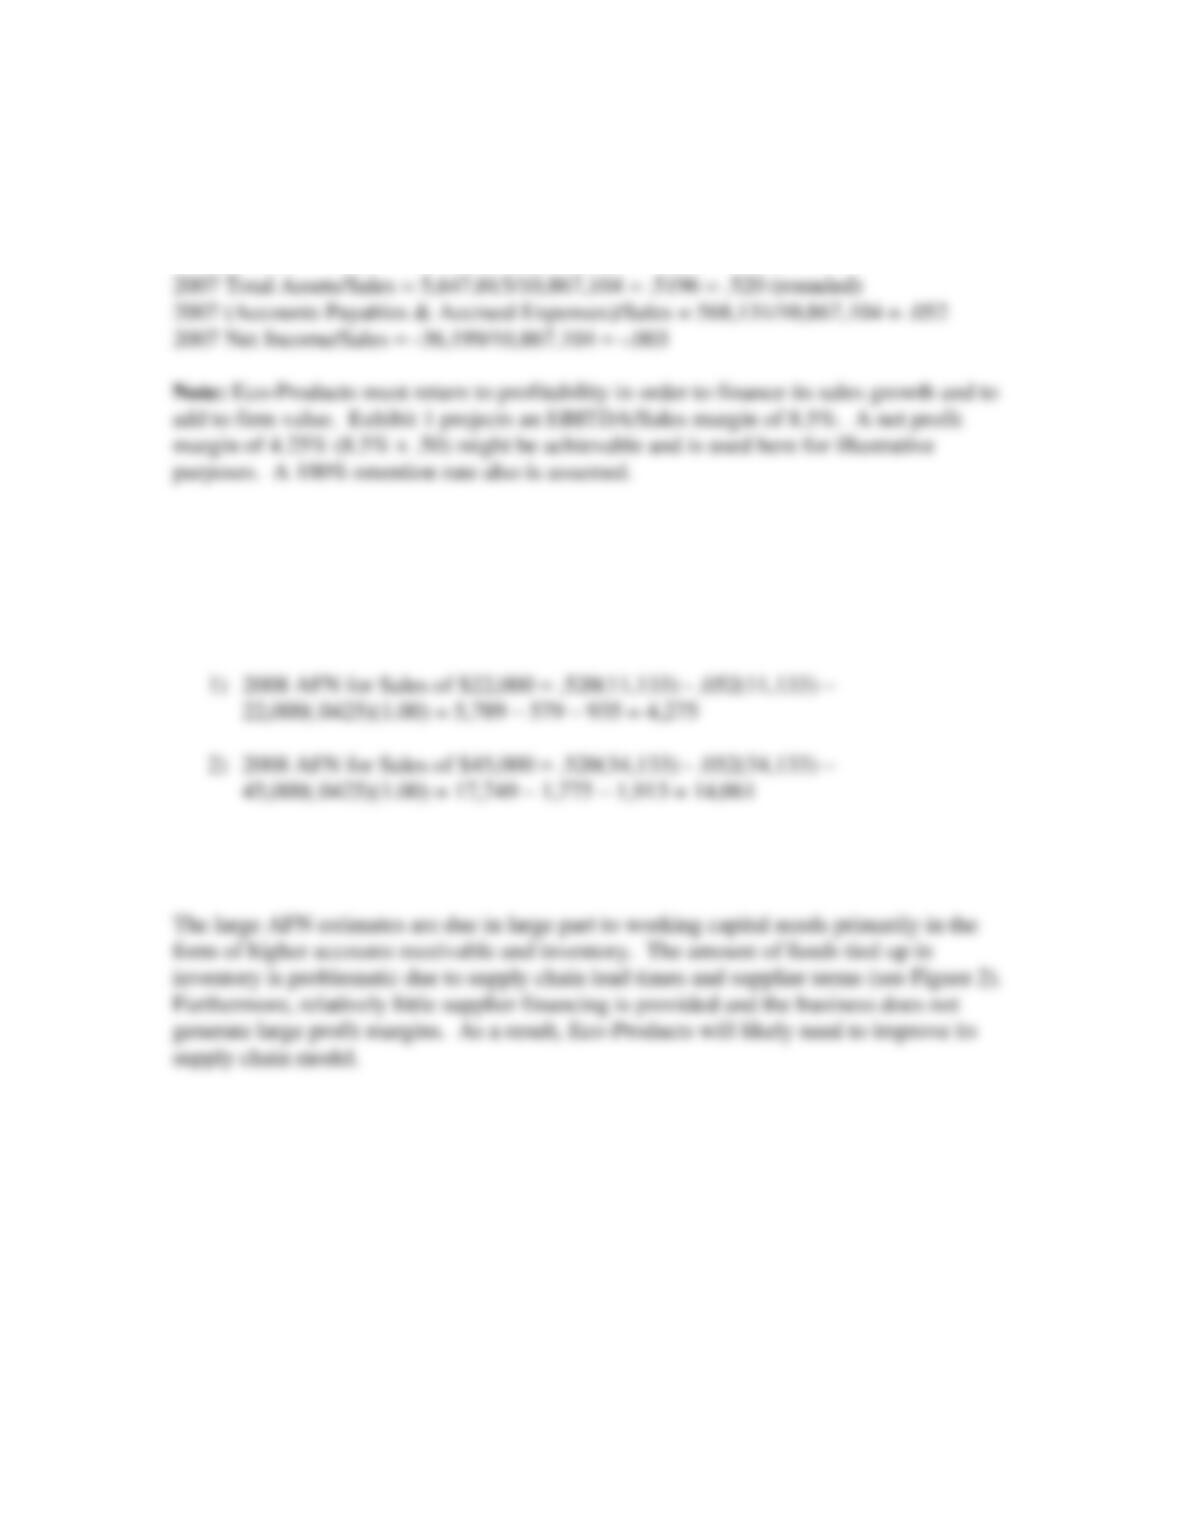
Using the actual 2007 revenues, we have the following estimates for the change in both
sales and assets:
In Chapter 6, we introduced a basic additional funds needed (AFN) equation which can
provide a quick “back-of-the-envelope” estimate of future external financing needs.
Capstone Case 1: Eco-Products, Inc.
AFN = (Total Assets/Sales)(Change in Sales) – (Accounts Payable + Accrued
Liabilities)/(Change in Sales) – (Next Year’s Sales)(Net Income/Net Sales)(Retention
Rate)
Two AFN estimates are prepared for 2008:
1) 2008 sales estimate (in $ Thousands) made in mid-2007 = $22,000; with a change
of $11,133 ($22,000 – $10,867)
2) 2008 sales estimate (in $ Thousands) made in early-2008 = $45,000; with a
change of $34,133 ($45,000 – $10,867)
The 2008 AFN ranges from $4.275 million for $22 million in sales to $14.061 million for
$45 million in sales or revenues.
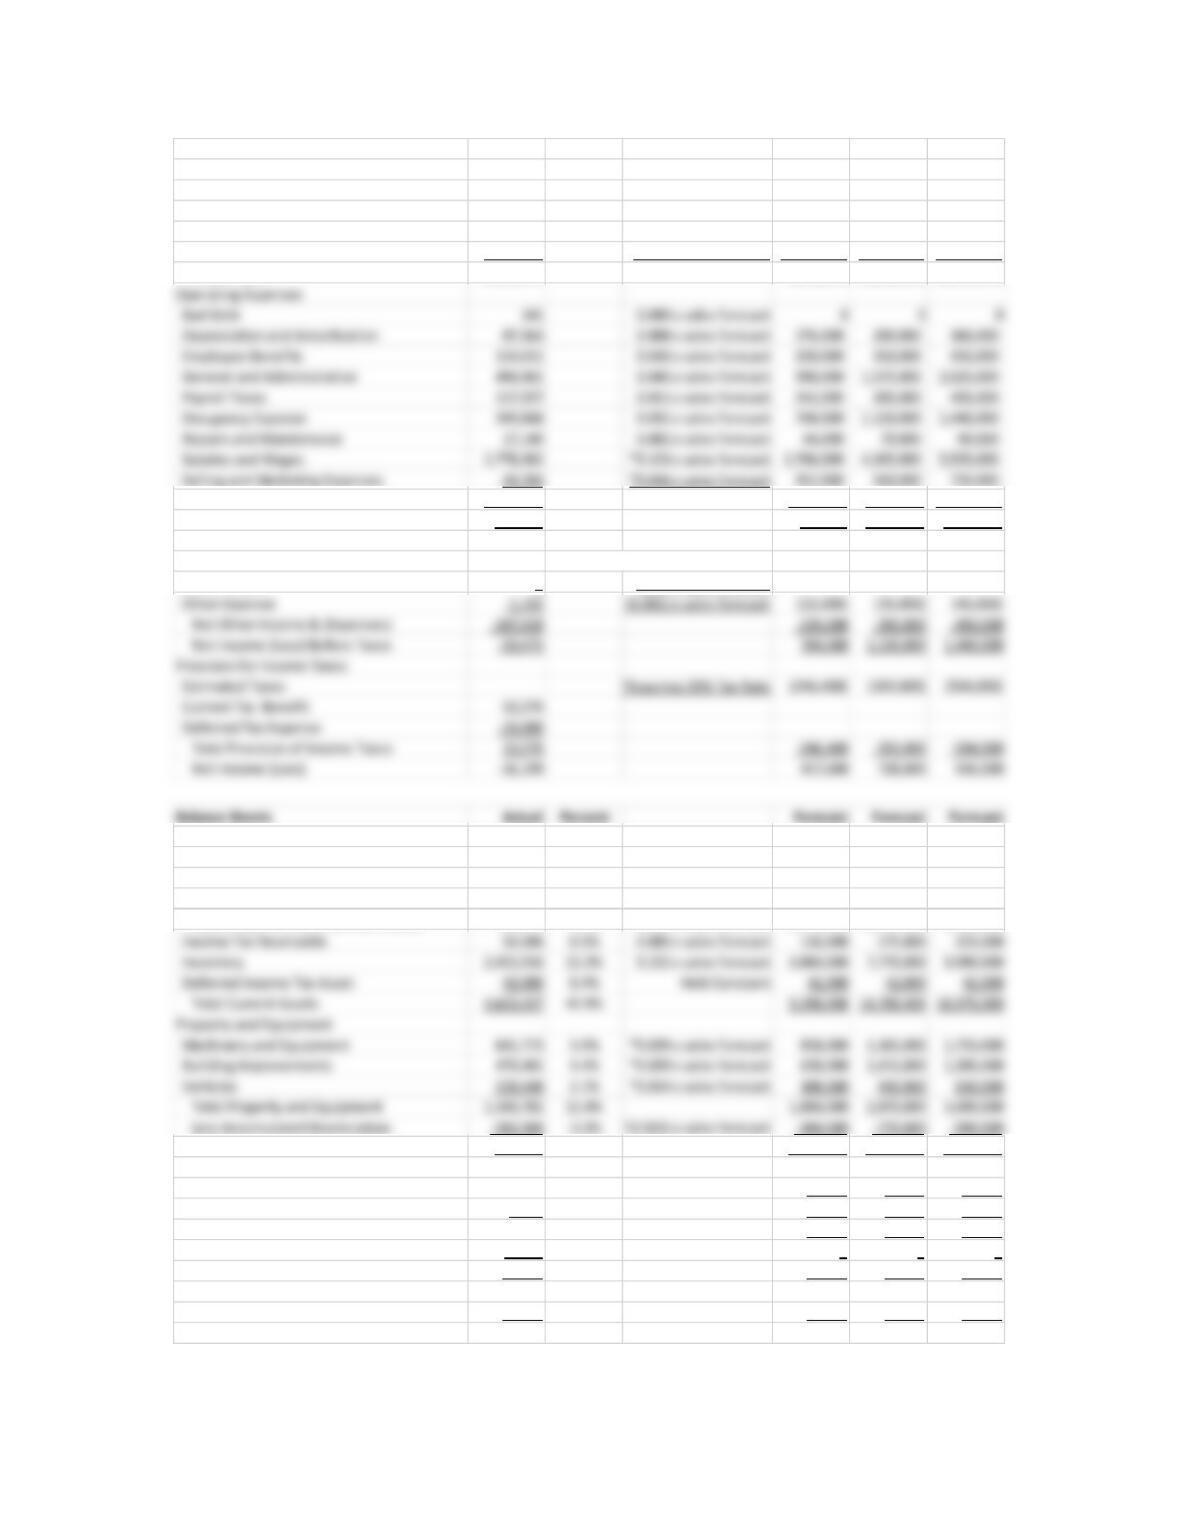
Note: An accompanying Excel spreadsheet provides basic financial statement
projections for 2008 for three different revenue projections. The results follow.
Capstone Case 1: Eco-Products, Inc.
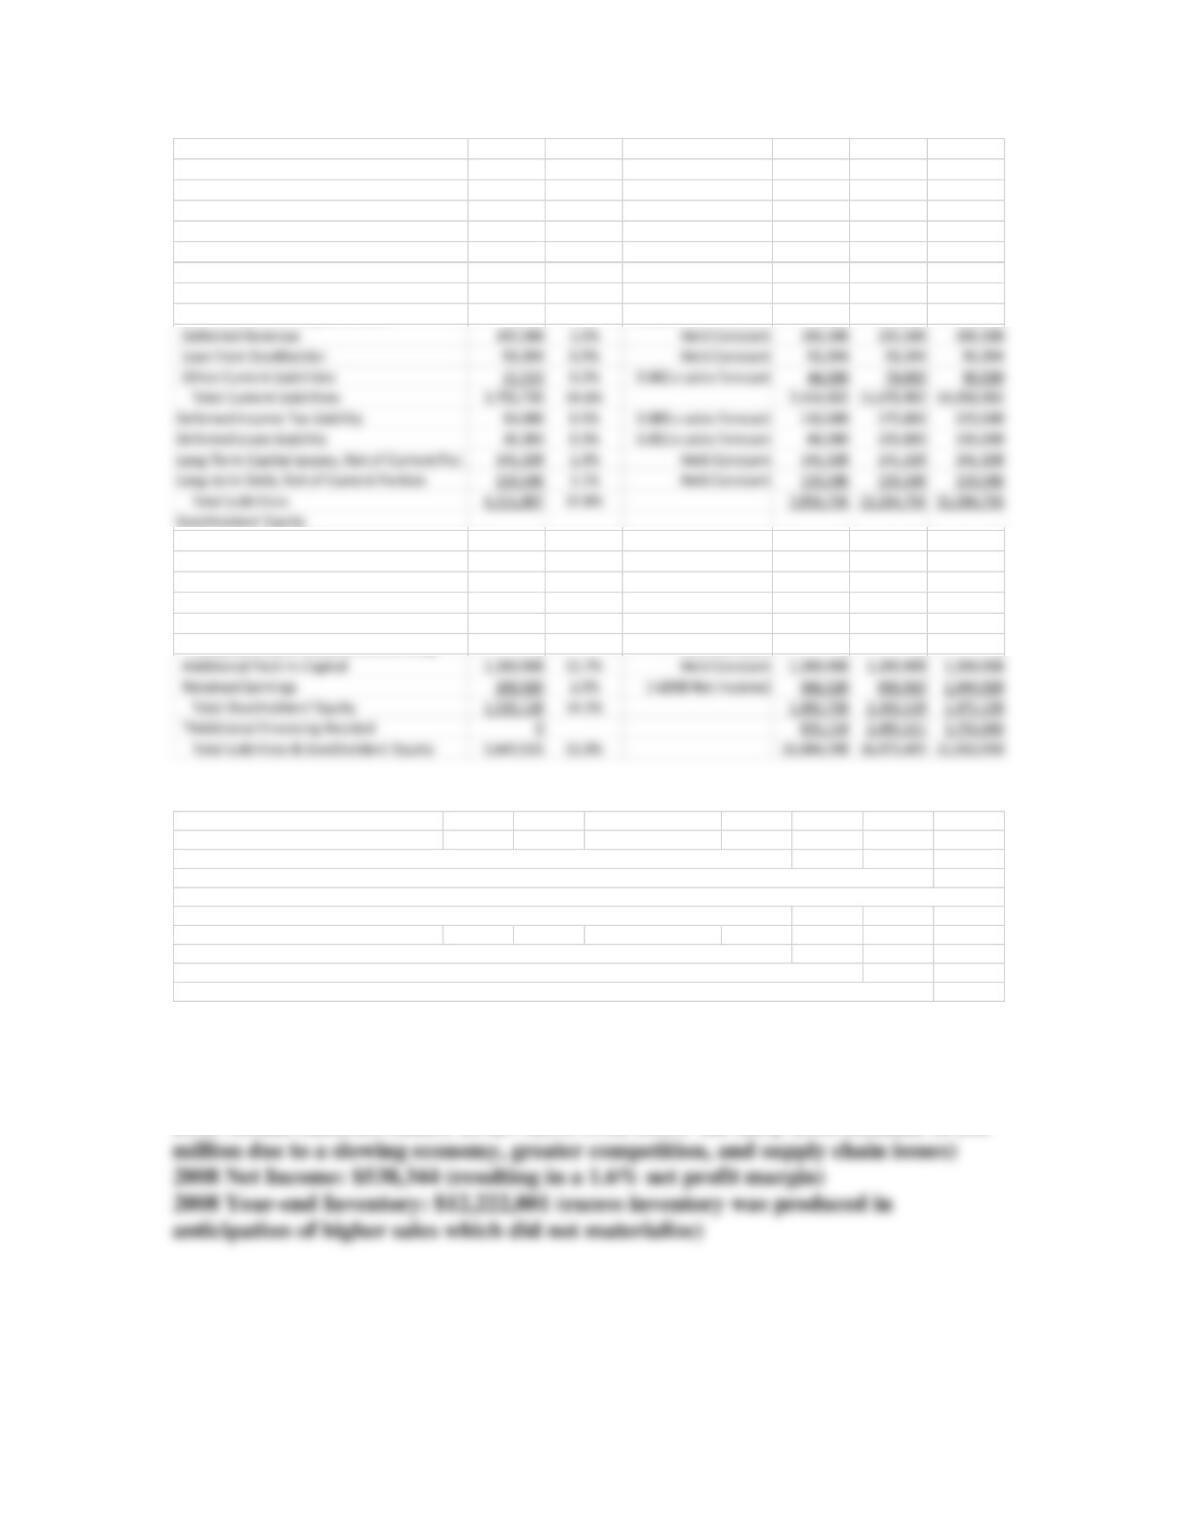
Eco-Products, Inc.
Financial Statements and Projections Forecast Basis: Mid-2007 Moderate Early-2008
[Dollars] Actual Percent of Forecast Forecast Forecast
Income Statements 2007
2007 Revenues (Sales)
2008 2008 2008
Net Revenues 10,867,104 Estimated Amounts 22,000,000 35,000,000 45,000,000
Cost of Goods Sold 7,726,455 0.711 x sales forecast 15,642,000 24,885,000 31,995,000
Gross Profit 3,140,649 6,358,000 10,115,000 13,005,000
Total Operating Expenses 3,012,206 5,434,000 8,645,000 11,115,000
Operating Profit 128,443 924,000 1,470,000 1,890,000
Other Income and (Expenses)
Interest Expense -186,726 *(0.009) x sales forecast (198,000) (315,000) (405,000)
Other Income 0 0.000 x sales forecast – – –
Assets 2007 of Sales 2008 2008 2008
Current Assets
Cash 51,667 0.5% 0.005 x sales forecast 104,598 166,405 213,950
Accounts Receivable, Net 1,330,562 12.2% 0.122 x sales forecast 2,684,000 4,270,000 5,490,000
Prepaid Expenses & Other Cur. Assets 728,776 6.7% 0.067 x sales forecast 1,474,000 2,345,000 3,015,000
Net Property and Equipment 989,398 9.1% 1,320,000 2,100,000 2,700,000
Intangible Assets
Trademarks 20,800 0.2% 0.002 x sales forecast 44,000 70,000 90,000
Other Intangible Assets 5,440 0.1% 0.001 x sales forecast 22,000 35,000 45,000
Total Intangible Assets 26,240 0.2% 0.002 x sales forecast 44,000 70,000 90,000
Less Accumulated Amortization -2,050 0.0% 0.000 x sales forecast 0 0 0
Net Intangible Assets 24,190 0.2% 44,000 70,000 90,000
Other Assets
Deposits 10,000 0.1% 0.001 x sales forecast 22,000 35,000 45,000
Total Assets 5,647,015 52.0% 10,684,598 16,973,405 21,810,950
Capstone Case 1: Eco-Products, Inc.
Note: Actual 2008 operating results are presented in the Epilogue (What Happened)
at the end of this teaching note:
H. Eco-Products’ management developed a Confidential Private Placement Memorandum
(PPM) dated October 16, 2007 in an attempt to raise $3,500,000. Appendix A contains
excerpts from the PPM.
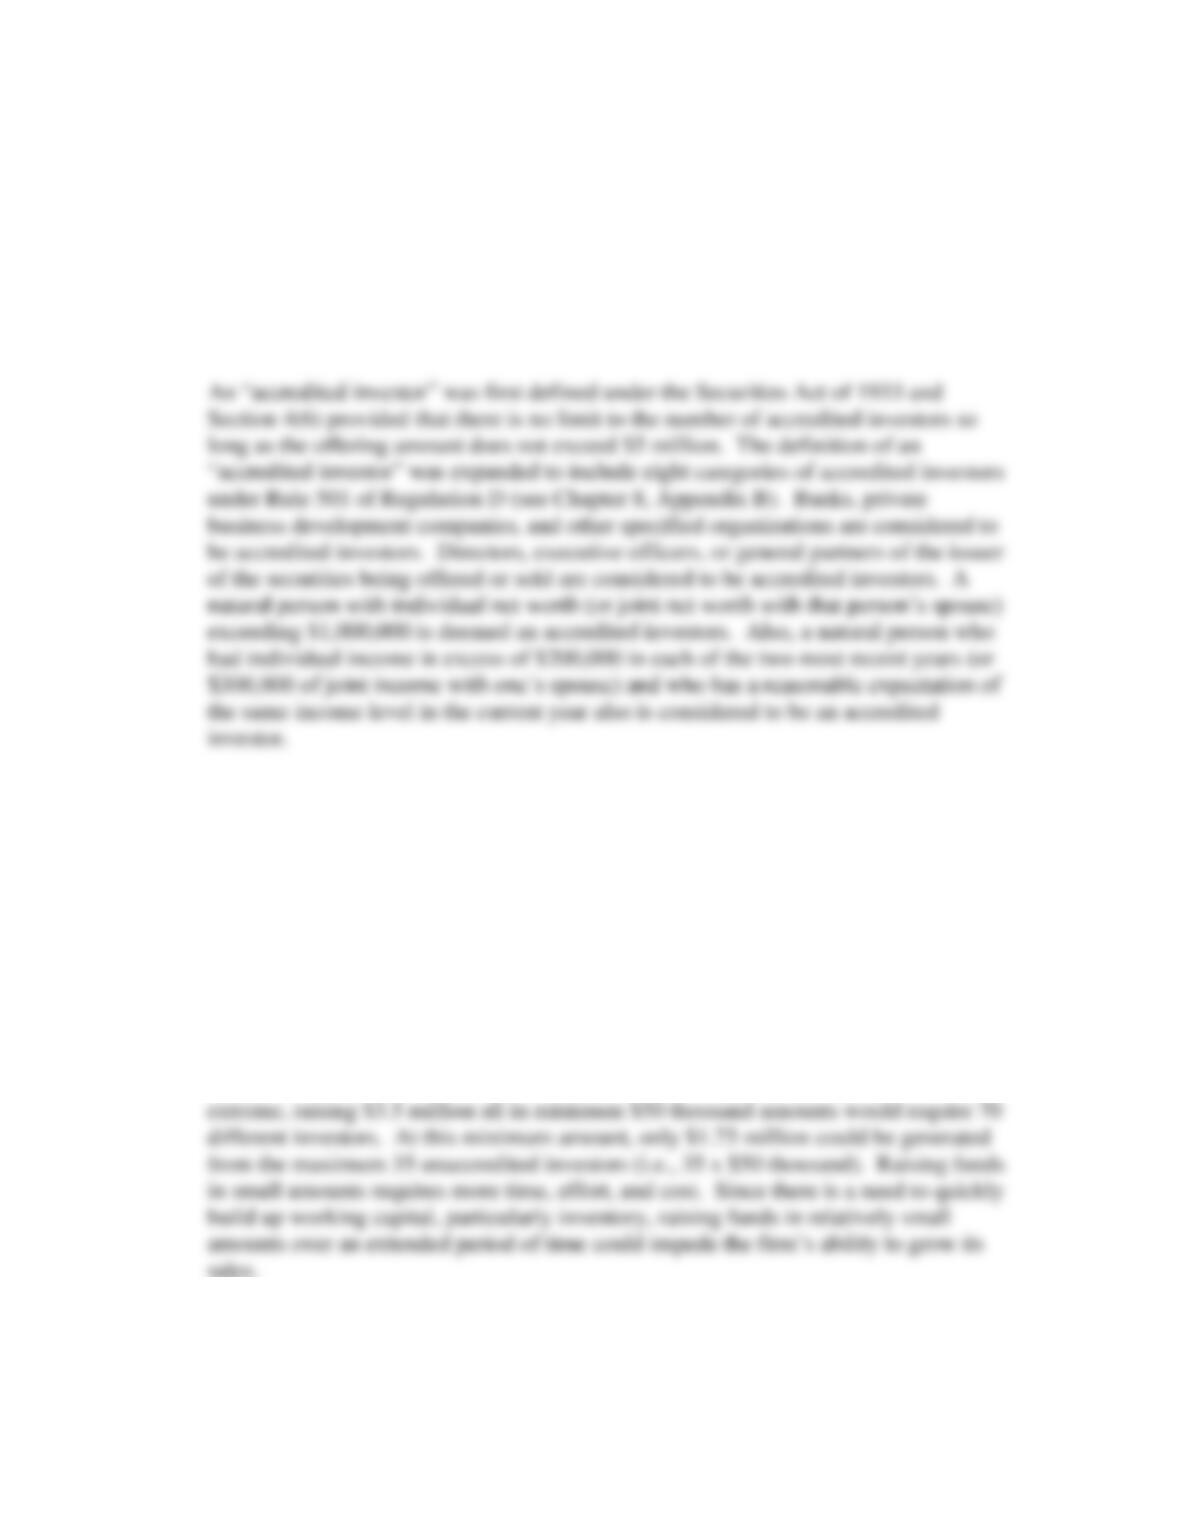
Actual Percent Forecast Forecast Forecast
Liabilities and Equity 2007 of Sales 2008 2008 2008
Current Liabilities
Accounts Payable & Accrued Expenses 568,131 5.2% 0.052 x sales forecast 1,144,000 1,820,000 2,340,000
Accrued Payroll & Payroll Taxes 6,712 0.1% 0.001 x sales forecast 22,000 35,000 45,000
Accrued Vacation 39,865 0.4% 0.004 x sales forecast 88,000 140,000 180,000
Lines of Credit 2,843,242 26.2% *0.262 x sales forecast 5,764,000 9,170,000 11,790,000
Current Portion of Long-Term Debt 39,356 0.4% 0.004 x sales forecast 88,000 140,000 180,000
Current Portion of Capital Leases 37,919 0.3% 0.003 x sales forecast 66,000 105,000 135,000
Common Stock, $.001 Par Value
50,000,000 Shares Authorized
16,935,000 Shares Issued & Outstanding 156,300 1.4% Held Constant 156,300 156,300 156,300
Preferred Stock, $.001 Par Value
1,750,000 Shares Authorized
1,366,666 Shares Issued & Outstanding 0 Held Constant 0 0 0
Notes on Projected Financial Statements
Income Statement:
*Salaries and Wages--reduced by 25% from the 16.4% 2007 relationship to reflect expected economies
*Selling and Marketing Expenses--increased 4 times the .4% 2007 relationship to reflect the need for higher expenditures
*Interest Expense was projected at one-half the 2007 percent of sales rate due to a likely slower growth rate for interest-bearing debt
*Assumes 35% Tax Rate for 2008 projections (Deferred Taxes were not projected due to insufficient data)
Balance Sheet:
*Property and Equipment was reduced to two-thirds of 2007 rate due to production being outsourced
*Lines of Credit were increased with sales under the assumption they would be available to finance working capital
*Additional Financing Needed is the amount of long-term debt and equity funds needed to finance projected sales growth
Capstone Case 1: Eco-Products, Inc.
1. What is meant by a Regulation D offering? What is an accredited investor and how
many investors can participate in the PPM? [You may wish to review materials from
Chapter 8 and its appendices when answering these PPM-related questions.]
Regulation D (or Reg D) is a registration that offers a safe harbor from registration of
securities with the SEC. Due to uncertainty about what constitutes a nonpublic
offering, the SEC provided some “safe–harbor” conditions that will result in
guaranteed exemption as a private placement.
There is no limit as to the number of investors (accredited or unaccredited) under Reg
D: Rule 504 which has an offering limit of $1 million. Under Reg D: Rule 505
(offering limit of $5 million) and Reg D: Rule 506 (no offering limit) there may be a
maximum of 35 unaccredited investors but no limit on the number of accredited
investors.
2. Considering the planned use of proceeds, discuss the pros and cons of trying to raise
$3,500,000 in increments as small as $50,000 each.
A $3.5 million private placement memorandum fall under Reg D: Rule 505 which has
a $5 million offering limit in a 12-month period. While there is no limit on the
number of accredited investors, there is a limit of 35 unaccredited investors. At the
Capstone Case 1: Eco-Products, Inc.
3. Summarize the risk factors listed by management in the Private Placement
Memorandum. Which factors do you believe are the most crucial in determining the
future success of Eco-Products?
Appendix A provides excerpts for Eco-Products 2007 Private Placement
Memorandum. Risk factors include:
a) Need for new product development
b) Being subject to patent infringement laws
c) Reliance on importing products from overseas suppliers
d) Competition will continue to increase
Supply chain-related risks (availability to obtain raw materials and reliance on importing
products from overseas suppliers), the need for new product development, and increasing
I. Identify and discuss the factors and developments that led to the previously unexpected
revenue growth during the first-half of 2008 by Eco-Products. Is such growth likely to be
sustainable in the near future? What possible developments might interrupt or change
this rapid rate of sales growth?
In mid-2007, management forecasted full-year 2007 sales to be $9.2 million with a sales
forecast of $22 million for 2008 (refer to Exhibit 1). Then, the “perfect storm” hit. Oil
prices spiked to new heights and general awareness of environmental issues intensified.