16. [Enterprise Valuation Method] The Datametrix Corporation has been in operation
for one full year (2019). Financial statements are shown below. Sales are expected
to grow at a 30 percent annual rate for each of the next three years (2020, 2021, and
2022) before settling down to a long-run growth rate of 7 percent annually. The cost
of goods sold is expected to vary with sales. Operating expenses are expected to
grow at 75 percent of the sales growth rate (i.e., be semi-fixed) for the next three
years before again growing at the same rate as sales beginning in 2023. Interest
expense is expected to grow with sales. Depreciation can be forecasted either as a
Solutions:
See spreadsheet solutions presented below.
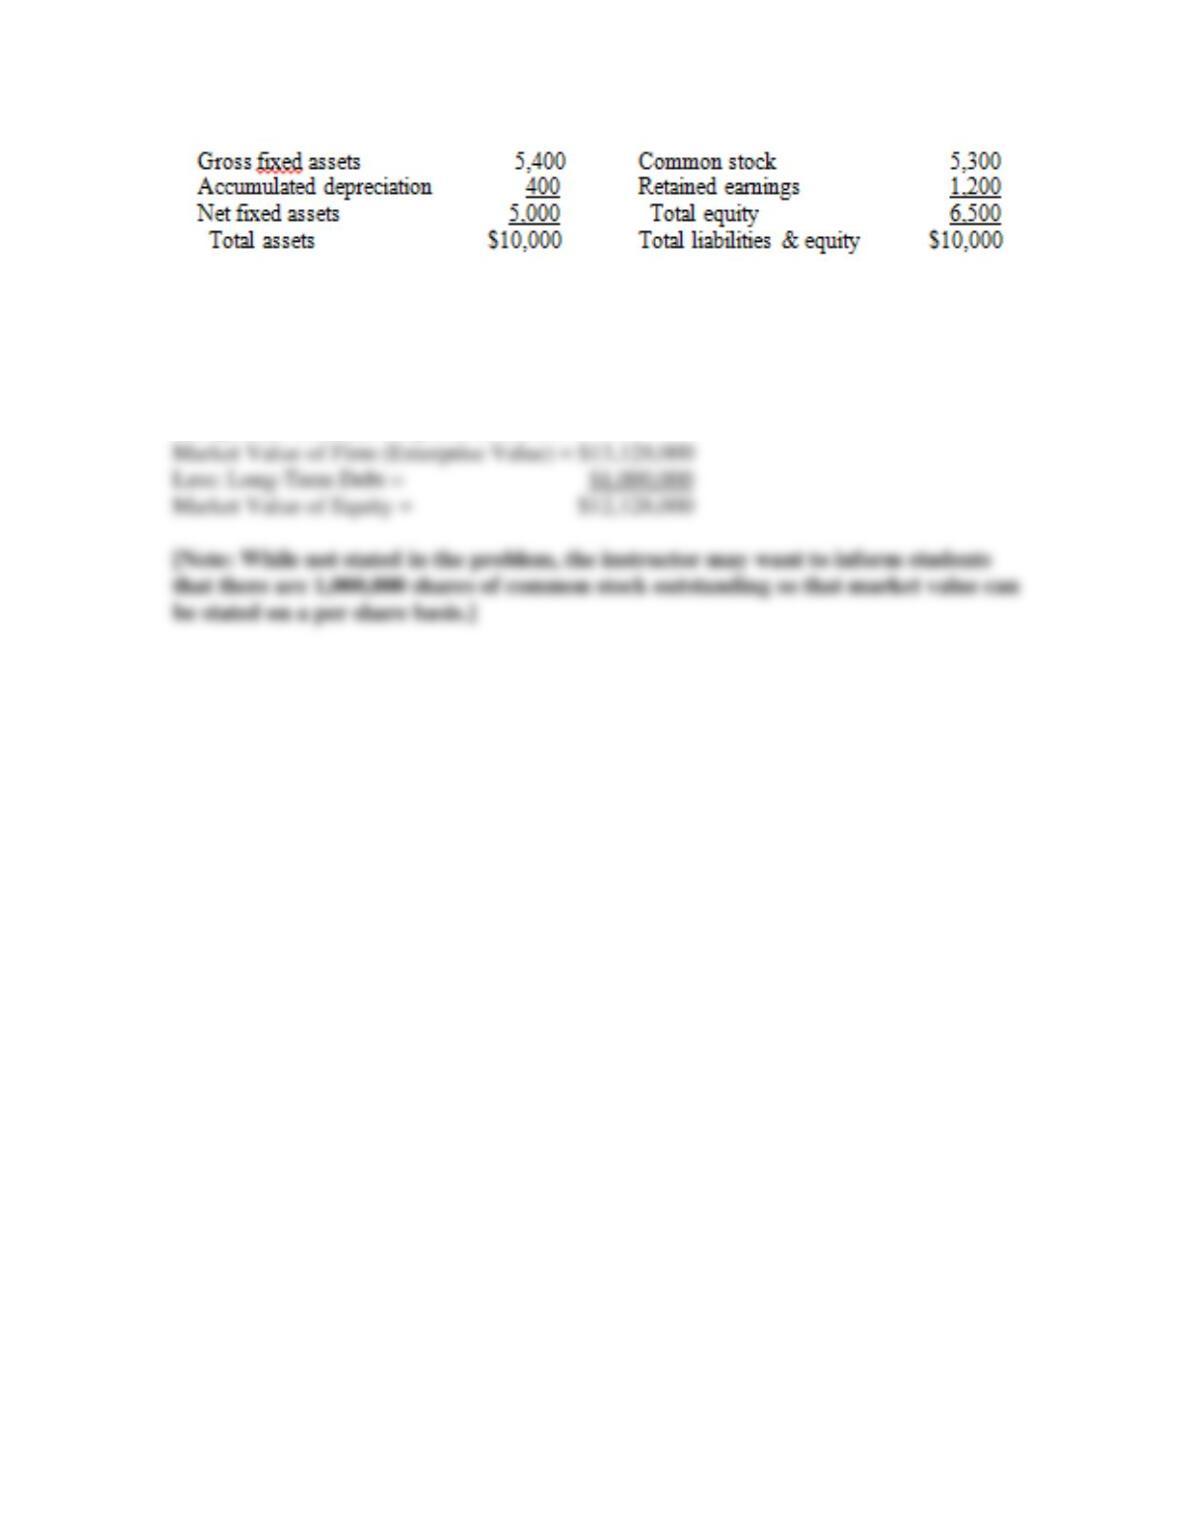
Thus, assuming 1,000,000 shares of stock are outstanding, results in a per share value =
$12.13.
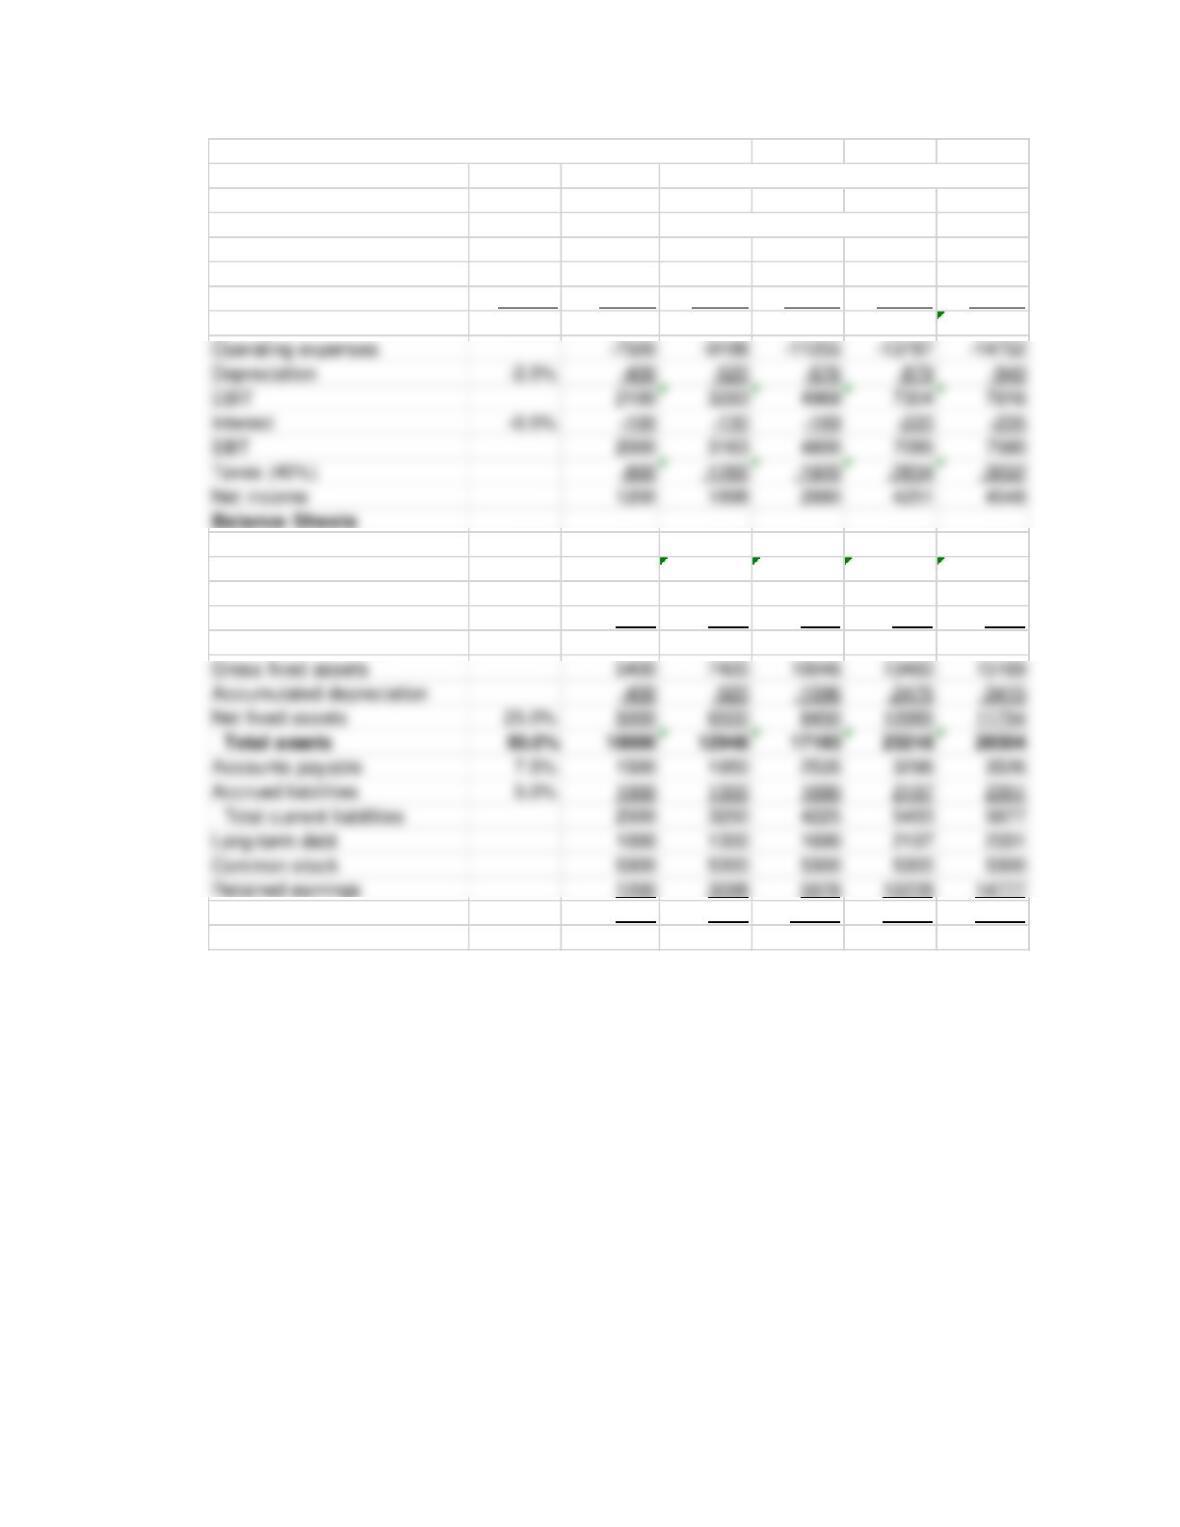
DATAMETRIX, INC. [Enterprise Valuation Method]
Ch 14, Prob 16 Actual Projected —————————————————————>I
Percent Sales Increase-––––-> 30.0% 30.0% 30.0% 7.0%
% of 2019 [Thousands of Dollars]
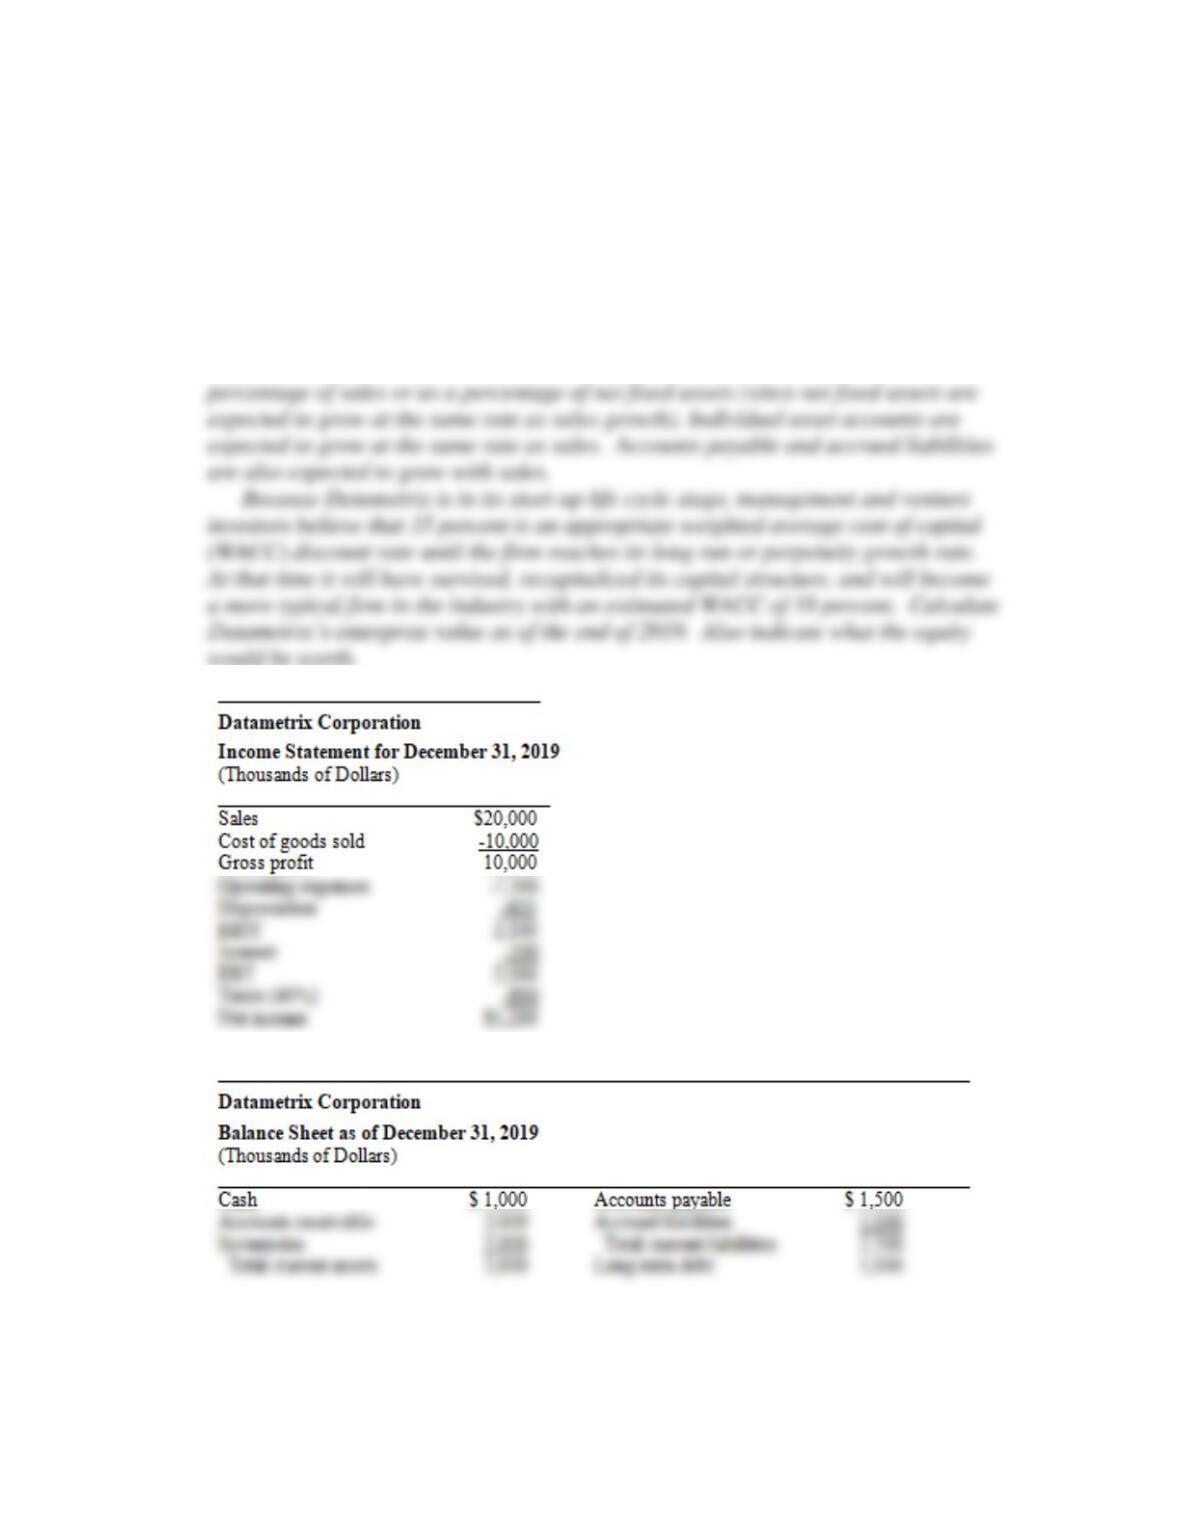
Income Statements Sales 2019 2020 2021 2022 2023
Sales 100.0% 20000 26000 33800 43940 47016
Cost of goods sold –50.0% –10000 –13000 –16900 –21970 –23508
Gross profit 50.0% 10000 13000 16900 21970 23508
Cash 5.0% 1000 1300 1690 2197 2351
Surplus cash 0 –53 293 1248 4797
Accounts receivable 10.0% 2000 2600 3380 4394 4702
Inventories 10.0% 2000 2600 3380 4394 4702
Total current assets 5000 6448 8743 12233 16550
Total equity 6500 8398 11278 15528 20077
Total liabilities & equity 10000 12948 17193 23218 28304
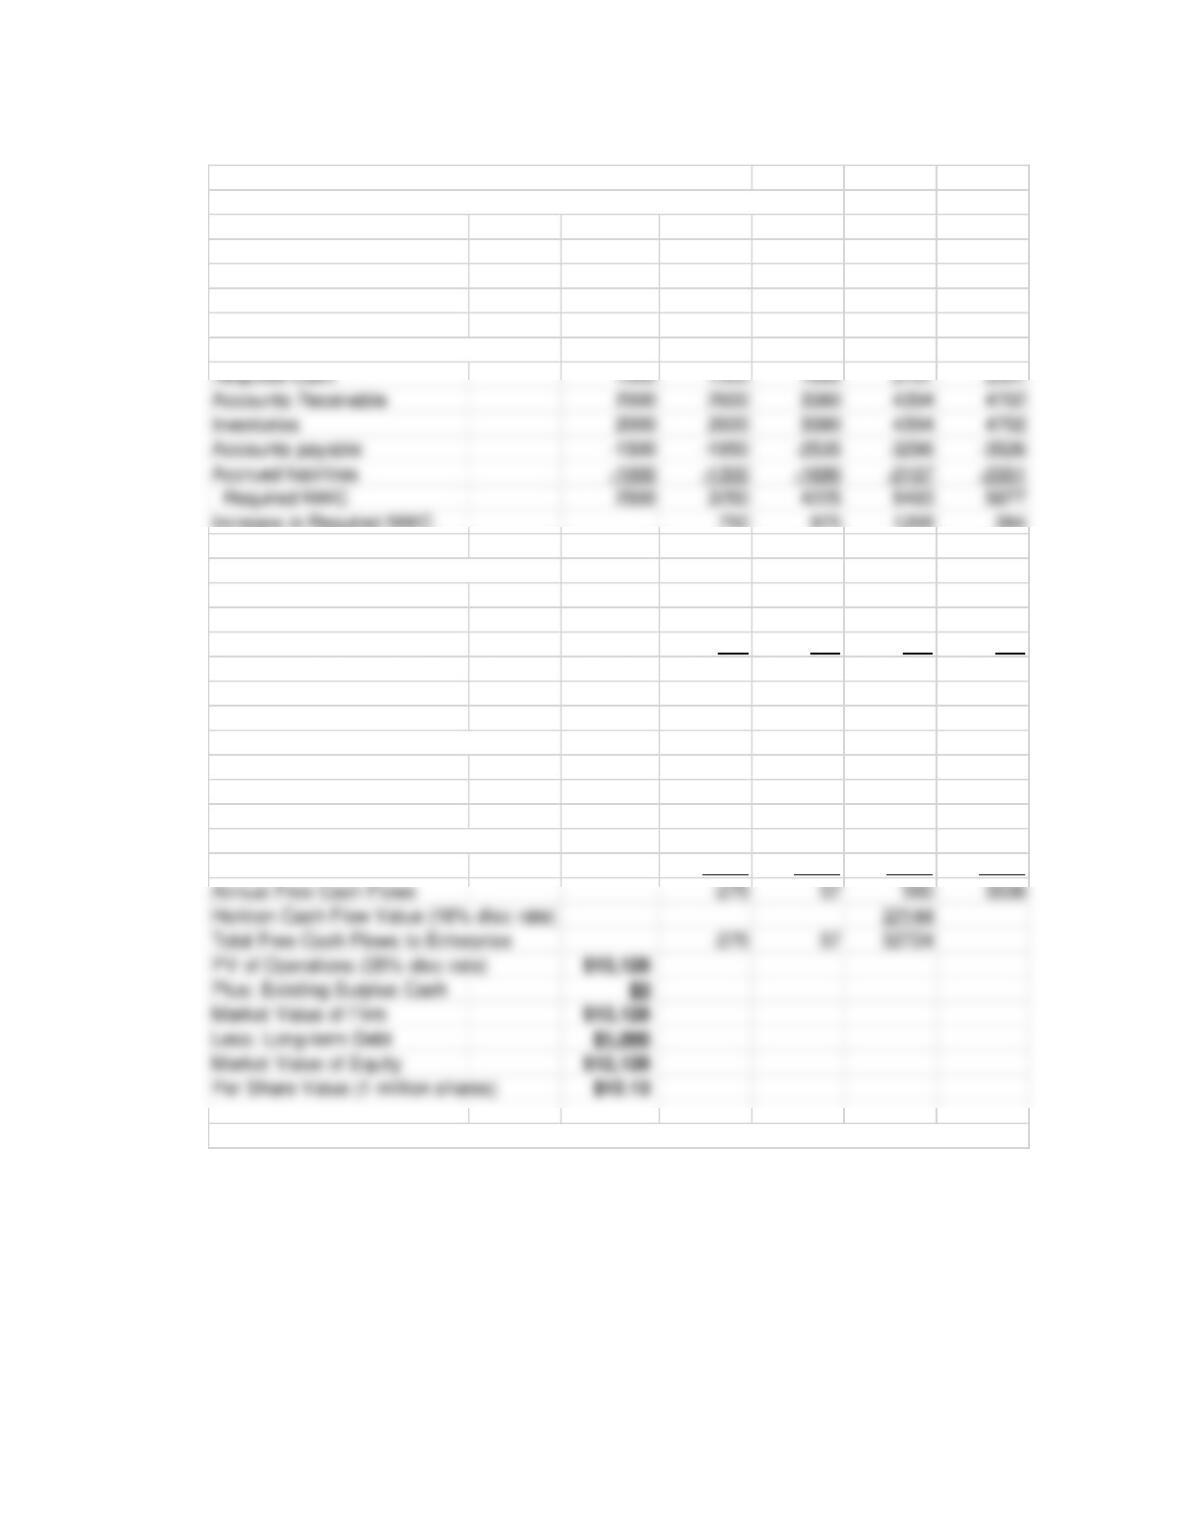
DATAMETRIX, INC. [Enterprise Valuation Method]
Work Sheet for Estimating Free Cash Flows to the Enterprise:
2019 2020 2021 2022 2023
Income Statement Flows:
NOPAT 1976 2982 4383 4689
Depreciation 520 676 879 940
Required Net Working Capital:
Increase in Required NWC 750 975 1268 384
Capital Expenditures (CAPEX):
Net fixed assets 5000 6500 8450 10985 11754
Increase in net fixed assets 1500 1950 2535 769
Depreciation 520 676 879 940
Increase in gross fixed assets 2020 2626 3414 1709
Free Cash Flows to Enterprise:
2019 2020 2021 2022 2023
NOPAT 1976 2982 4383 4689
Plus: Depreciation 520 676 879 940
Less: Increase in Required NWC –750 –975 -1268 –384
Less: CAPEX (Inc in GFA) -2020 –2626 -3414 -1709
Note:To find Per Share Value, students will have to be told there are 1 million shares outstanding.
MINI CASE: WOK YOW IMPORTS, INC.
Wok Yow Imports, Inc., is a rapidly growing, closely held corporation that imports and
sells oriental style furniture and accessories at several retail outlets. The equity owners
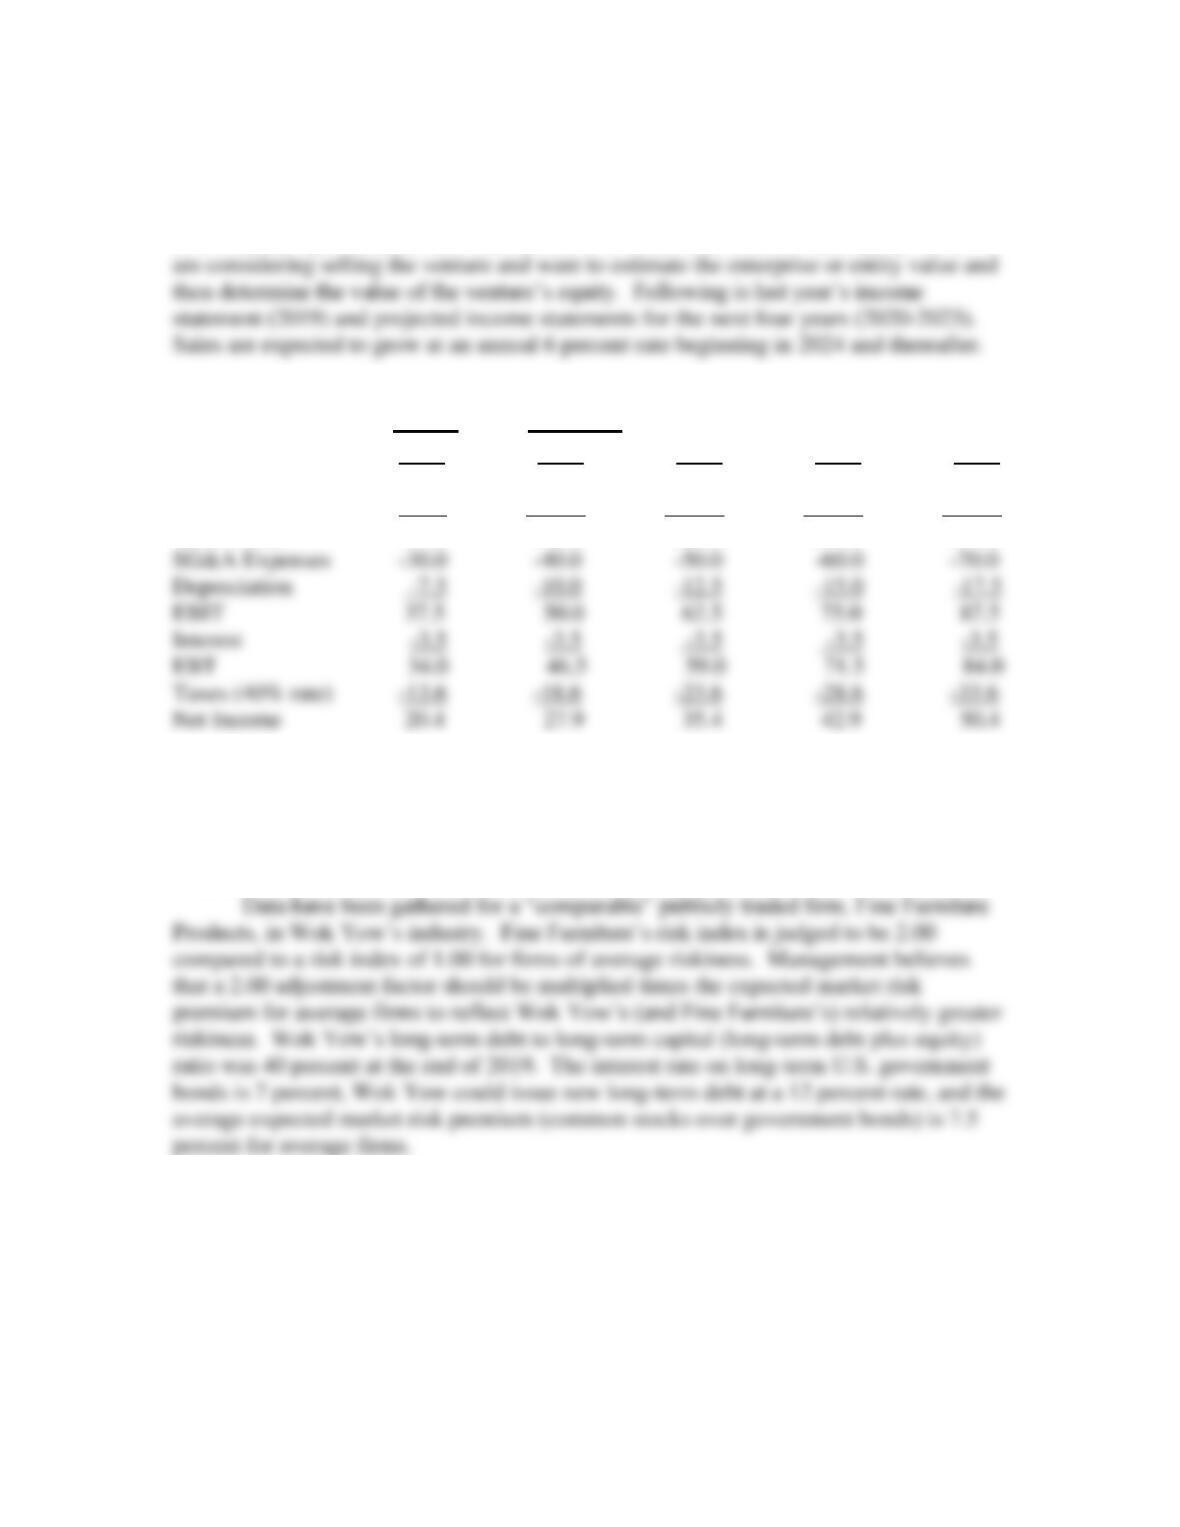
Actual Projected ————————————————
[$ Thousands] 2019 2020 2021 2022 2023
Net Sales $150.0 $200.0 $250.0 $300.0 $350.0
Cost of Goods Sold -75.0 -100.0 -125.0 -150.0 -175.0
Gross Profit 75.0 100.0 125.0 150.0 175.0
SG&A Expenses -30.0 -40.0 -50.0 -60.0 -70.0
Depreciation -7.5 -10.0 -12.5 -15.0 -17.5
EBIT 37.5 50.0 62.5 75.0 87.5
Interest -3.5 -3.5 -3.5 -3.5 -3.5
EBT 34.0 46.5 59.0 71.5 84.0
Taxes (40% rate) -13.6 -18.6 -23.6 -28.6 -33.6
Net Income 20.4 27.9 35.4 42.9 50.4
Selected balance sheet accounts at the end of 2019 are as follows: Required cash,
accounts receivable, and inventories accounts totaled $50,000, net fixed assets were
$50,000, and accounts payable and accruals totaled $25,000. Each of these balance sheet
accounts was expected to grow with sales over time. Long-term debt was $30,000 and
there were 10,000 shares of common stock outstanding at the end of 2019.
A. Project Wok Yow’s net operating profit after-tax (NOPAT) statements for 2020-
2024.
The NOPAT results are shown below in the spreadsheet solution. NOPAT
amounts were: 30.0 (2020), 37.5 (2021), 45.0 (2022), 52.5 (2023), and 55.7
(2024).
B. Determine the annual increases in required net working capital and capital
expenditures (CAPEX) for Wok Yow for the years 2020 through 2024.
Results are shown below in the spreadsheet solution. The increases in RNWC
C. Project annual operating free cash flows to the entity for the years 2020 through
2024.
Results are shown below in the spreadsheet solution. Operating free cash flows
D. Management initially thought that an 18 percent discount rate was reasonable.
Estimating an appropriate required rate of return on an equity investment is
critical to the valuation effort. For very early stage ventures, various VC “rules-of
E. Use the information from Part D above to estimate Wok Yow’s terminal value
cash flow at the end of 2023.
The terminal value cash flow is estimated to be 376.3 and is calculated by
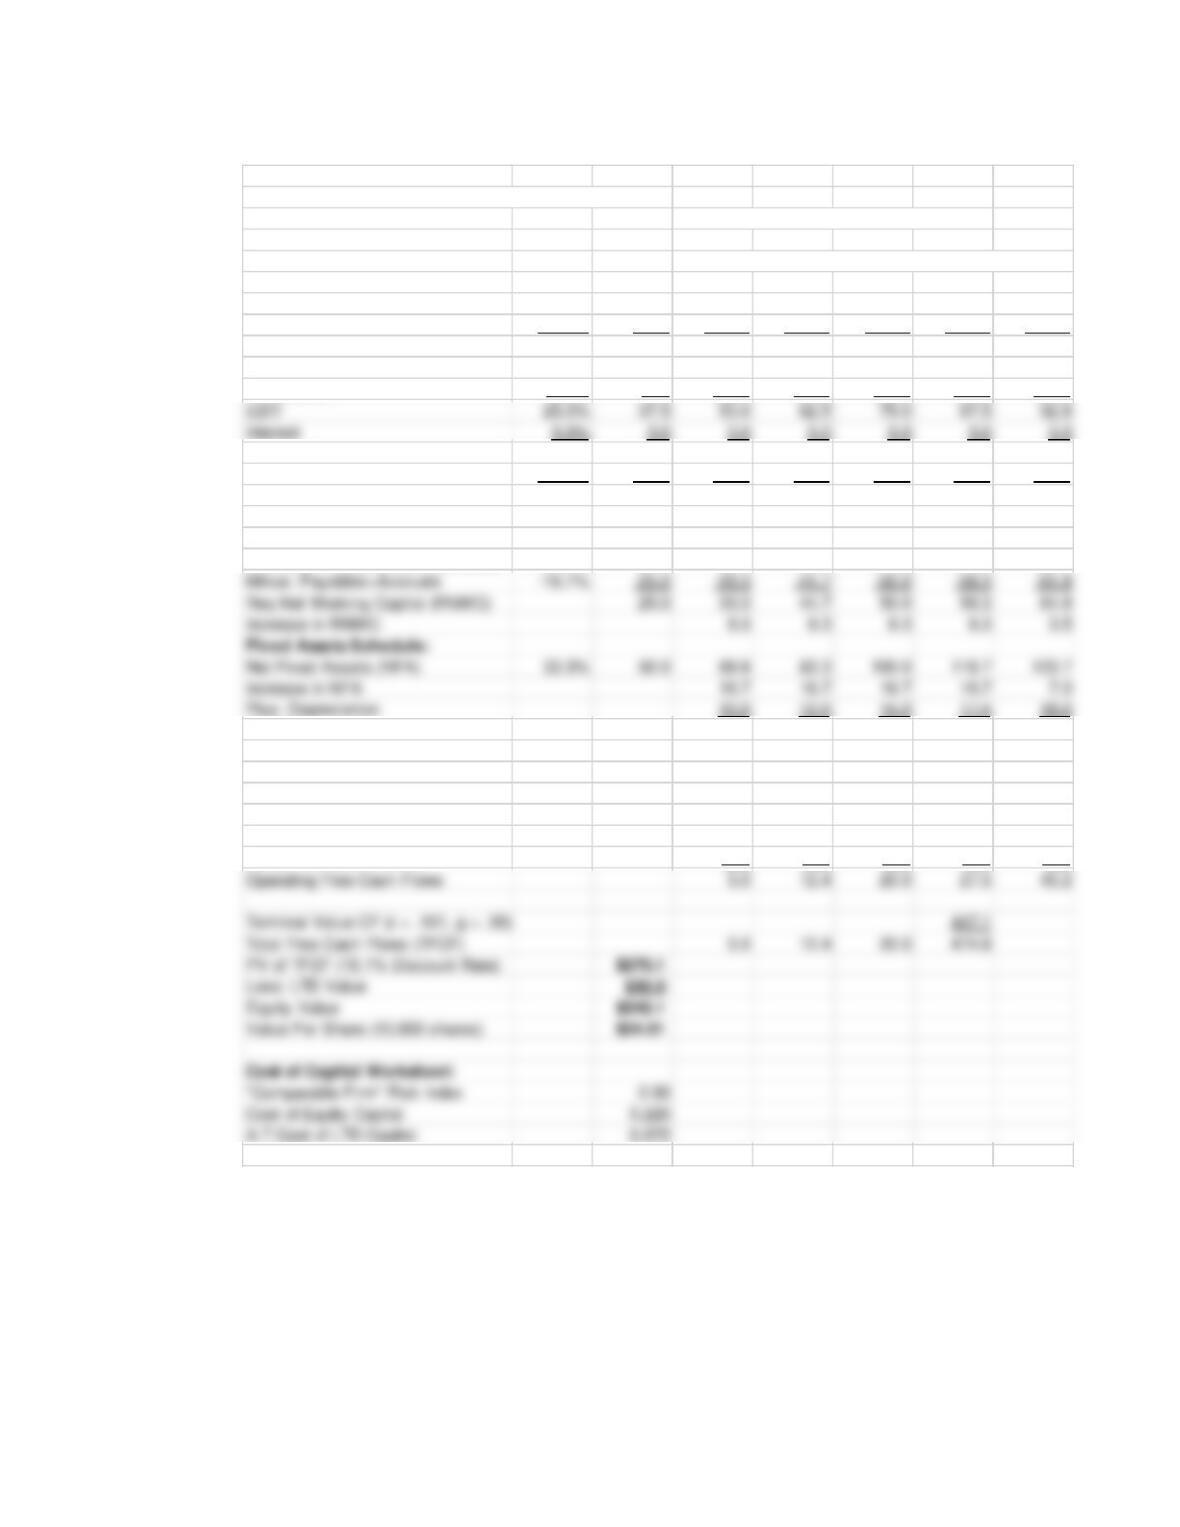
F. Estimate the firm’s enterprise or entity value at the end of 2019.
The enterprise or entity value at the end of 2019 is estimated to be 233.6
(thousands of dollars). See the spreadsheet solution presented below.
G. Adjust the enterprise value to determine Wok Yow’s equity value in dollars and on
a per share basis at the end of 2019.
H. Now, estimate Wok Yow’s after-tax cost of long-term debt. Use the risk free rate,
the expected market risk premium, and the risk index for the Fine Furniture
Company to estimate Wok Yow’s cost of equity capital. Determine Wok Yow’s
weighted average cost of capital (WACC).
Cost of common equity capital = 7% + (7.5%)2.00 = 7% + 15% = 22%
I. Re–estimate Wok Yow’s enterprise value using the WACC calculated in Part H.
Then, adjust the enterprise value to determine Wok Yow’s equity value in dollars
and on a per share basis at the end of 2019.
Revised terminal value = $447.1 [i.e., actually $45.152/(.161 – .06)]
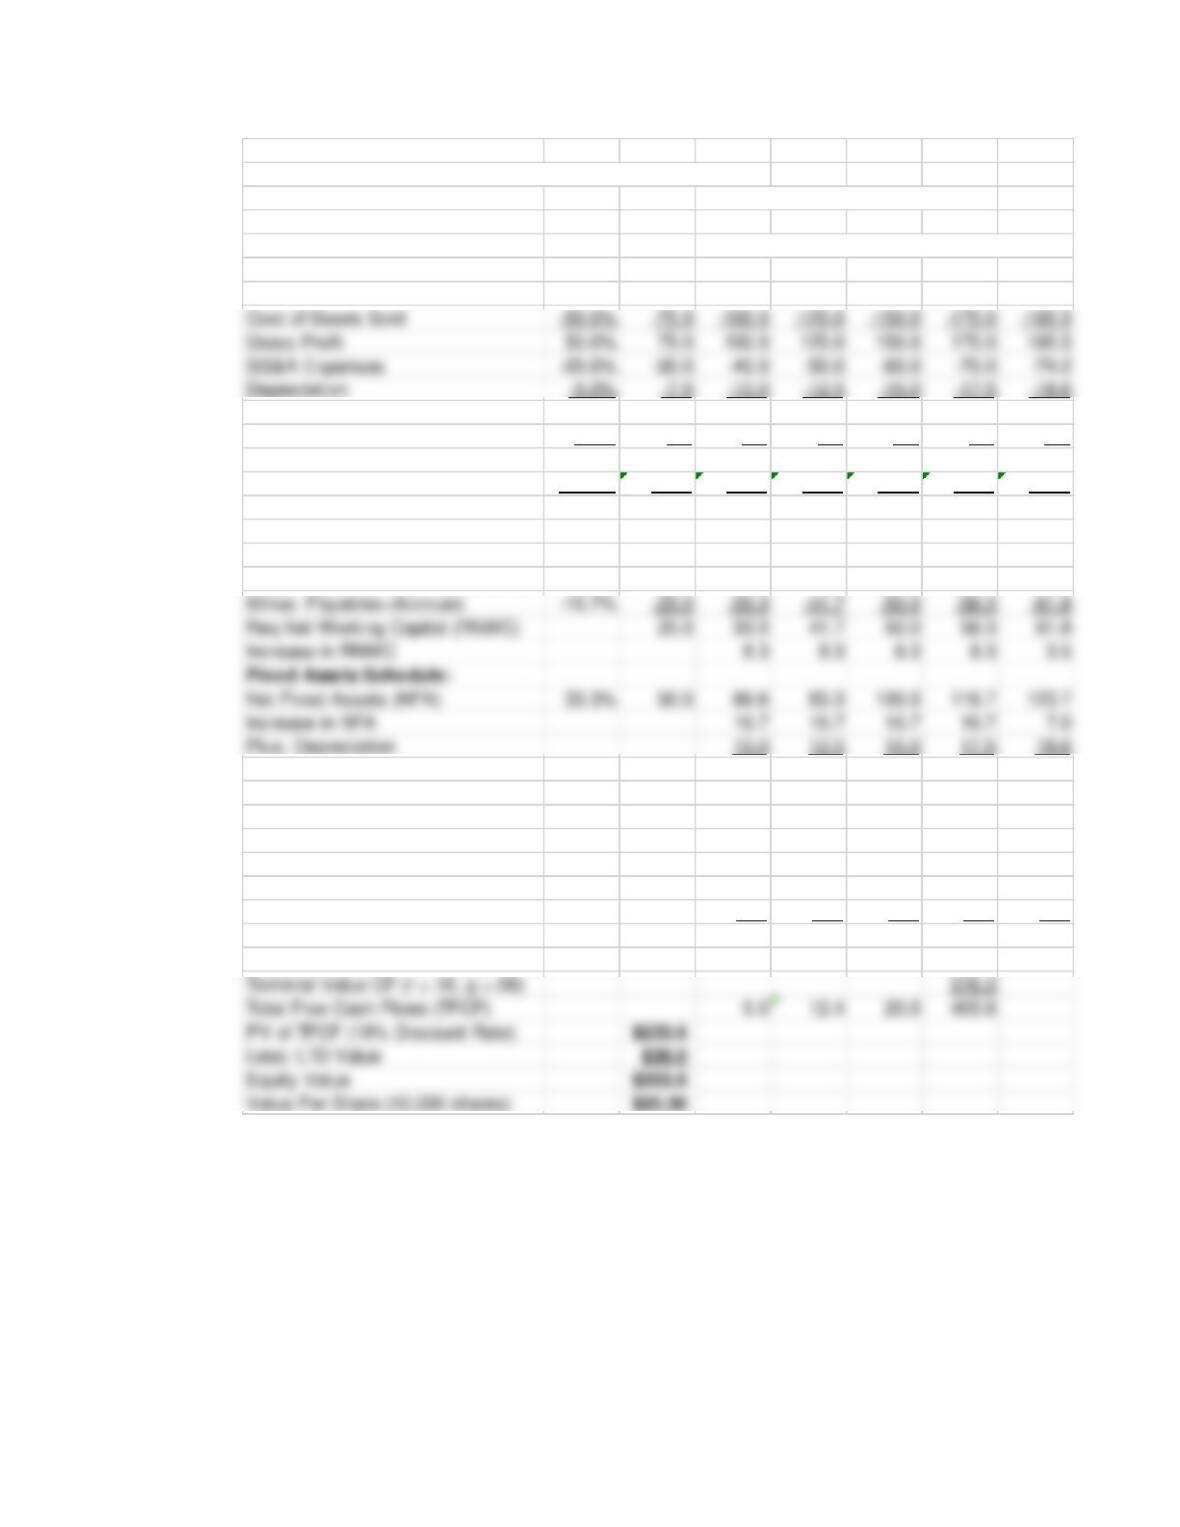
WOK YOW IMPORTS, INC.
Enterprise (Entity) Valuation Solution [Parts A through G]:
Chapter 14 Mini Case Percent Change in Net Sales
% of 33.3% 25.0% 20.0% 16.7% 6.0%
[Thousands of Dollars] 2019 Actual Pro forma —————————————————————–
NOPAT Statements Sales 2019 2020 2021 2022 2023 2024
Net Sales 100.0% 150.0 200.0 250.0 300.0 350.0 371.0
EBIT 25.0% 37.5 50.0 62.5 75.0 87.5 92.8
Interest 0.0% 0.0 0.0 0.0 0.0 0.0 0.0
EBT 25.0% 37.5 50.0 62.5 75.0 87.5 92.8
Taxes (40% rate) -10.0% –15.0 -20.0 -25.0 -30.0 -35.0 -37.1
NOPAT 15.0% 22.5 30.0 37.5 45.0 52.5 55.7
Required Net Working Capital:
Req Cash+Receivables+Inventories 33.3% 50.0 66.7 83.3 100.0 116.7 123.7
CAPEX 26.7 29.2 31.7 34.2 25.5
Free Cash Flows to Entity:
NOPAT 30.0 37.5 45.0 52.5 55.7
Plus: Depreciation 10.0 12.5 15.0 17.5 18.6
Minus: CAPEX -26.7 -29.2 -31.7 -34.2 -25.5
Minus: Increase in NWC -8.3 –8.3 -8.3 -8.3 -3.5
Operating Free Cash Flows 5.0 12.4 20.0 27.5 45.2
WOK YOW IMPORTS, INC.
Enterprise (Entity) Valuation Solution [Parts H and I]:
Percent Change in Net Sales
% of 33.3% 25.0% 20.0% 16.7% 6.0%
[Thousands of Dollars] 2019 Actual Pro forma ———————————————————–
NOPAT Statements Sales 2019 2020 2021 2022 2023 2024
Net Sales 100.0% 150.0 200.0 250.0 300.0 350.0 371.0
Cost of Goods Sold -50.0% –75.0 -100.0 -125.0 -150.0 -175.0 -185.5
Gross Profit 50.0% 75.0 100.0 125.0 150.0 175.0 185.5
SG&A Expenses -20.0% –30.0 -40.0 –50.0 –60.0 –70.0 –74.2
Depreciation -5.0% –7.5 -10.0 -12.5 -15.0 -17.5 -18.6
EBT 25.0% 37.5 50.0 62.5 75.0 87.5 92.8
Taxes (40% rate) -10.0% -15.0 -20.0 -25.0 -30.0 -35.0 -37.1
NOPAT 15.0% 22.5 30.0 37.5 45.0 52.5 55.7
Required Net Working Capital:
Req Cash+Receivables+Inventories 33.3% 50.0 66.7 83.3 100.0 116.7 123.7
CAPEX 26.7 29.2 31.7 34.2 25.5
Free Cash Flows to Entity:
NOPAT 30.0 37.5 45.0 52.5 55.7
Plus: Depreciation 10.0 12.5 15.0 17.5 18.6
Minus: CAPEX -26.7 –29.2 –31.7 –34.2 -25.5
Minus: Increase in NWC -8.3 -8.3 -8.3 -8.3 -3.5
WACC 0.161
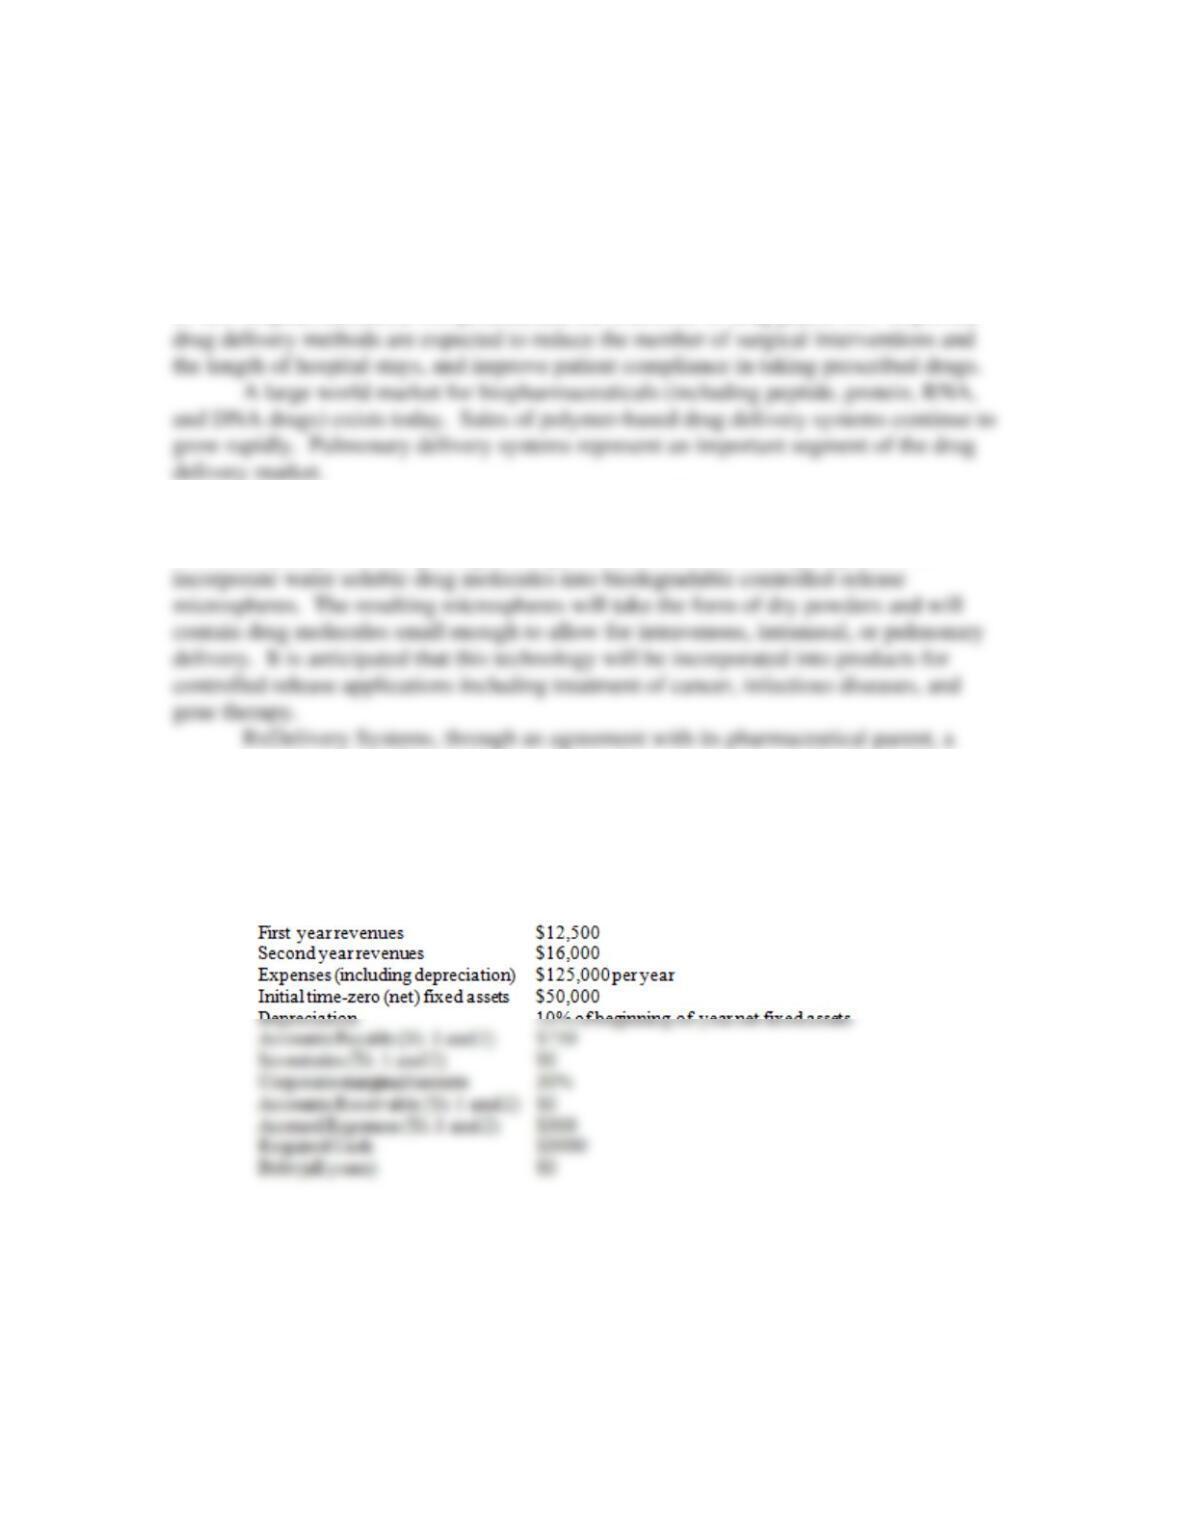
MINI CASE 2: RxDELIVERY SYSTEMS, INC. (Revisited)
RxDelivery Systems is an R&D venture specializing in the development and testing of
new drug delivery technologies. The market for alternative drug delivery systems grew
rapidly during the past several years. Driving factors behind this growth include efforts
to reduce drug side effects through site-specific delivery, the need to maintain the activity
RxDelivery Systems believes it can compete effectively in both the polymer-
based and pulmonary drug delivery areas. The venture’s delivery technology is expected
to utilize hydrophobic ion pairing and supercritical carbon dioxide precipitation to
major drug company, will initially operate as an independent corporation but will be
merged into the parent at the end of its second year. At that time, RxDelivery Systems’
entrepreneurial team will be paid a lump sum of $2,500,000 as the terminal value for the
venture. Following are limited financial statement projections for the next two years for
the RxDelivery Systems Corporation:
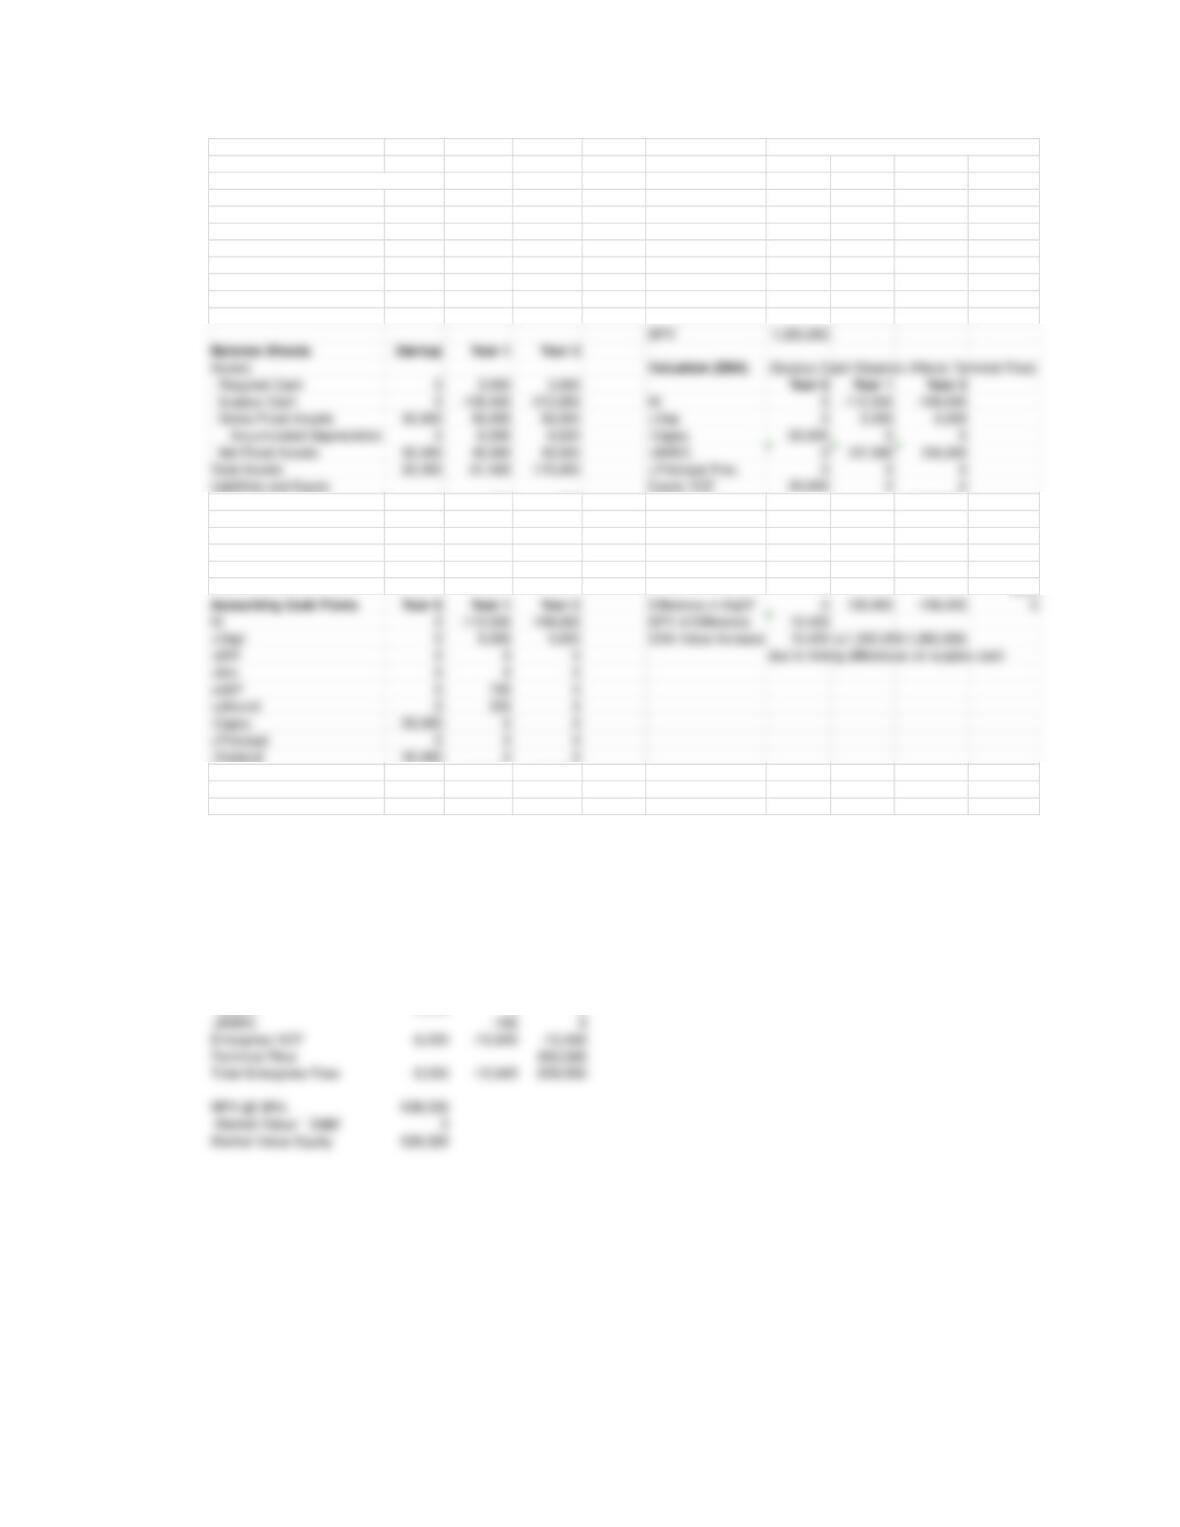
A. Construct the venture’s balance sheet at startup. Then construct financial statements
for Years 1 and 2. [Put initial fixed asset investments in Year 0 and initial working
capital investments in Year 1. Assume the initial $50,000 is equity financed.]
See spreadsheet below.
C. What is the value of the enterprise at time 0 assuming a discount rate of 30%?
The venture has no debt and therefore WACC is the same as the discount rate for
equity.
See spreadsheet below.
E. Why does this value differ from the value for the equity method in the RxDelivery
Systems mini case at the end of Chapter 10?
The venture has no debt and therefore WACC is the same as the discount rate for
The enterprise valuation approach is:
The deferred tax asset (accrued taxes) approach would give the same enterprise
valuation cash flows after adding a tax credit and taking out the investment in a
deferred tax asset.
Income Statements Year 1 Year 2
Valuation (PDM) (Surplus Cash is Zero for Valuation Purposes)
Revenue 12,500 16,000 Year 0 Year 1 Year 2
Expenses Including Depreciation –125,000 -125,000 NI 0 -112,500 -109,000
EBIT -112,500 -109,000 +Dep 0 5,000 4,500
-Interest 0 0 -Capex -50,000 0 0
EBT -112,500 –109,000 –dNWC 0 -1,950 0
– Cash Taxes 0 0 +Principal Proc. 0 0 0
Net Income -112,500 -109,000 Equity VCF -50,000 -109,450 –104,500
Terminal Flow 2,500,000
Depreciation 5,000 4,500 Total Flow -50,000 -109,450 2,395,500
Accounts Payable 750 750 Terminal Flow 2,286,050
Accrued Expenses 300 300 Total Flow -50,000 0 2,286,050
Debt 0 0 0
Equity 50,000 -62,500 -171,500 NPV 1,302,692
Total L+E 50,000 –61,450 -170,450
Acct CF 0 -106,450 -104,500
Beg Cash 0 0 -106,450
End Cash 0 -106,450 -210,950
Enterprise Value Method (Cash Taxes)
EBIT 0 -11,250 -10,900
-tc*EBIT 0 0 0
EBIAT 0 -11,250 -10,900
+Depr 0 500 450