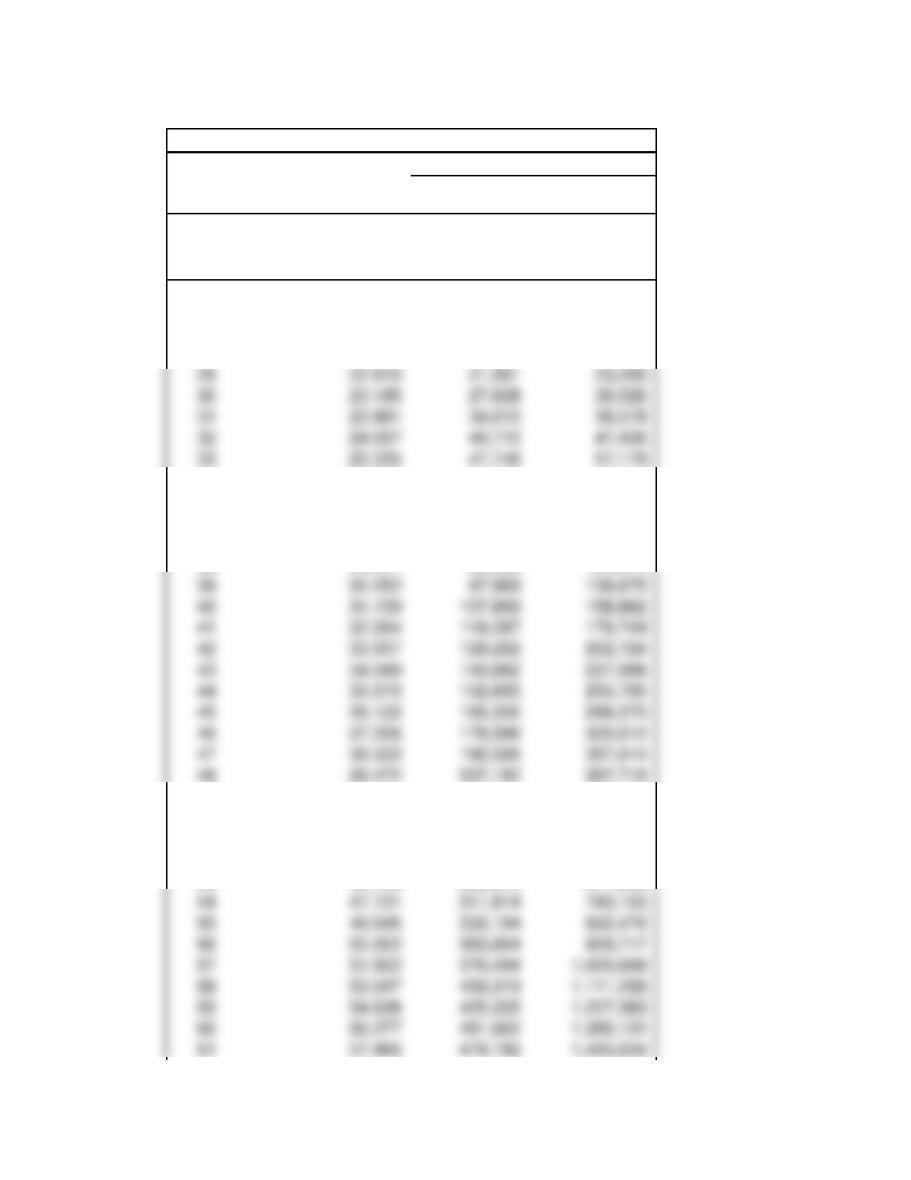
Table 11-2 Retirement Strategies
Age
Annual Income 3%
Inflation Rate
Low-Risk
Strategy (5%)
Bonds
High-Risk
Strategy (10%)
Stock
25 20,000$
26 20,600 5,000$ 5,000$
27 21,218 10,250 10,500
28 21,855 15,763 16,550
34 26,095 55,133 67,897
35 26,878 62,889 79,687
36 27,685 71,034 92,656
37 28,515 79,586 106,921
49 40,656 222,510 442,487
50 41,876 238,635 491,735
51 43,132 255,567 545,909
52 44,426 273,346 605,500
Total Value at Year End
Annual Contribution
$5,000.00

64 63,341 570,475 2,007,239 132778
65 65,241 603,999 2,212,963 0.06
36,240$ 132,778$ 0.06
Retirement Income at 66=

Month
Large
Cap Small Cap International
1 35.45 27.00 29.00
6 35.00 27.60 29.00
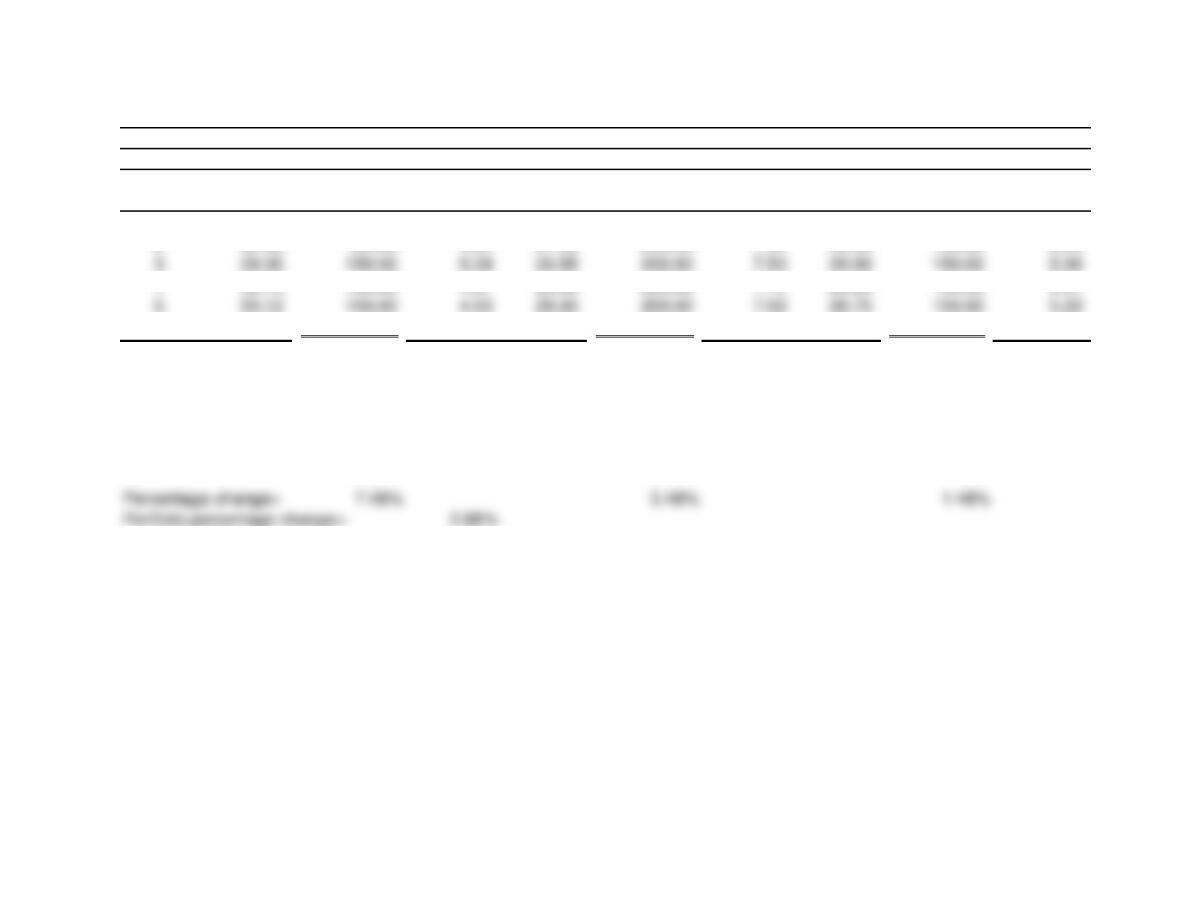
Table 11-3 Price Per Share in Dollars
Month
Large
Cap
Monthly
Investment
Shares
Purchased
Small
Cap
Monthly
Investment
Shares
Purchased
International
Monthly
Investment
Shares
Purchased
1 35.45$ 150.00$ 4.23 27.00$ 200.00$ 7.41 29.00$ 150.00$ 5.17
6 35.00 150.00 4.29 27.60 200.00 7.25 29.00 150.00 5.17
900.00$ 27.64 1,200.00$ 43.69 900.00$ 31.49
Average Price = 32.56$ 27.47$ 28.58$
Portfolio Month 6 967.31$ 1,205.75$ 913.28$
Total Investment 3,000.00$
Total Value 3,086.34$
Solution to Problem 5
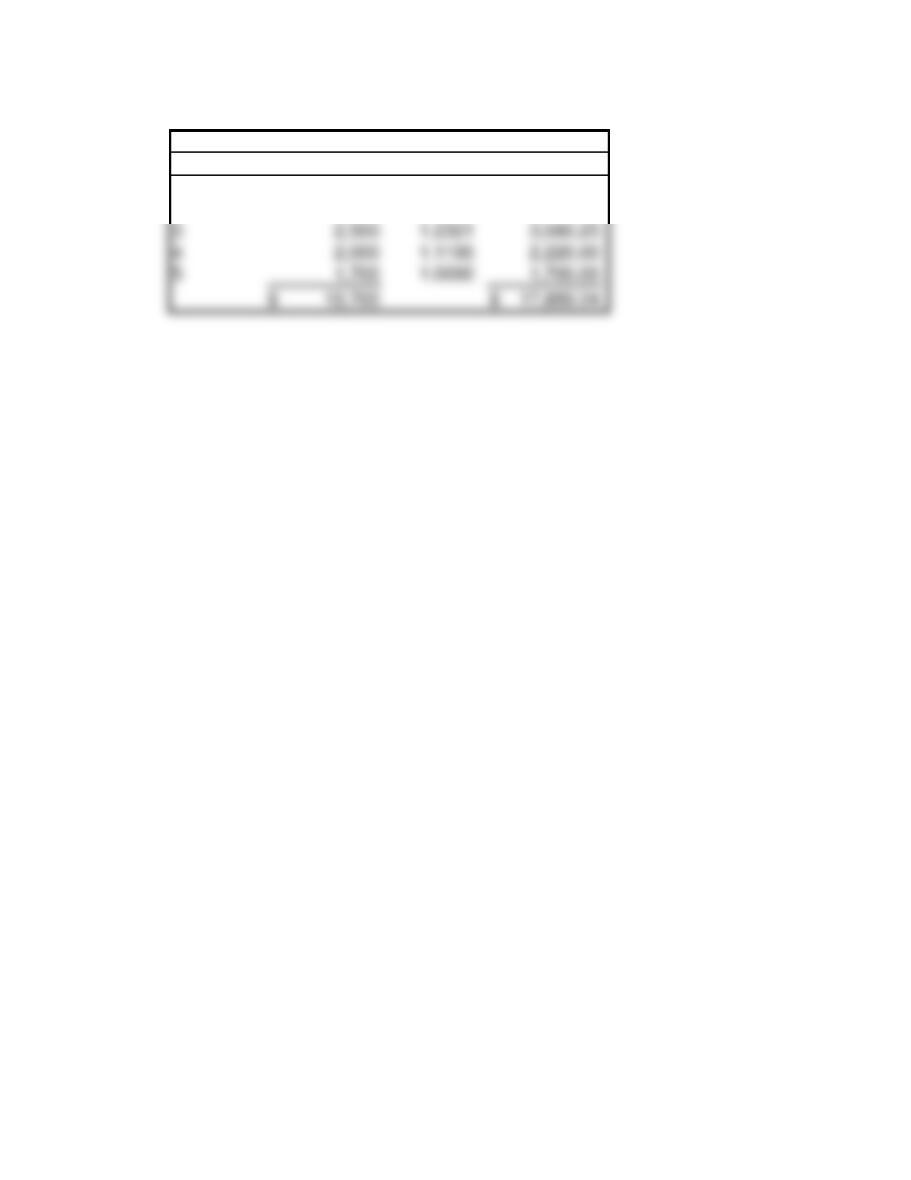
Return= 11.00%
Year Deposit Factor FV
1 $4,000
4,000$ 1.5181 6,072.28$
2 3,500
3,500 1.3676 4,786.71
NOTE: The formulas in Excel uses 10% of the bond price and par value for calculations.
To calculate the bond yield to maturity, enter those items in yellow.
Settlement date:
1/1/2000
Maturity date:
1/1/2020
NOTE: The formulas in Excel uses 10% of the bond price and par value for calculations.
To calculate the current value of a bond, enter those items in yellow.
Settlement Date 1/1/2000
Maturity Date 1/1/2005
Annual coupon rate 6.00%