Chapter 9
1. For the functions f(t)and g(t)sketched as shown,
a) Find x(t) = g(t)∗g(t)by direct integration and sketch the result.
b) Find y(t) = f(t)∗g(t)using appropriate properties of convolution and the
result of part (a). Sketch the result.
c) Find z(t) = f(t)∗f(t−1) using the properties of convolution and sketch the
result.
5
f(t)
g(t)
t
t
1
1
−1
1
1
2
2 3 4
Solution:
a) Using the convolution formula, we have
x(t) = Z∞
−∞
g(τ)g(t−τ)dτ.
Plotting g(τ)and g(t−τ):
1
This result can be expressed in terms of the unit triangle as
b) We can express f(t)in terms of g(t)as :
c) Using the result from part (a) and the shift property, we have
z(t) = f(t)∗f(t−1)
2
2. Given h(t) = u(t)and f(t) = 2△(t
2),
a) Determine y(t) = h(t)∗f(t)and sketch the result.
b) Determine z(t) = h(t)∗df
dt using the derivative property of convolution, and
sketch the result.
c) Calculate z(t) = h(t)∗df
dt using some alternative method (avoiding direct
integration, if you can).
Solution:
a) In the convolution formula we choose to flip simpler function: h(t), then we
3
Therefore,
0, t < −1,
−1+2τ−τ21
0, t ≥1.
Evaluating, we obtain
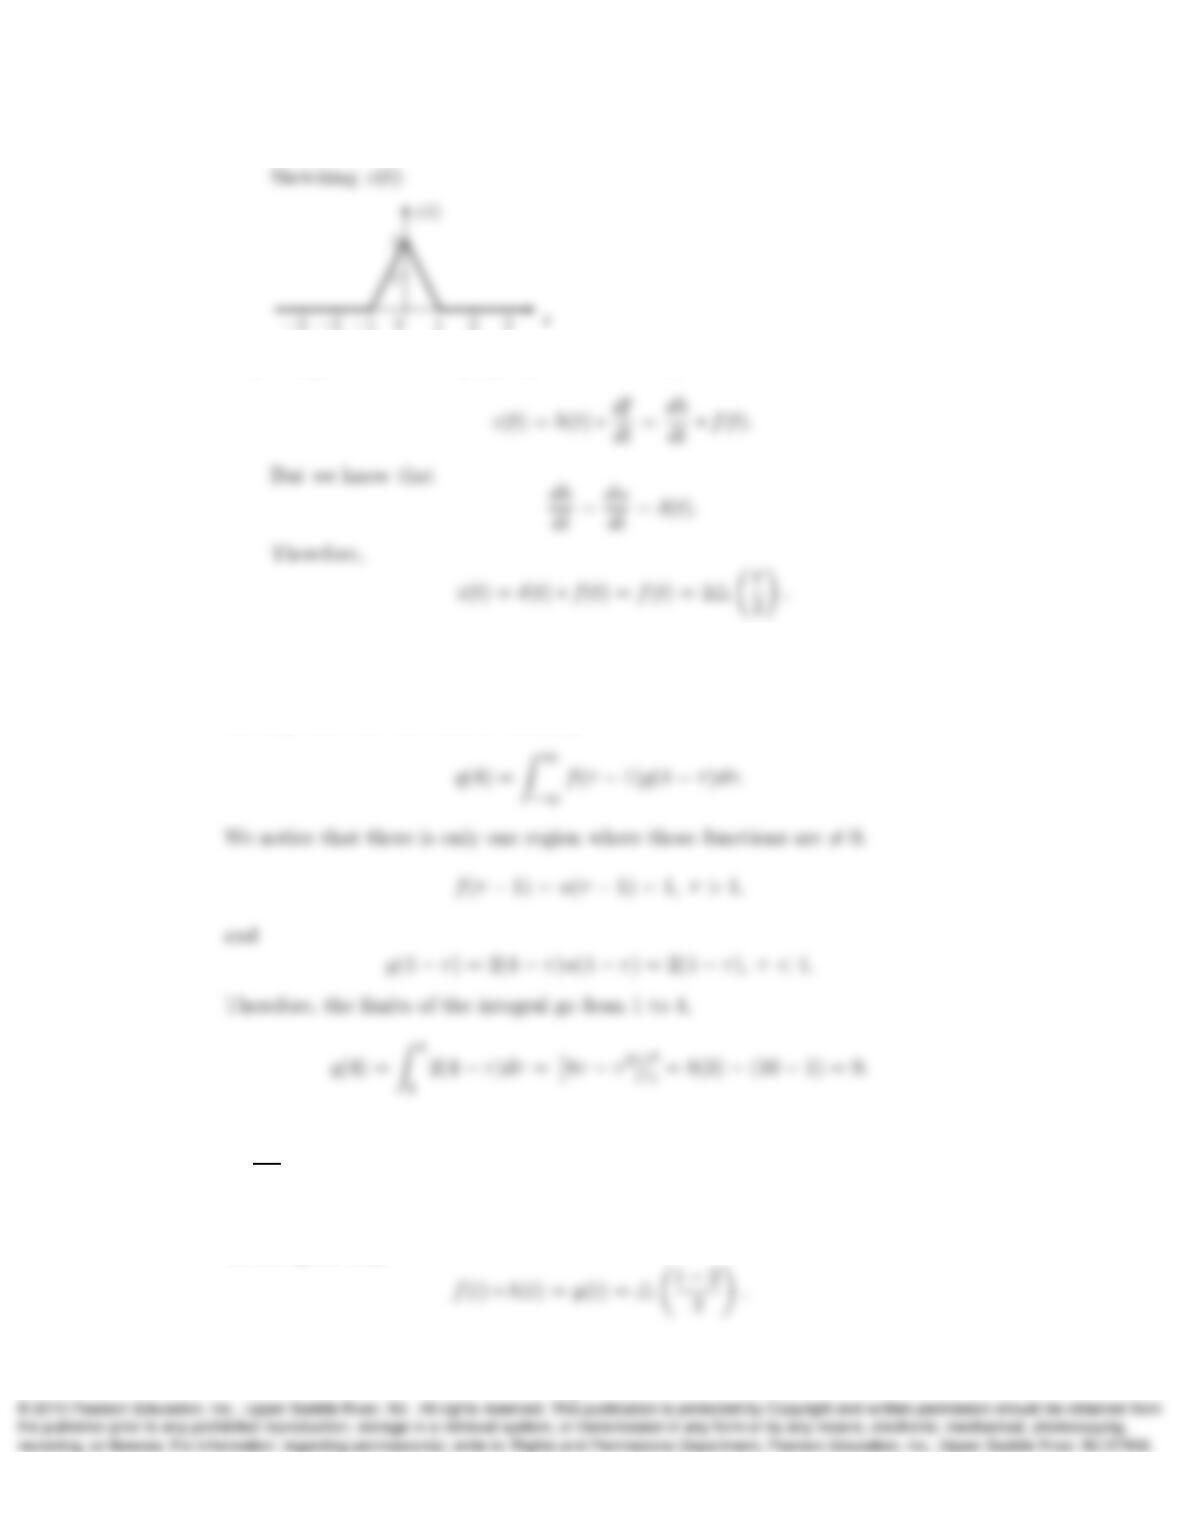
b) Using the derivative property of convolution, we have
4
c) Using the derivative property of convolution, we have
3. Given f(t) = u(t),g(t) = 2tu(t), and q(t) = f(t−1) ∗g(t), determine q(4).
Solution:
Directly from the convolution formula,
4. Suppose that the convolution of f(t) = rect(t)with some h(t)produces y(t) =
△(t−2
2). What is the convolution of rect(t) + rect(t−4) with h(t)−2h(t−6)?
Sketch the result.
Solution:
We are given that
5
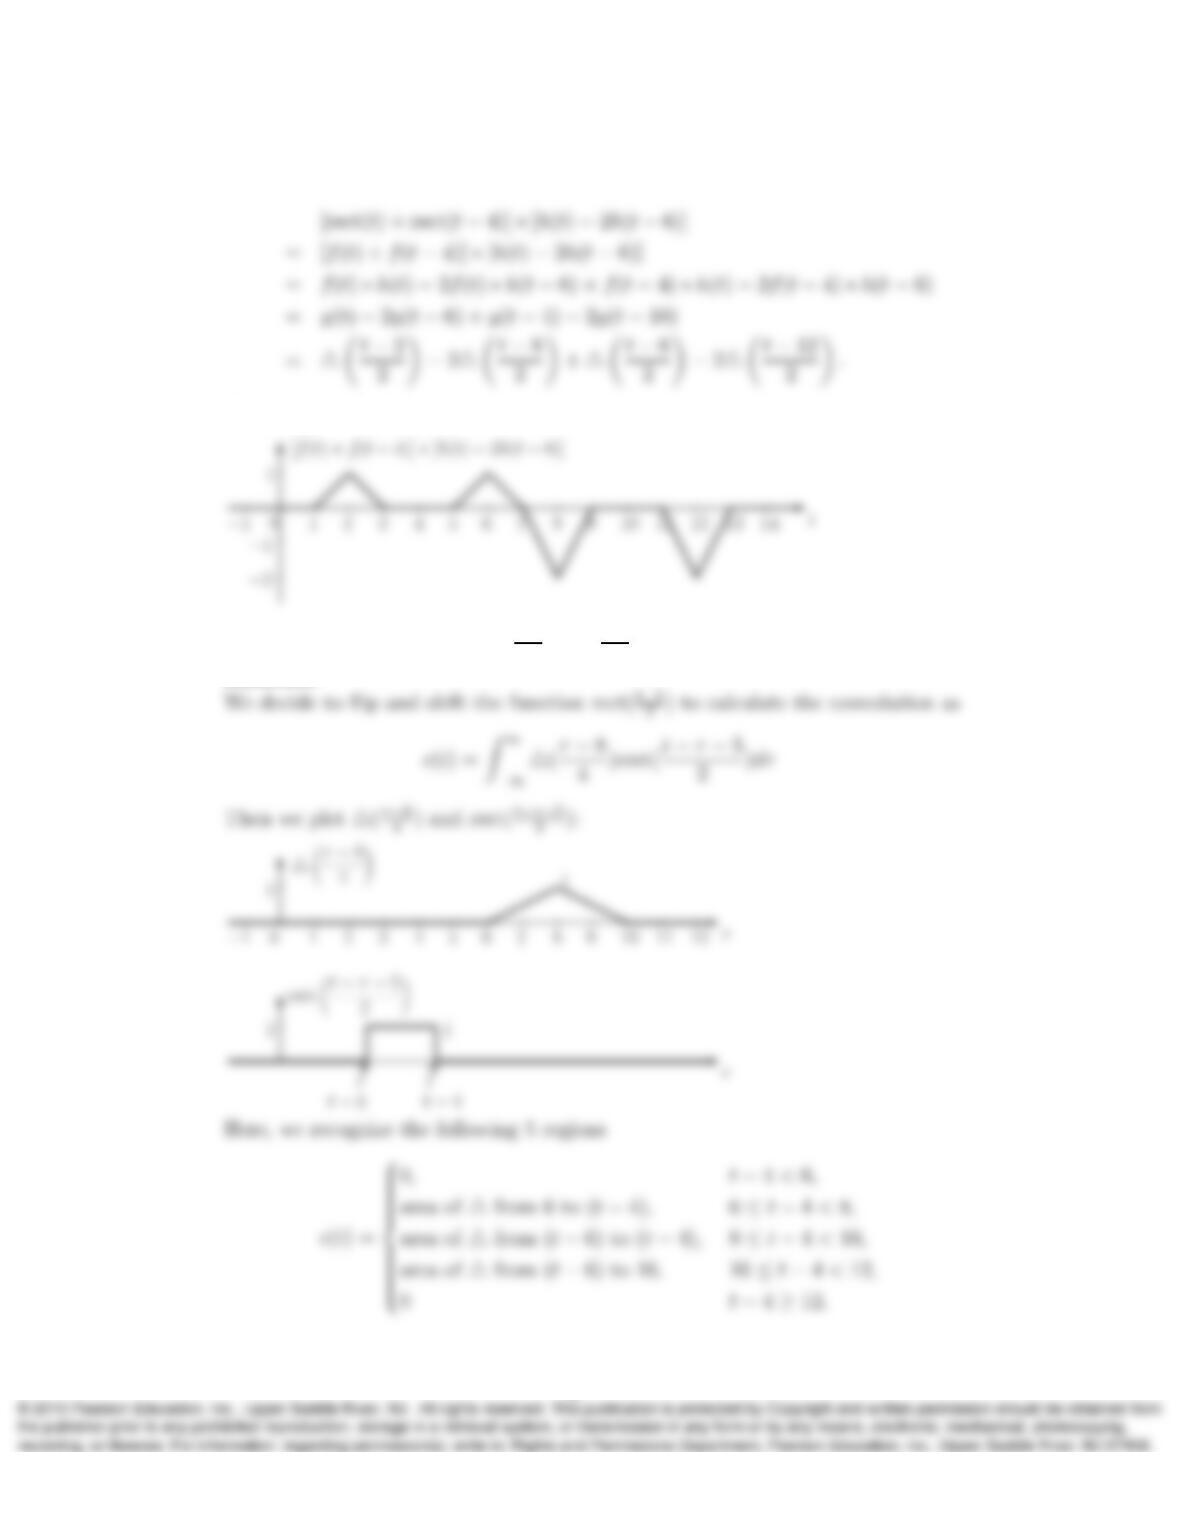
Therefore,
Sketching the result:
5. Determine and plot c(t) = rect(t−5
2)∗ △(t−8
4).
Solution:
6
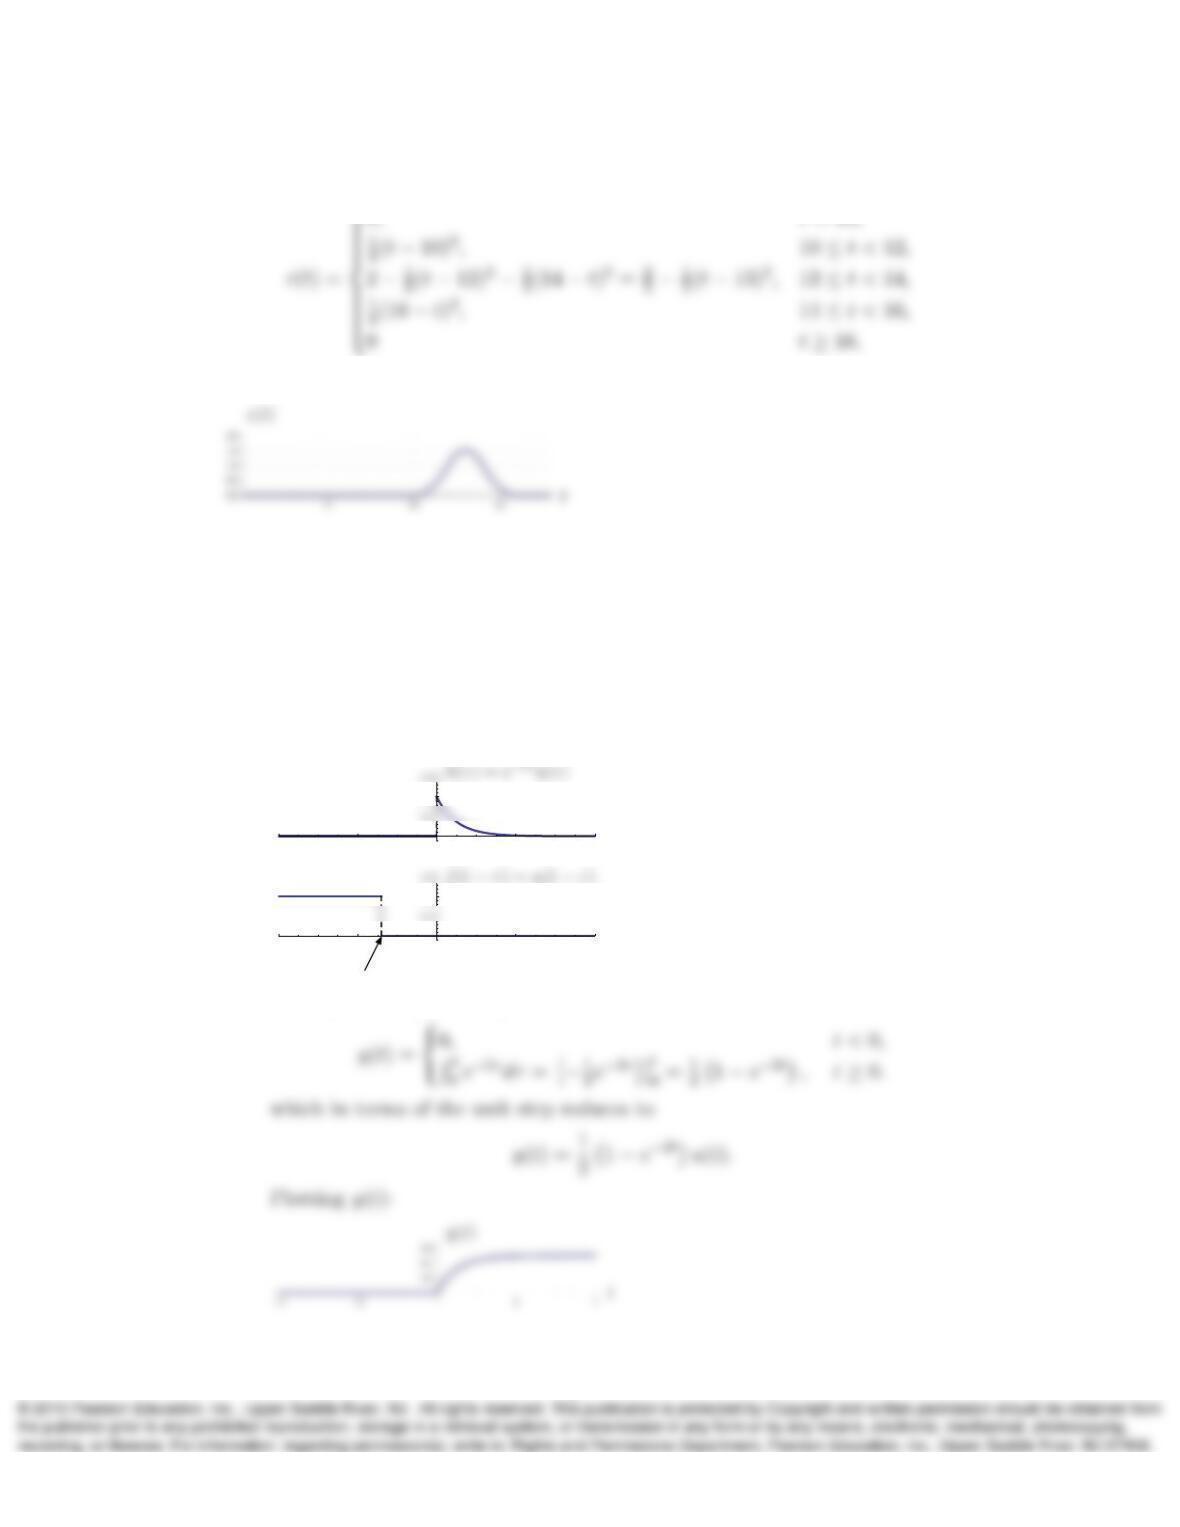
Calculating the areas,
0, t < 10,
Sketching c(t):
6. Determine and plot y(t)=h(t)∗f(t)if
a) h(t) = e−2tu(t)and f(t) = u(t).
b) h(t) = rect(t)and f(t) = u(t)e−t−u(−t)et.
Solution:
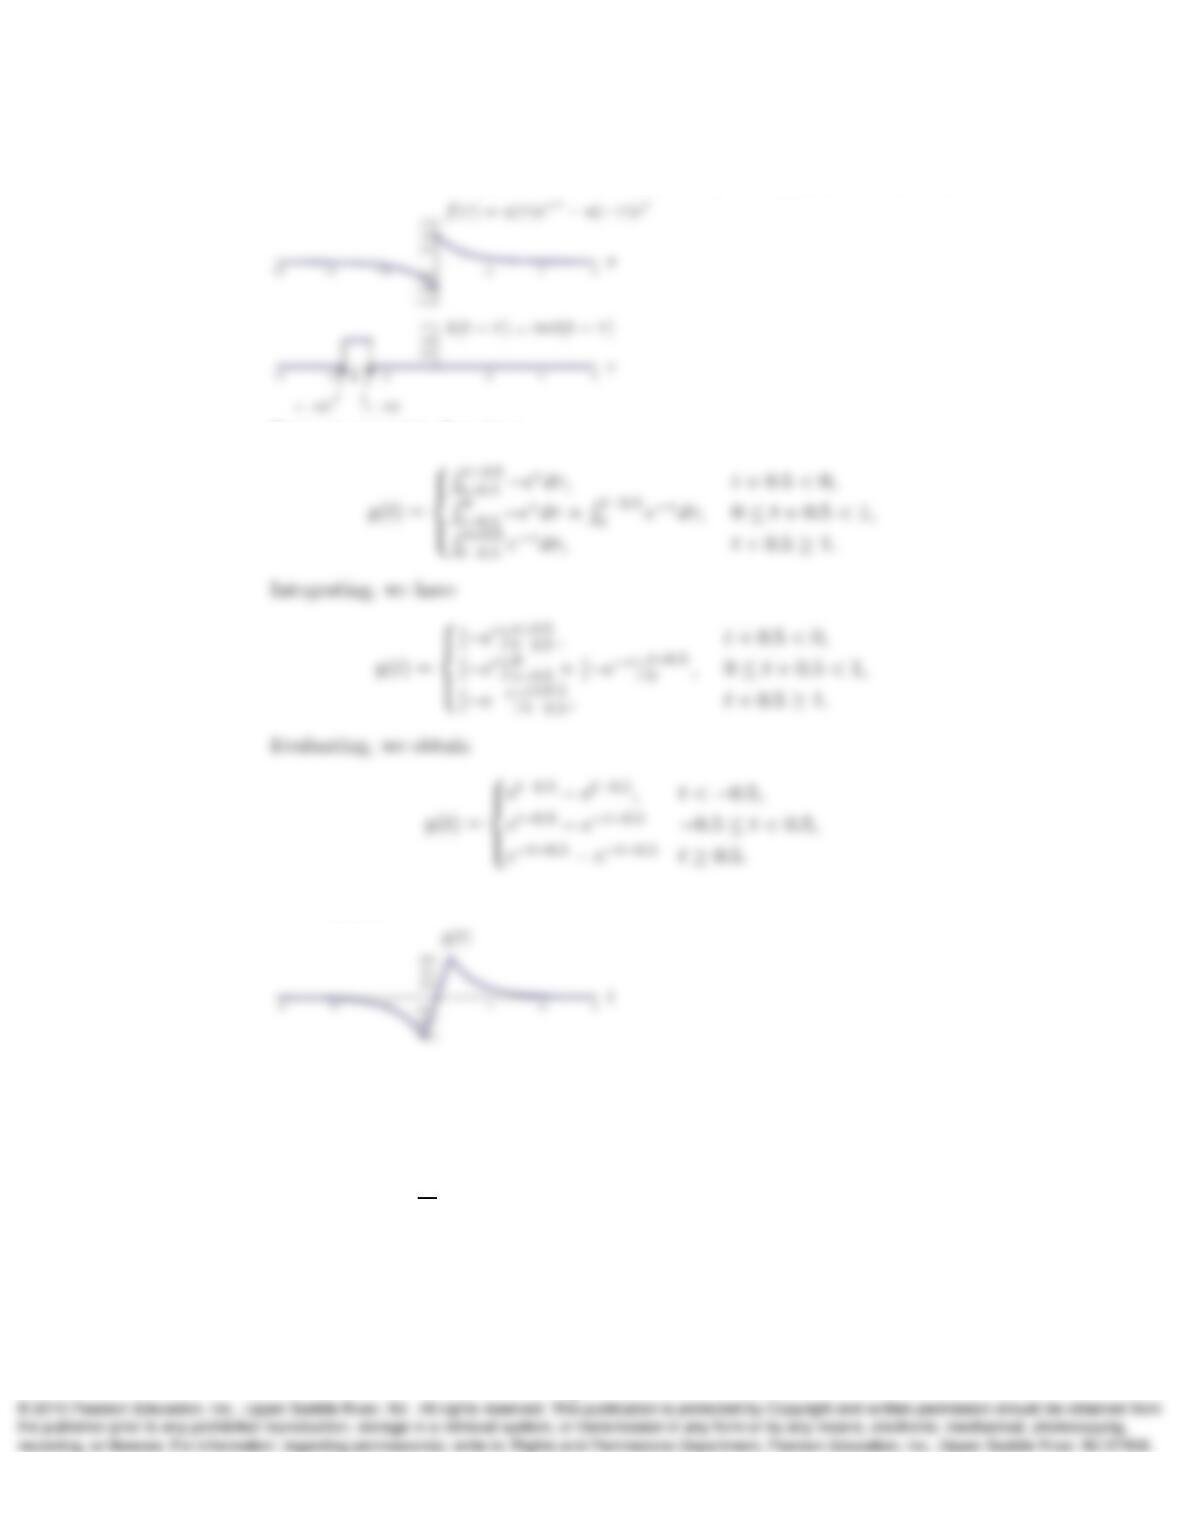
a) For calculating the convolution we flip function f(t), then we have the follow-
ing h(τ)and f(t−τ):
τ
–4
–2
2
4
1.0
–4
–2
2
4
1.0
τ
t
Clearly we recognize 2 regions,
7
b) For this case we will flip the function h(t), then plotting f(τ)and h(t−τ):
Here we recognize 3 regions,
Plotting y(t):
7. Simplify the following expressions involving the impulse and/or shifted impulse and
sketch the results:
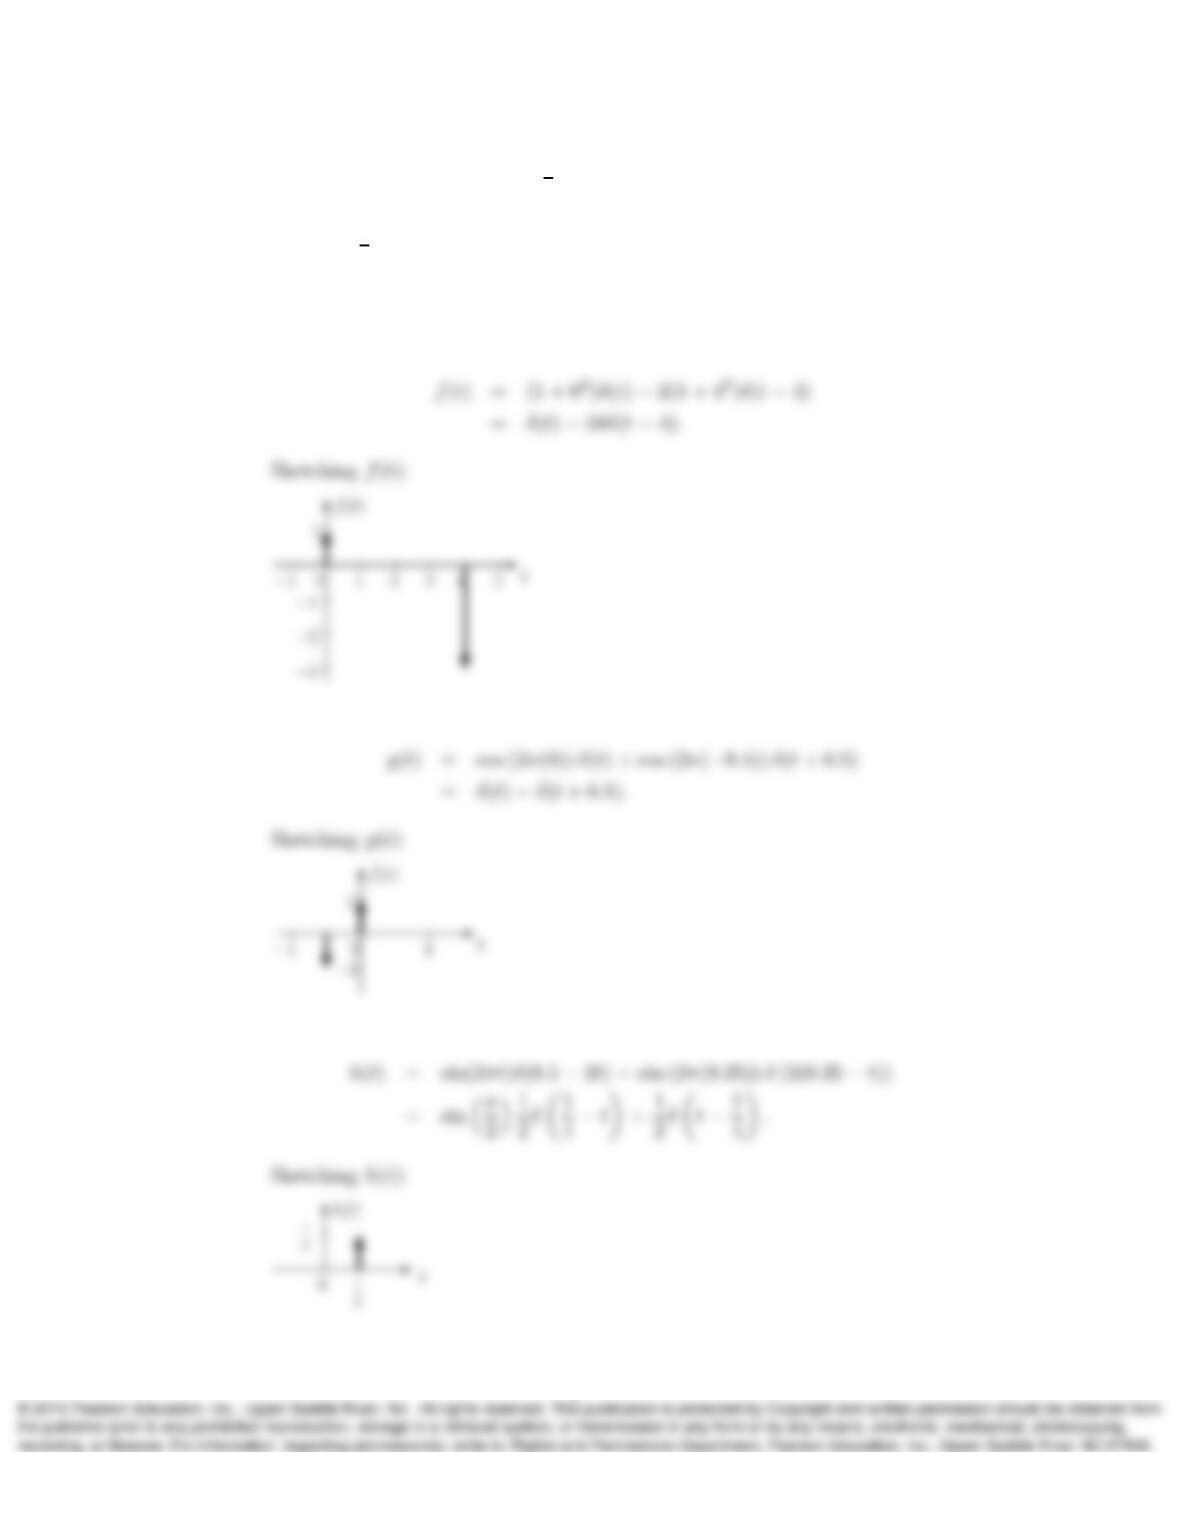
a) f(t) = (1 + t2)(δ(t)−2δ(t−4)).
b) g(t) = cos(2πt)(du
dt +δ(t+ 0.5)).
c) h(t) = sin(2πt)δ(0.5−2t).
d) y(t) = R∞
−6(τ2+ 6)δ(τ−2)dτ .
e) z(t) = R∞
6(τ2+ 6)δ(τ−2)dτ .
8
f) a(t) = Rt
−∞ δ(τ+ 1)dτ +rect(t
6)δ(t−2).
g) b(t) = δ(t−3) ∗u(t).
h) c(t) = △(t
2)∗(δ(t)−δ(t+ 2)).
Solution:
a)
b)
c)
9
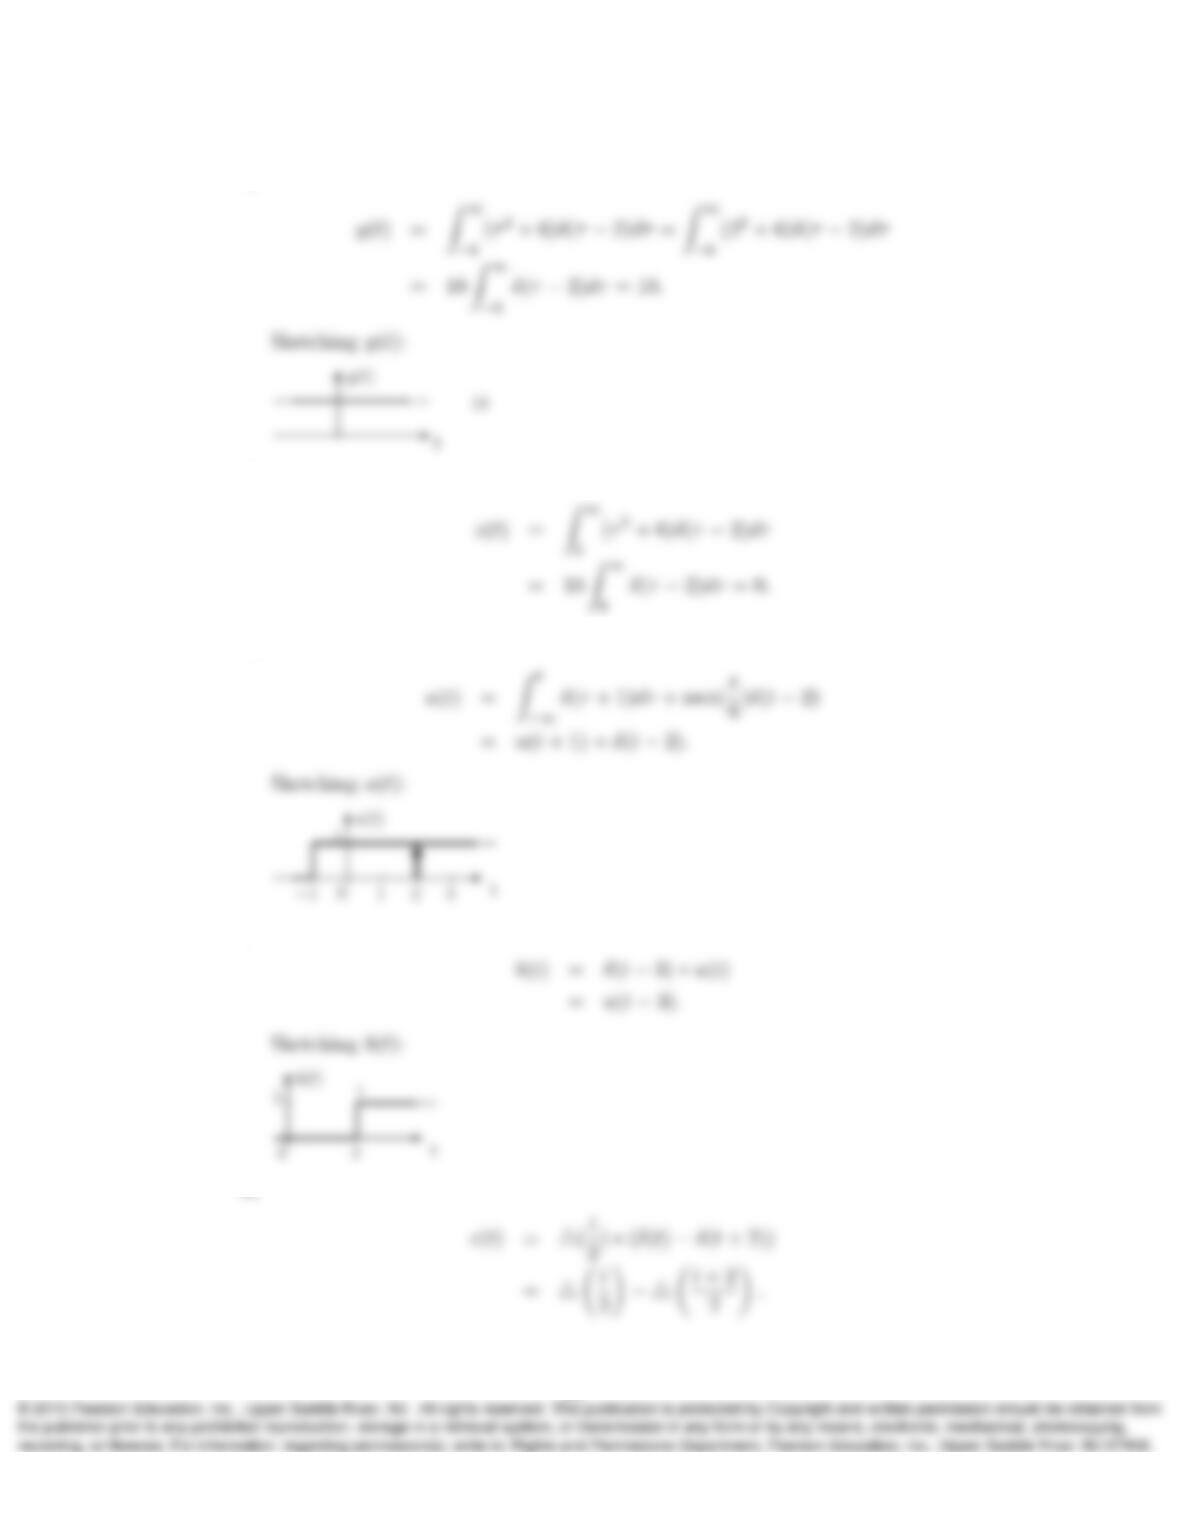
d)
e)
f)
g)
h)
10
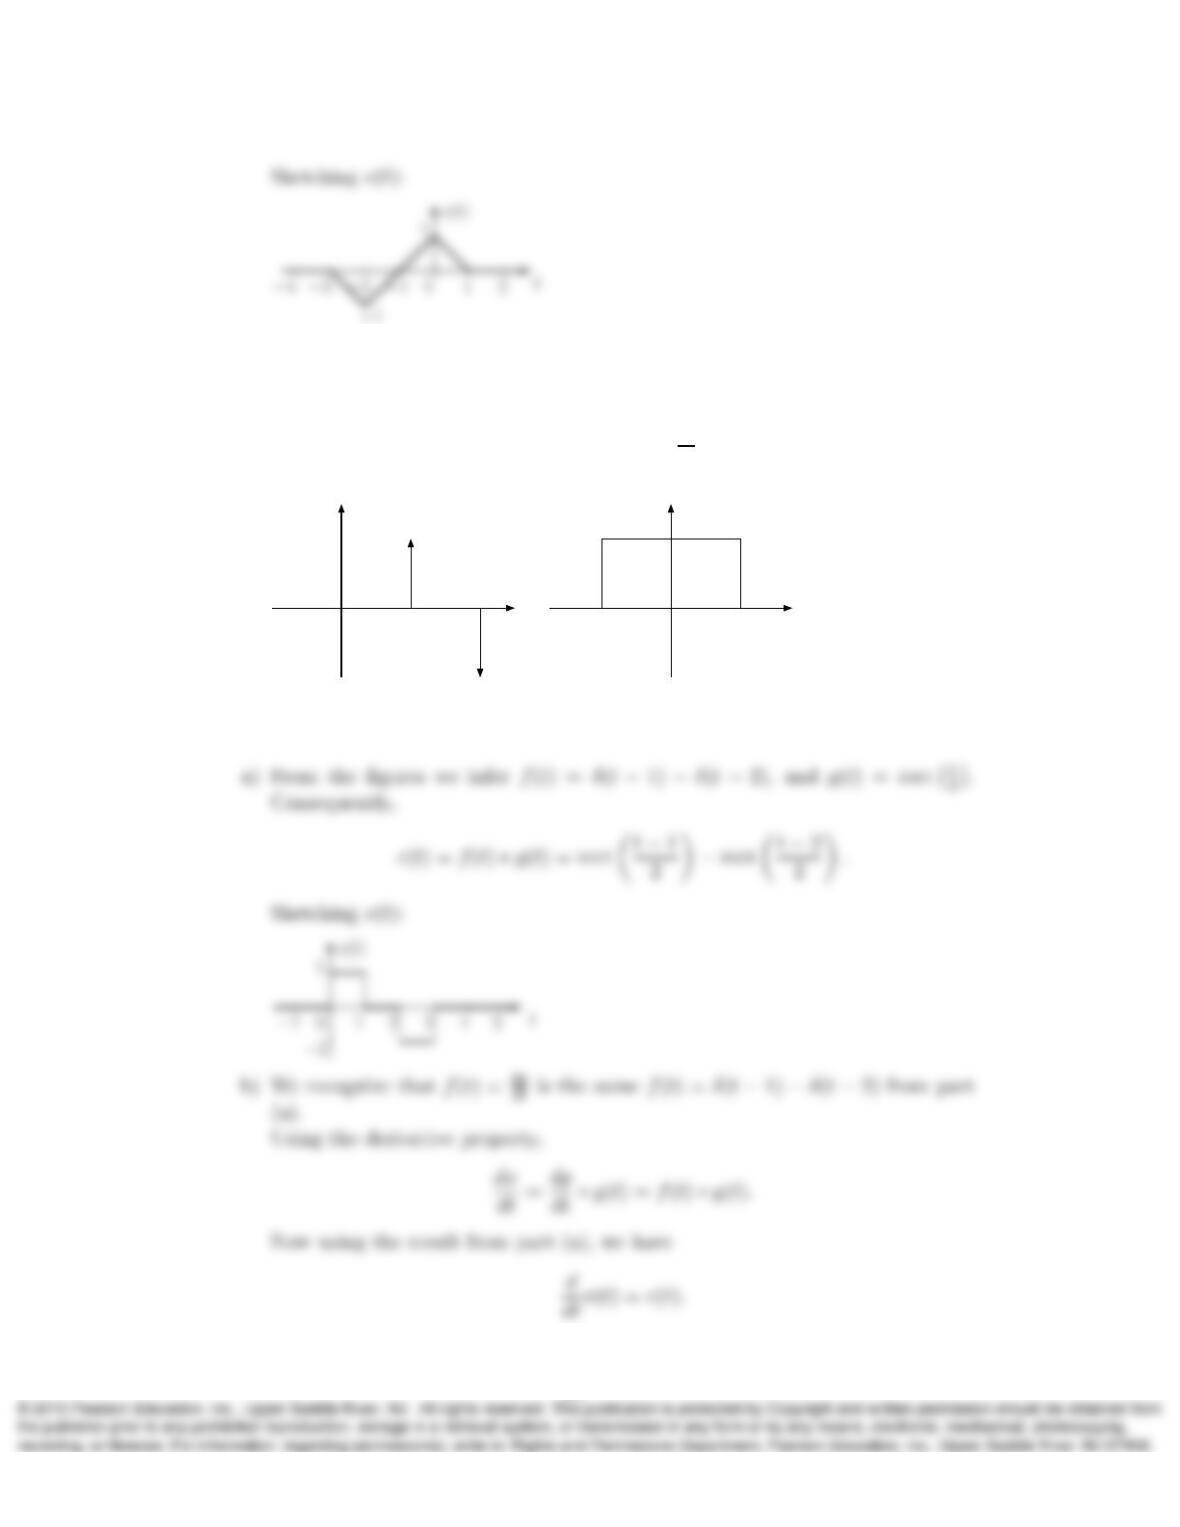
8. For f(t)and g(t)as shown,
a) Determine and sketch c(t) = f(t)∗g(t).
b) Given that p(t) = rect(t−1.5) and f(t) = dp
dt , find x(t) = p(t)∗g(t), using
the result of part (a). Explain your procedure clearly.
2
f(t)
t
1
1
−1
g(t)
t
1
1
−1
Solution:
11
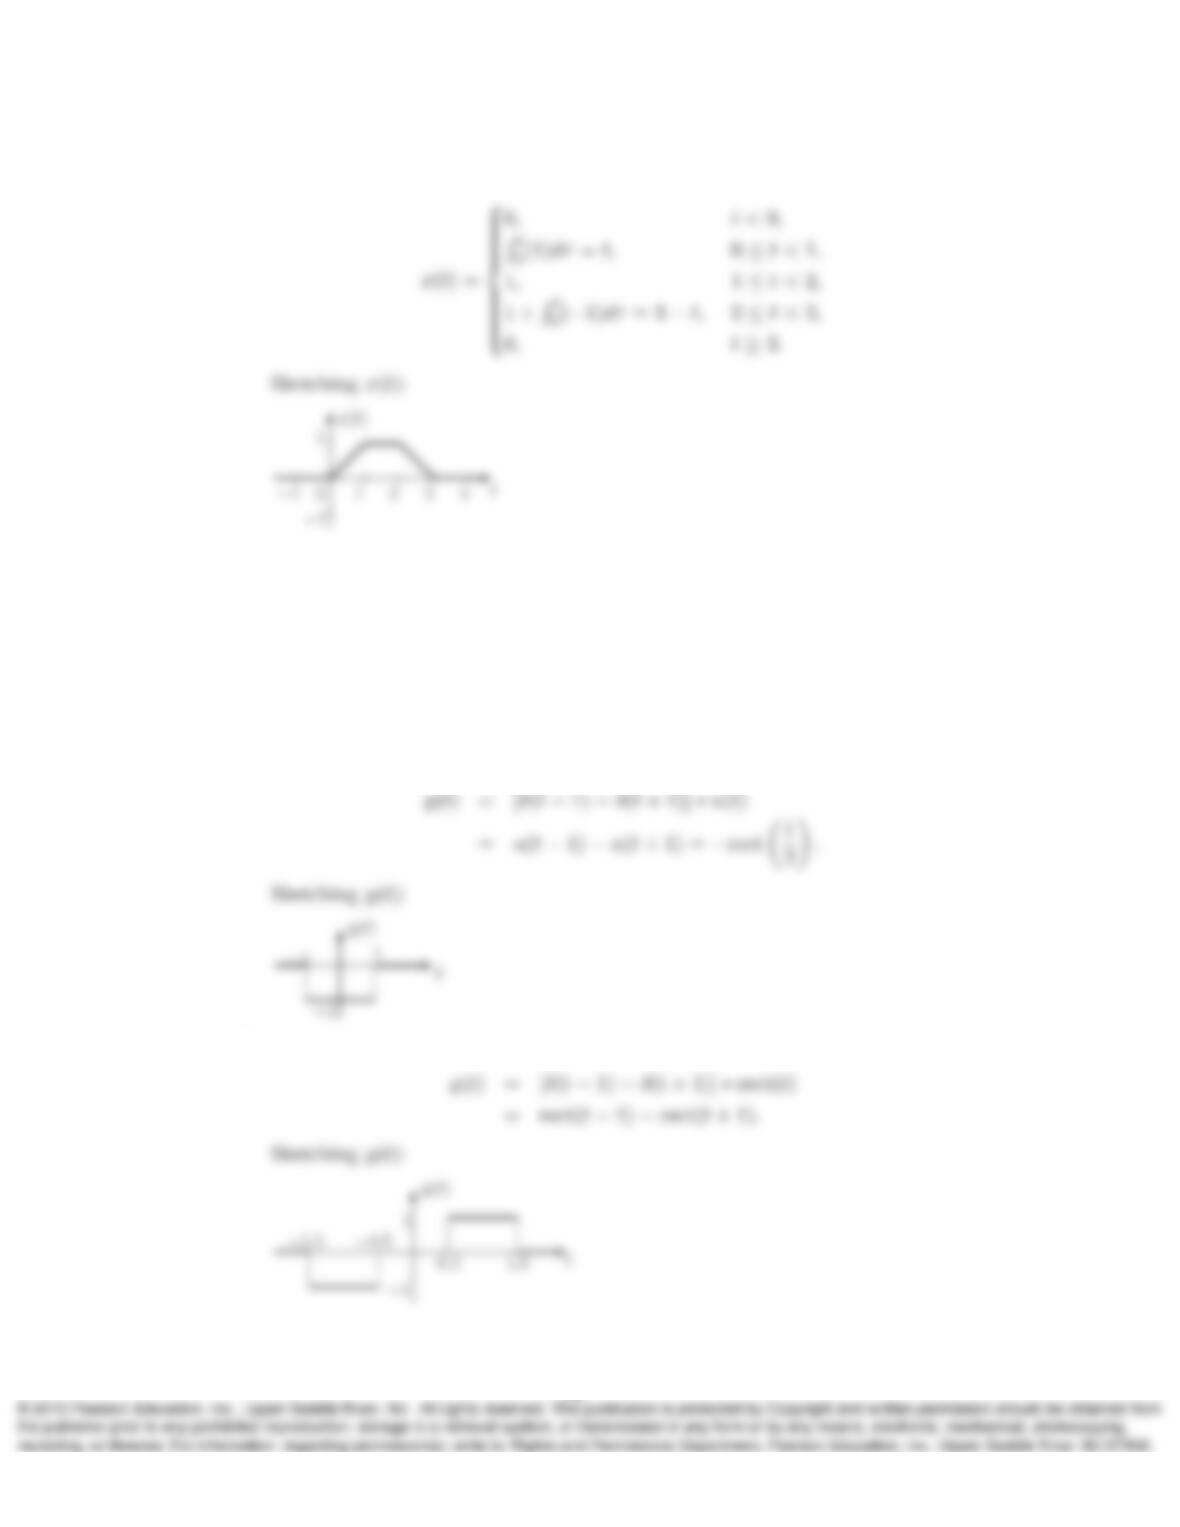
Finally, we obtain x(t)by integrating c(t)
9. A system is described by an impulse response h(t) = δ(t−1) −δ(t+ 1). Sketch the
system response y(t) = h(t)∗f(t)to the following inputs:
a) f(t) = u(t).
b) f(t) = rect(t).
Solution:
a)
b)
12
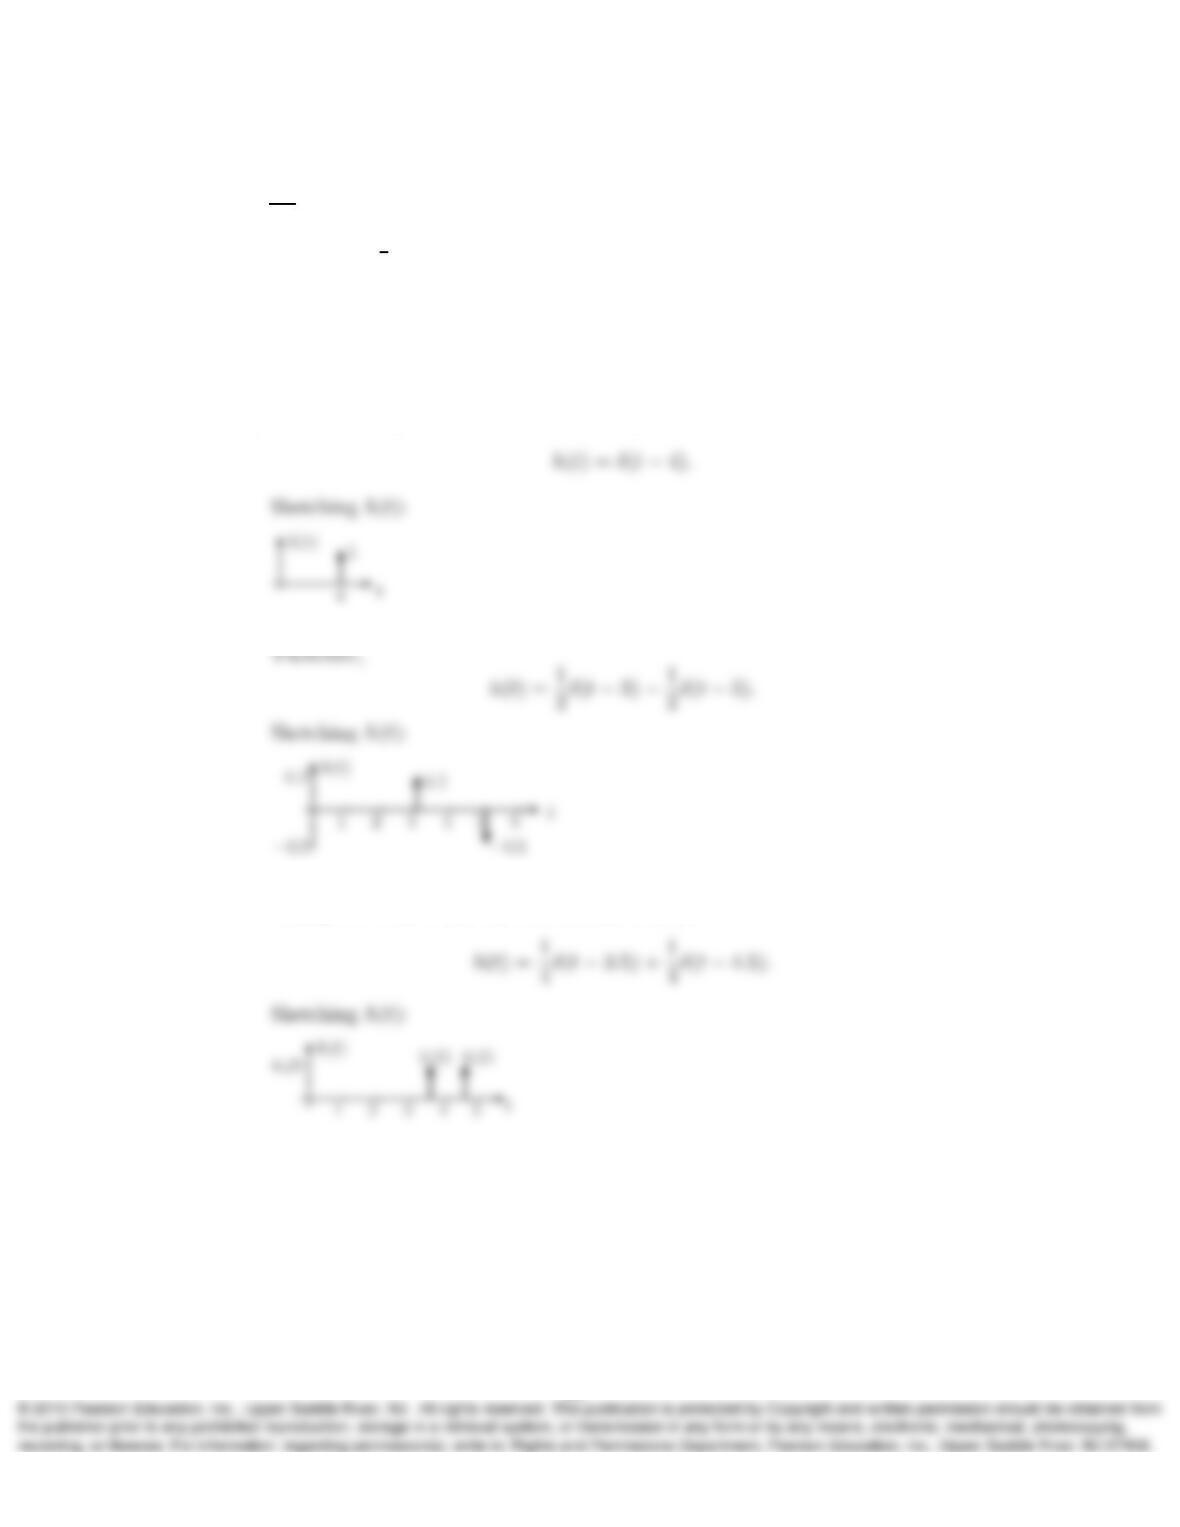
10. For a system with impulse response h(t), the system output y(t) = h(t)∗f(t) =
rect(t−4
2). Determine and sketch h(t)if
a) f(t) = rect(t
2).
b) f(t) = 2u(t).
c) f(t) = 4rect(t).
Solution:
a) Since the output is a shifted version of f(t), then
b) We can form the rectangle, by adding scaled and shifted versions of f(t).
c) We can put two rectangles of width 1, to form the rectangle of width 2, by
adding two scaled and shifted versions of f(t):
11. Determine the Fourier transform of the following signals — simplify the results as
much as you can and sketch the result if it is real valued:
a) f(t) = 5 cos(5t) + 3 sin(15t).
b) x(t) = cos2(6t).
c) y(t) = e−tu(t)∗cos(2t).
13
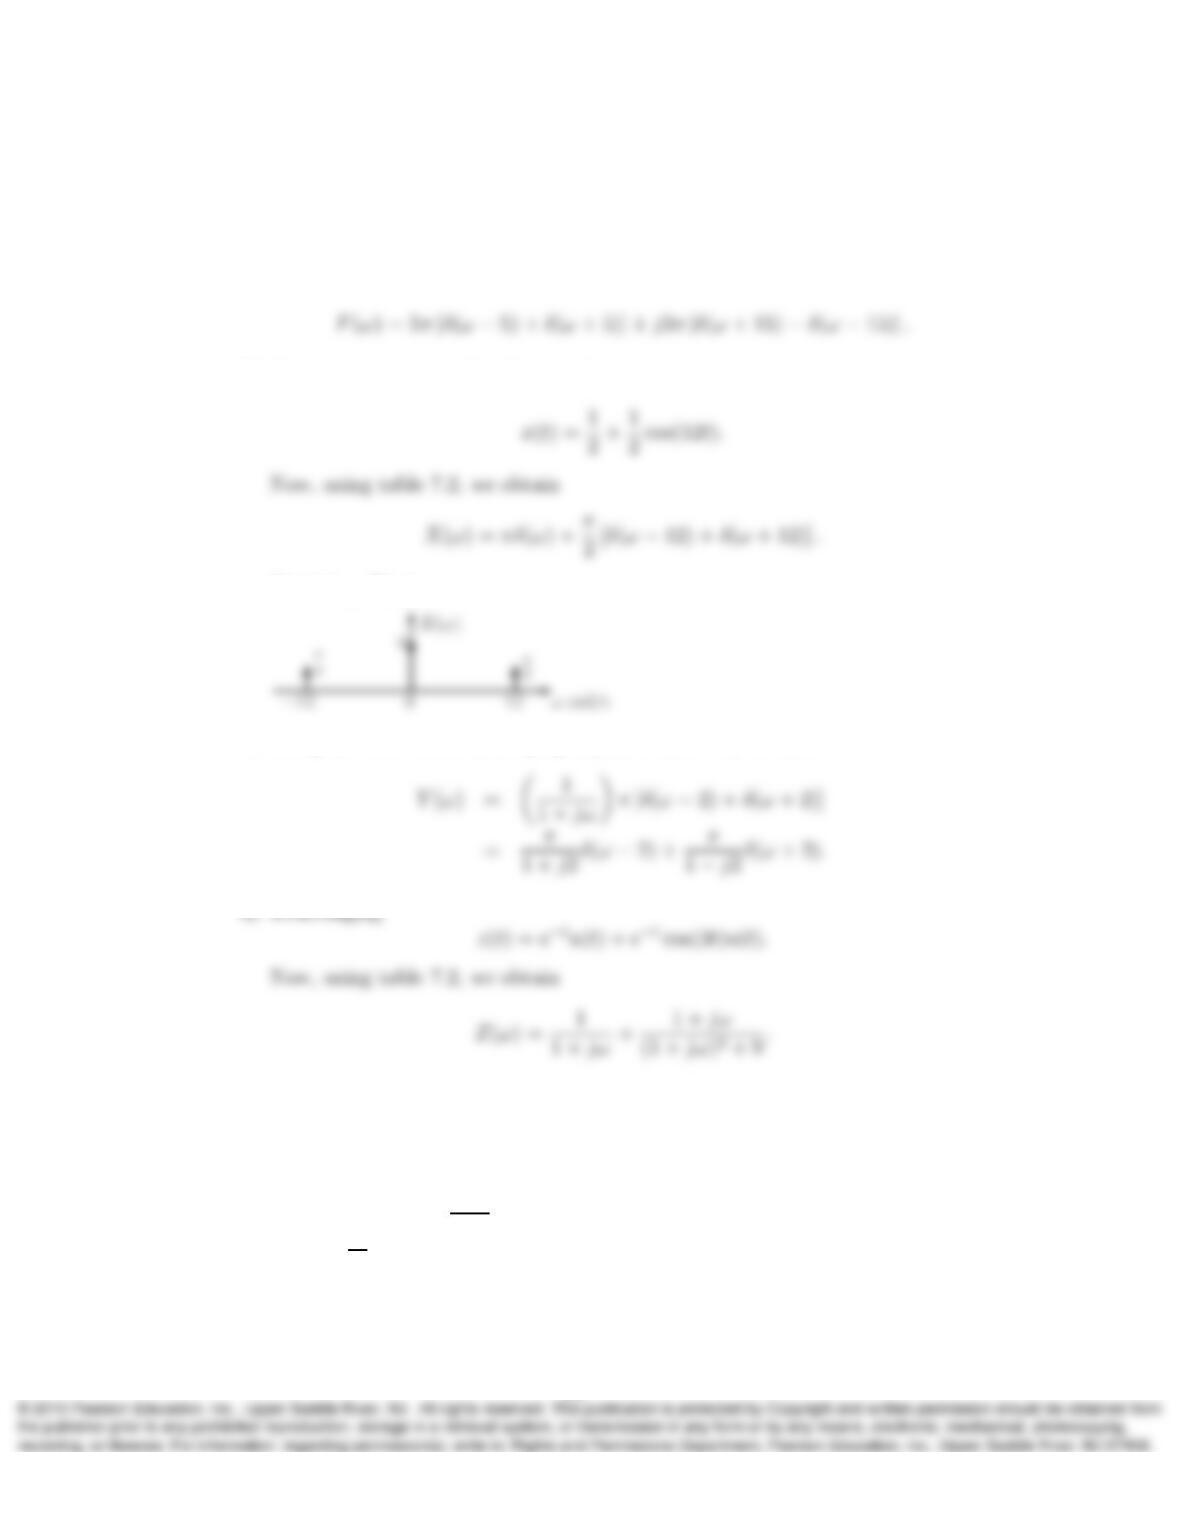
d) z(t) = (1 + cos(3t))e−tu(t).
Solution:
a) Using table 7.2, we obtain
b) Using trigonometric identities, we have
Sketching X(ω):
c) Using the time convolution property, and table 7.2, we have
12. Determine the inverse Fourier transforms of the following:
a) F(ω) = 2π[δ(ω−4) + δ(ω+ 4)] + 8πδ(ω).
b) A(ω) = 6πcos(5ω).
c) B(ω) = P∞
n=−∞ 2π1
1+n2δ(ω−n2).
d) C(ω) = 8
jω + 4πδ(ω).
Solution:
14
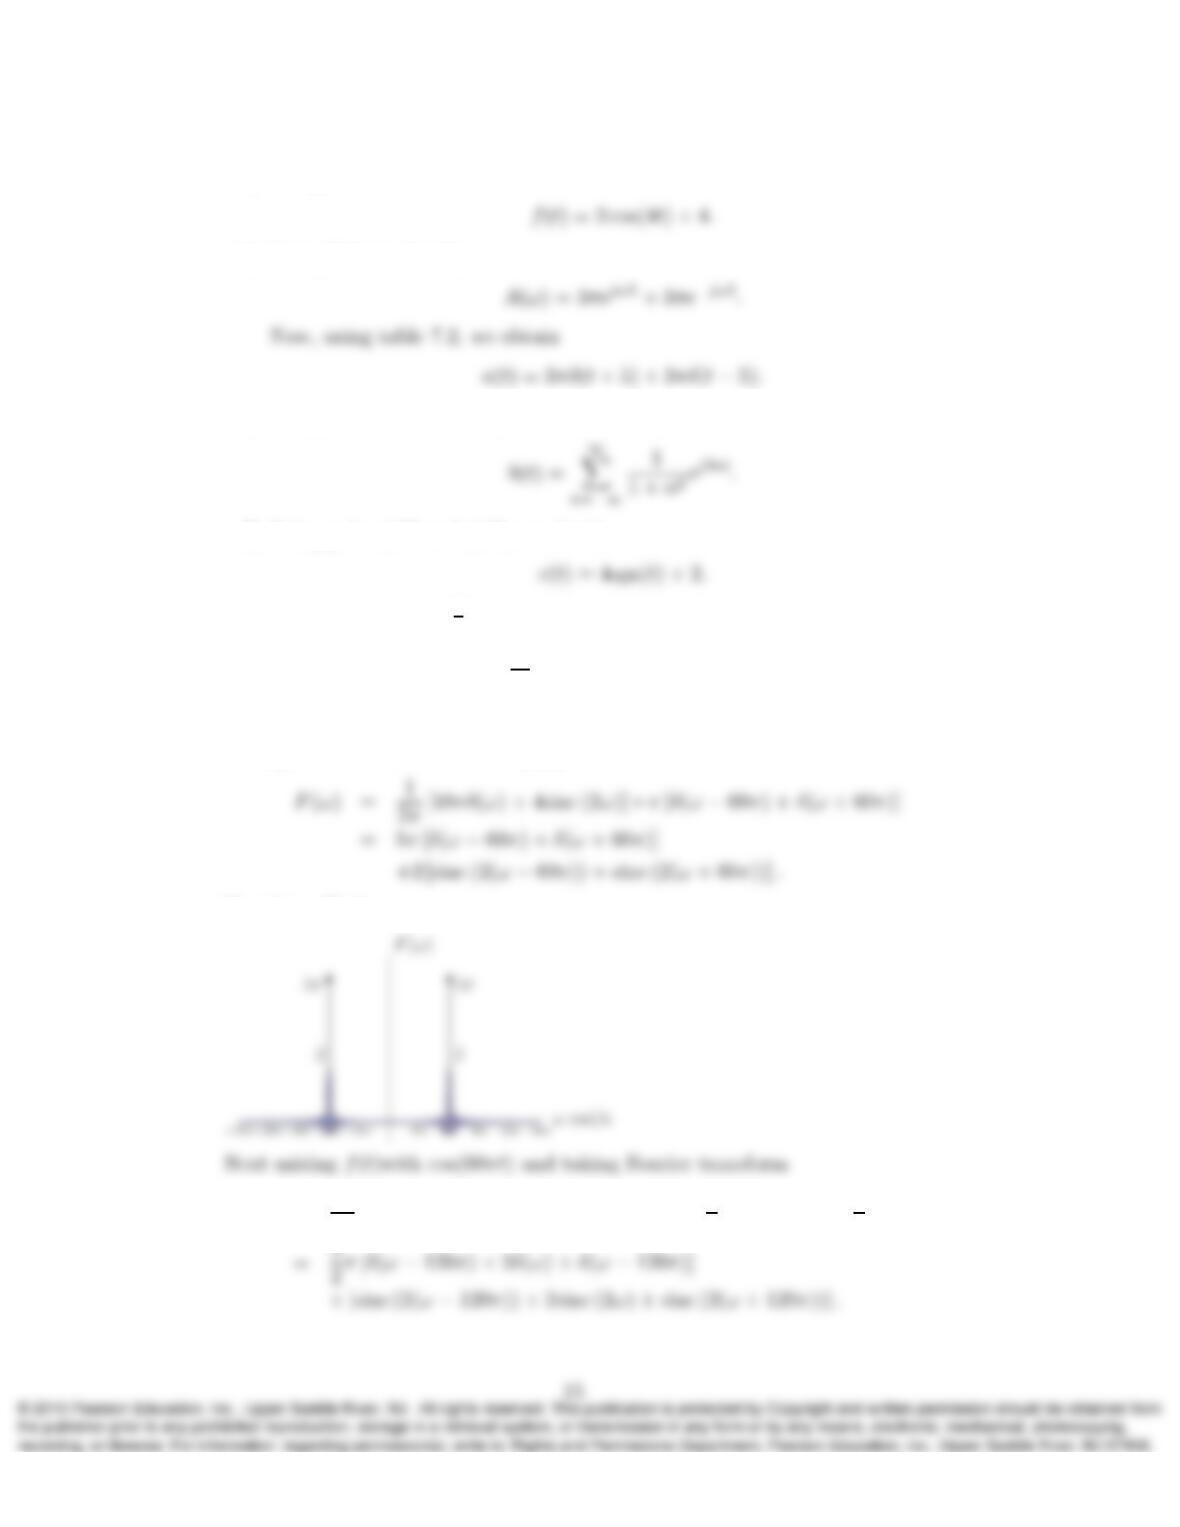
a) Using table 7.2 we obtain
b) Using Euler’s identity,
c) Using Fourier transform pair #17 in the table 7.2, we obtain
d) Using pairs #22 and #15, we obtain
13. Signal f(t) = (5 + rect(t
4)) cos(60πt)is mixed with signal cos(60πt)to produce
the signal y(t). Subsequently, y(t)is low-pass filtered with a system having fre-
quency response H(ω) = 4rect(ω
4π)to produce q(t). Sketch F(ω),Y(ω),Q(ω), and
determine q(t).
Solution:
Taking the Fourier transform of f(t), we have
Sketching F(ω):
Y(ω) = 1
2πF(ω)∗π[δ(ω−60π) + δ(ω+ 60π)] = 1
2F(ω−60π) + 1
2F(ω+ 60π)
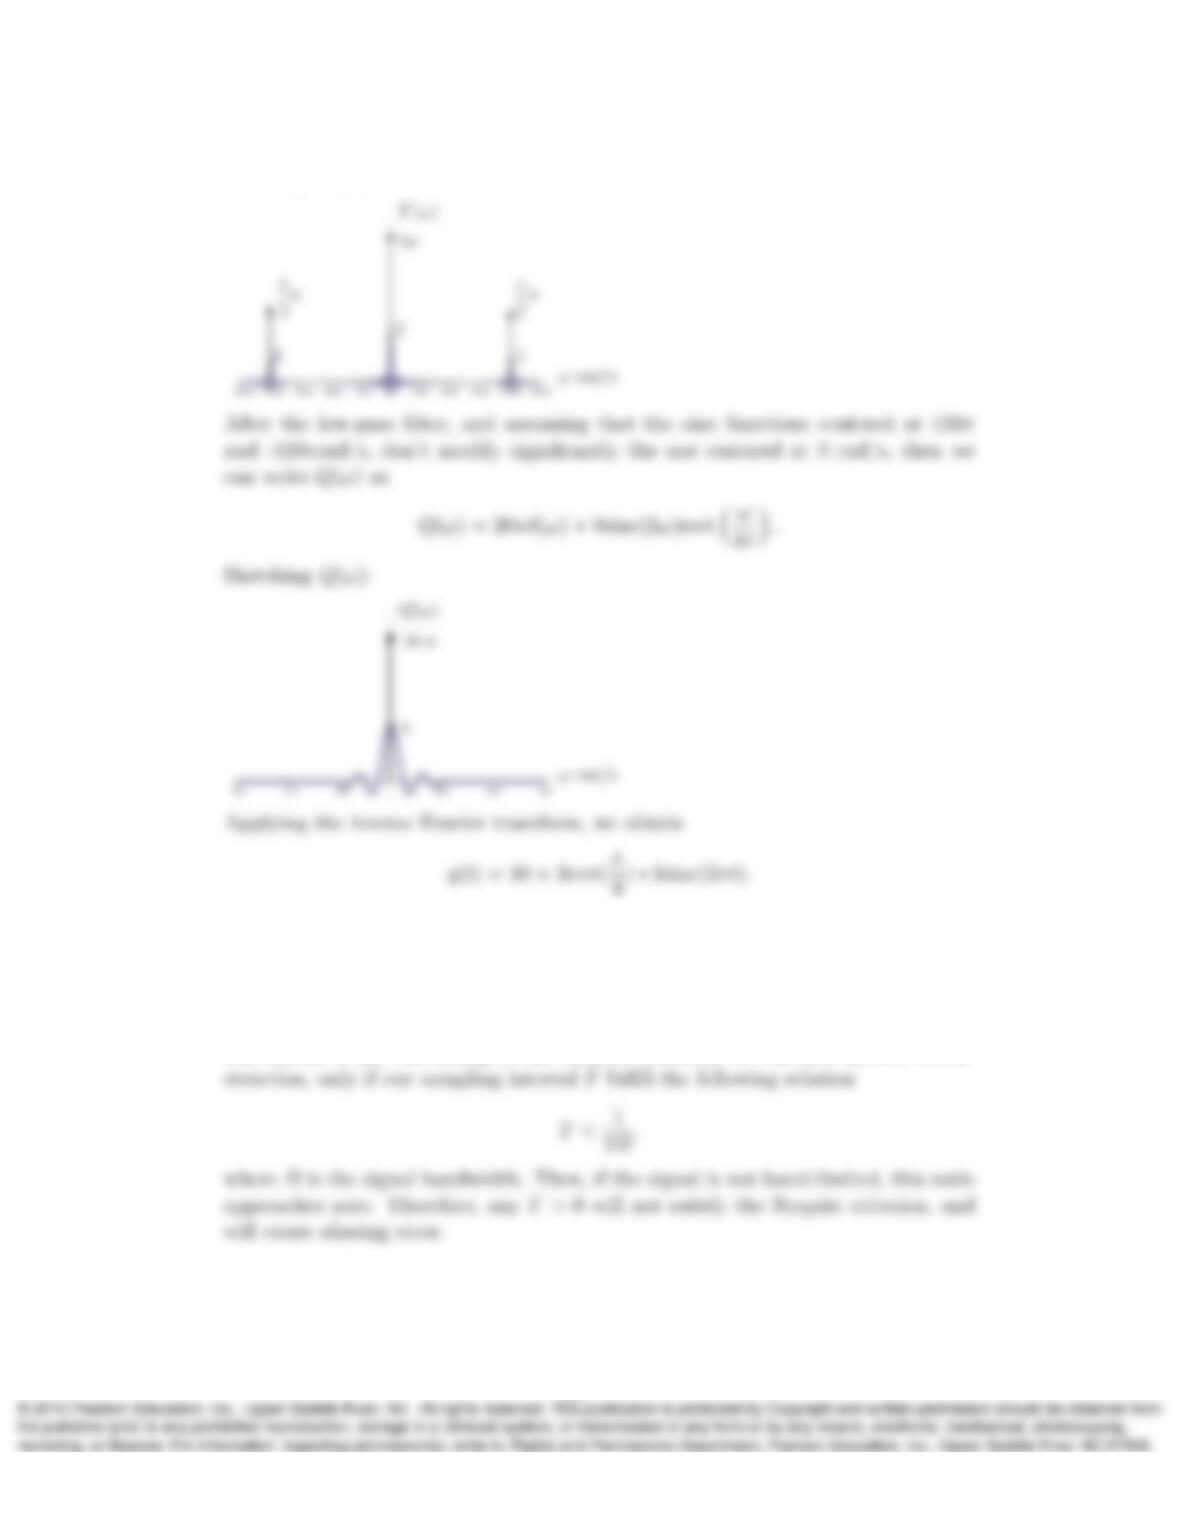
Sketching Y(ω):
14. If signal f(t)is not band-limited, would it be possible to reconstruct f(t)exactly
from its samples f(nT )taken with some finite sampling interval T > 0? Explain
your reasoning.
Solution:
The answer is no. According to the Nyquist criterion, we can have perfect recon-
15. The inverse of the sampling interval T–that is, T−1–, is known as the sampling
frequency and usually is specified in units of Hz. Determine the minimum sampling
16
frequencies T−1needed to sample the following analog signals without causing
aliasing error:
a) Arbitrary signal f(t)with bandwidth 20 kHz.
b) f(t) = sinc(4000πt).
c) f(t) = sinc(4000πt) cos(20000πt).
Solution:
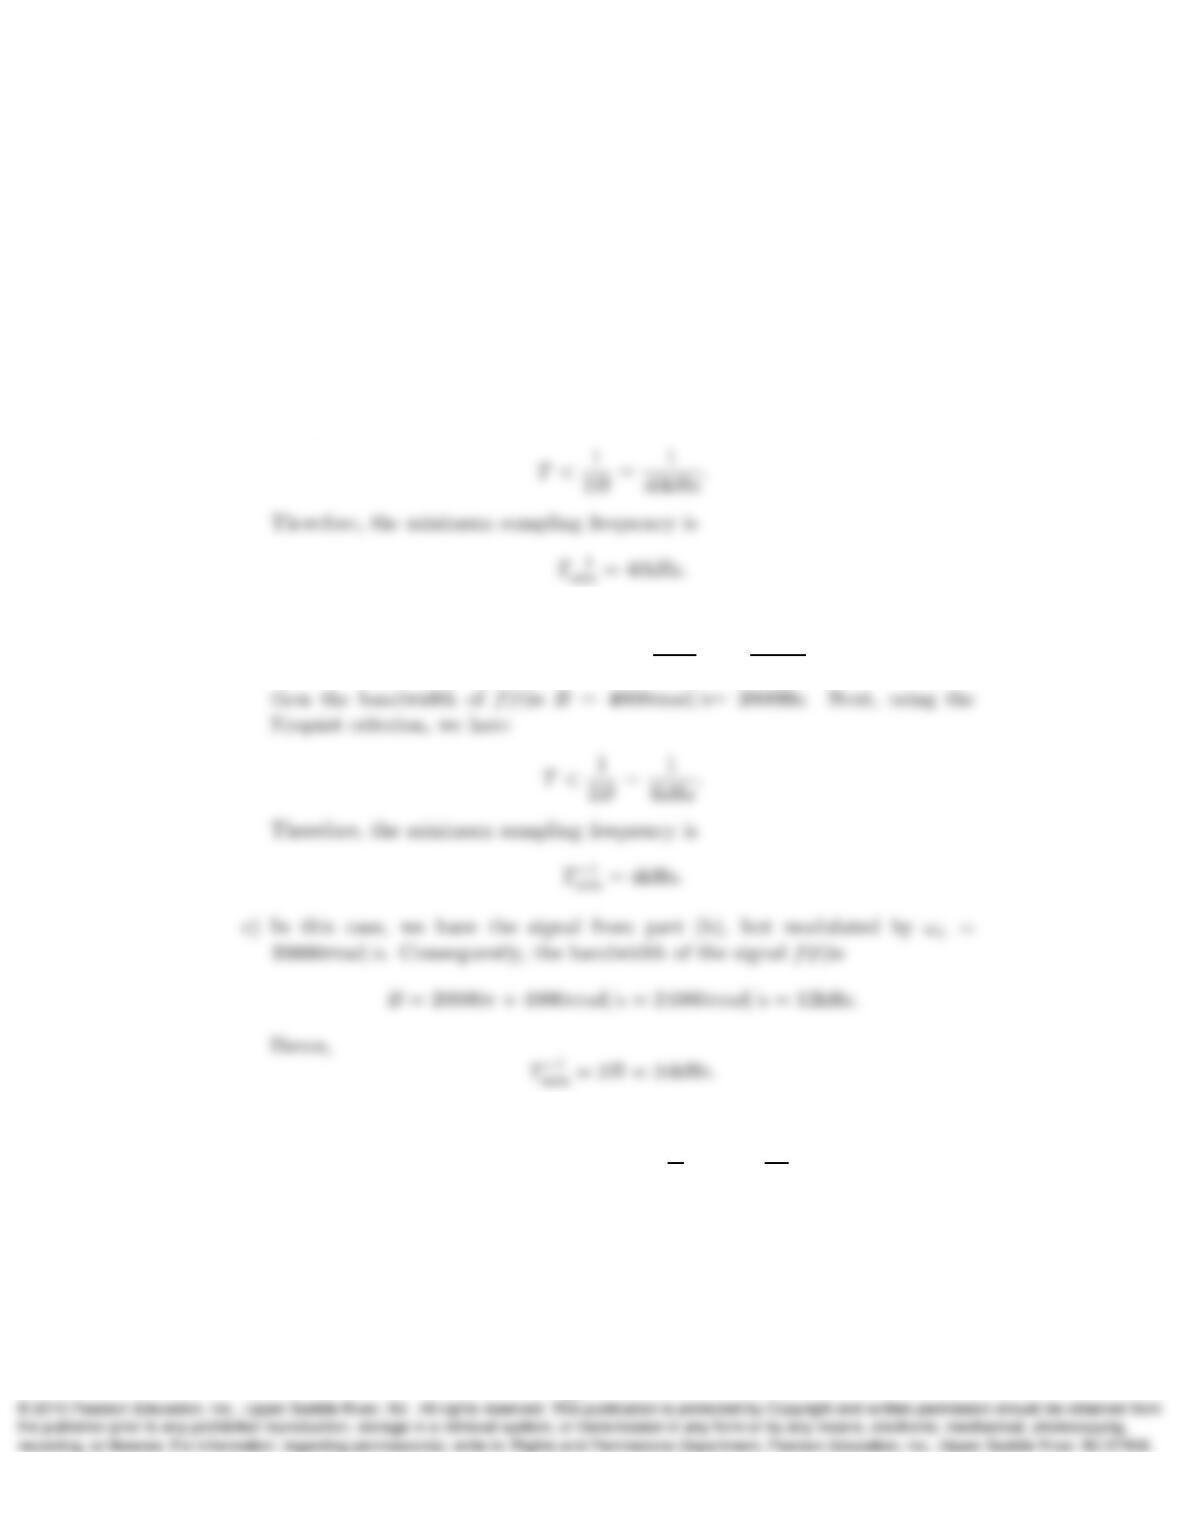
a) Using the Nyquist criterion, we have
b) Since,
f(t) = sinc(4000πt)←→ 1
4000 rect ω
8000π
16. Using
∞
X
n=−∞
f(t)δ(t−nT )↔
∞
X
n=−∞
1
TF(ω−n2π
T)
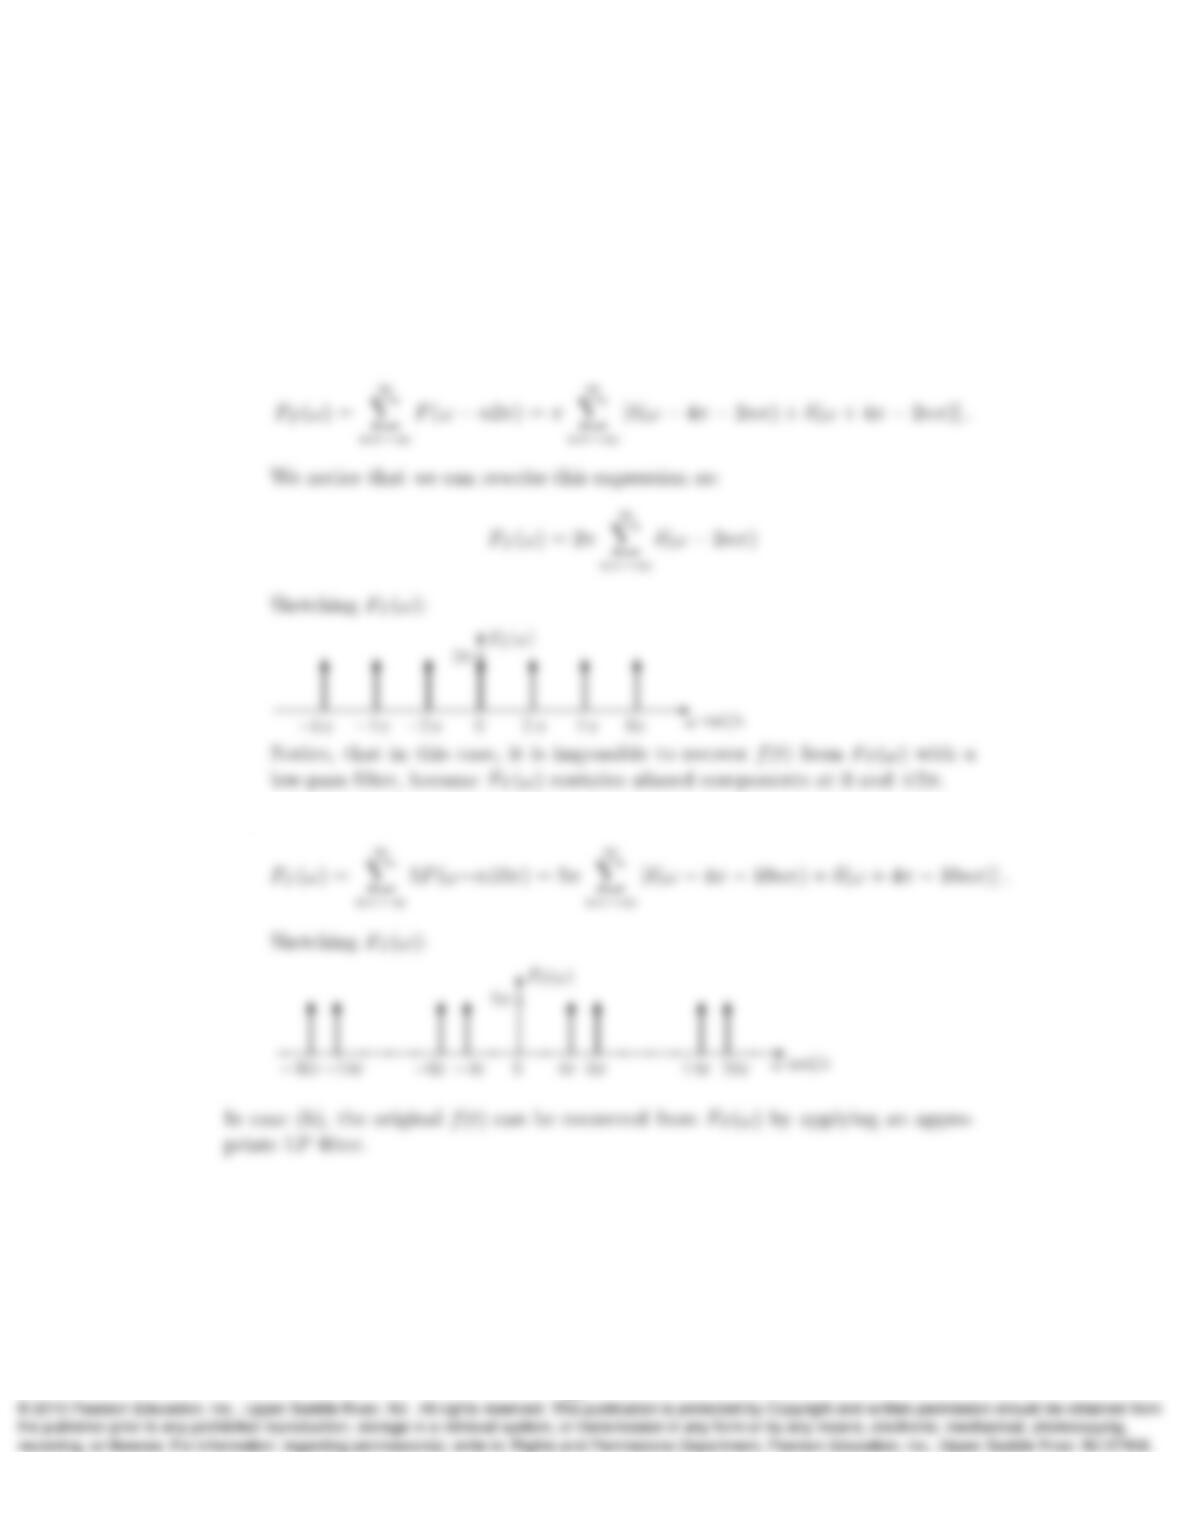
(item 25 in Table 7.2), sketch the Fourier transform FT(ω)of signal
fT(t)≡
∞
X
n=−∞
f(t)δ(t−nT )
17
if
f(t) = cos(4πt),
assuming (a) T= 1 s, and (b) T= 0.2s. Which sampling period allows f(t)to be
recovered by applying an appropriate low-pass filter to fT(t)?
Solution:
a) With T= 1s,
b) With T= 0.2s,
17. Given the identity
Z∞
−∞
δ(t−to)f(t)dt =f(to),
where the function f(t)of time variable tis measured in units of, say, volts (V),
what would be the units of the shifted impulse δ(t−to)? What would be the units
18
of an impulse δ(x)if xis a position variable measured in units of meters? What
would be the units of a charge distribution specified as qδ(x−4) if qis measured
in units of coulombs (C)? It is an interesting fact that the impulse δ(t)has a unit
(in the sense of a dimension), but it has no numerical values; only integrals of the
impulse have a numerical value.
Solution:
If tis measured in seconds (s), then the integral of f(t)over twould give dimension
18. To confirm the scaling property of the impulse, show that
δ(a(t−t0)) ∗f(t)
and 1
|a|δ(t−t0)∗f(t)
are identical for a6= 0. Hint: Write the above convolutions explicitly and make
use of an appropriate change of variable before applying the sifting property of the
impulse.
Solution:
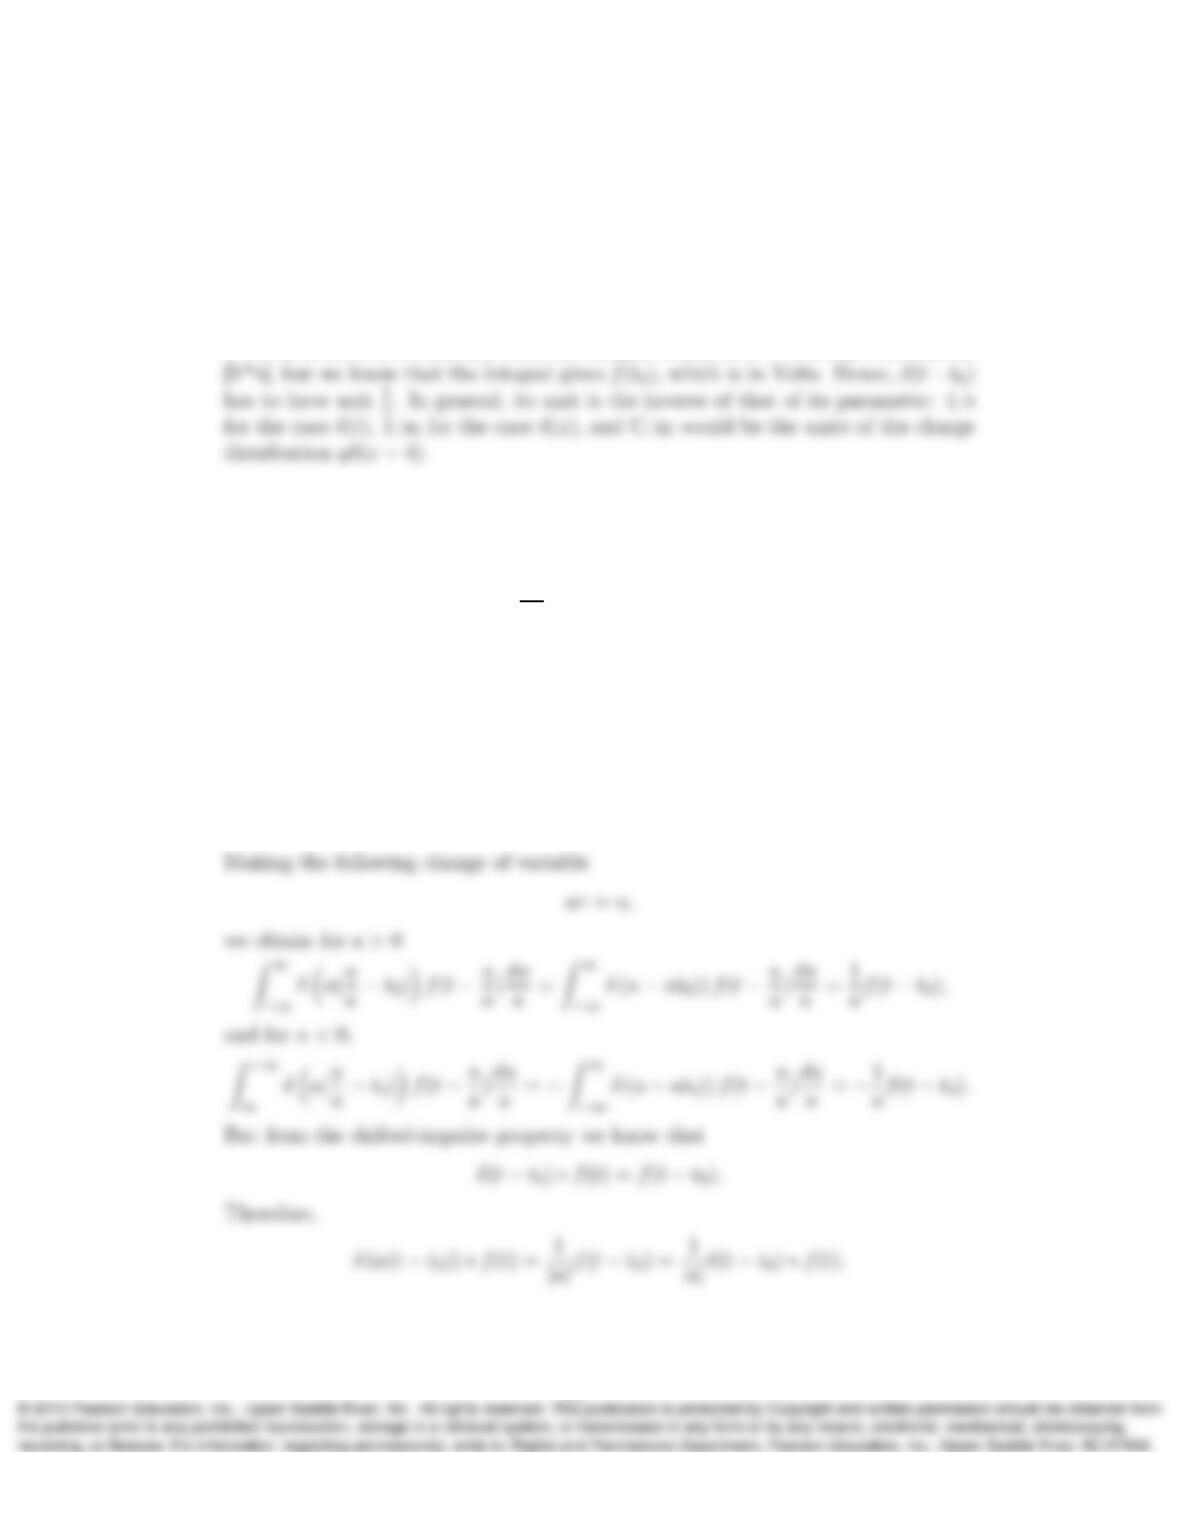
Writing the convolution explicitly:
δ(a(t−t0)) ∗f(t) = Z∞
−∞
δ(a(τ−t0)) f(t−τ)dτ
19