Chapter 12
1. Derive the transfer function ˆ
Ha(s)of the 1st-order active filter circuit depicted in
Figure 12.5a.
Solution:
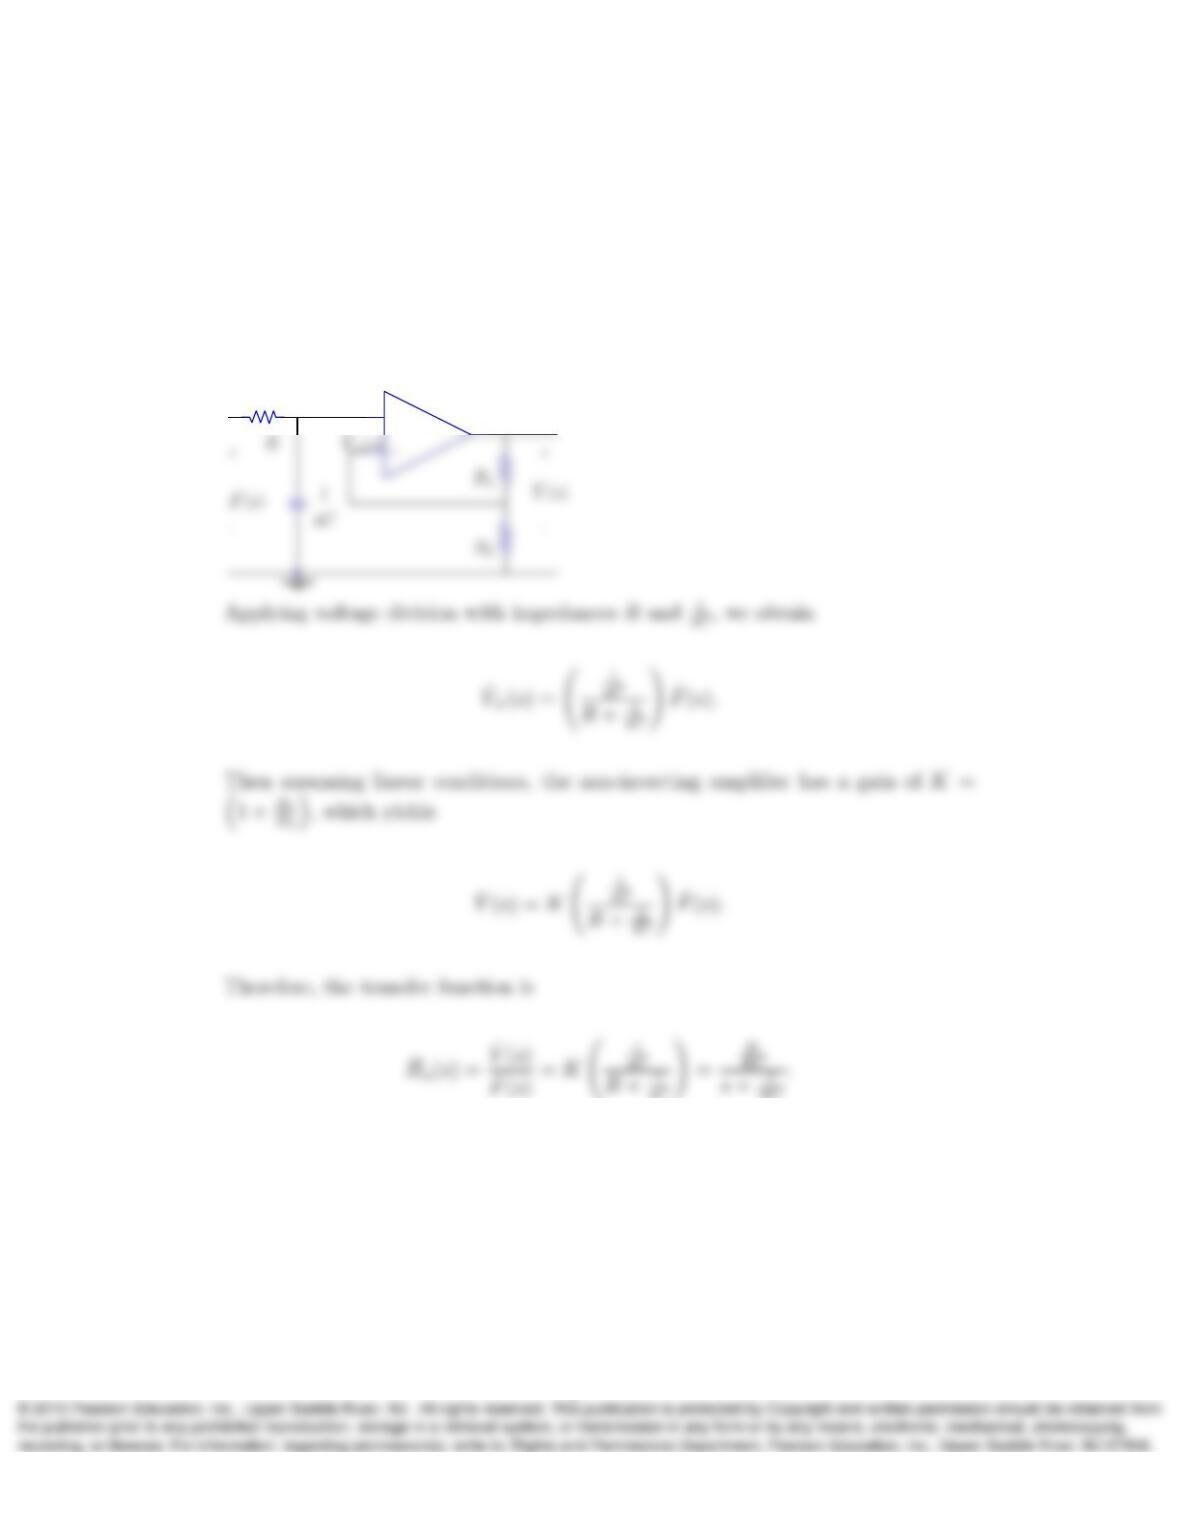
The equivalent s-domain circuit is
+
ˆ
V+(s)
2. Derive the transfer function ˆ
Hb(s)of the Sallen and Key circuit depicted in Figure
12.5b.
Solution:
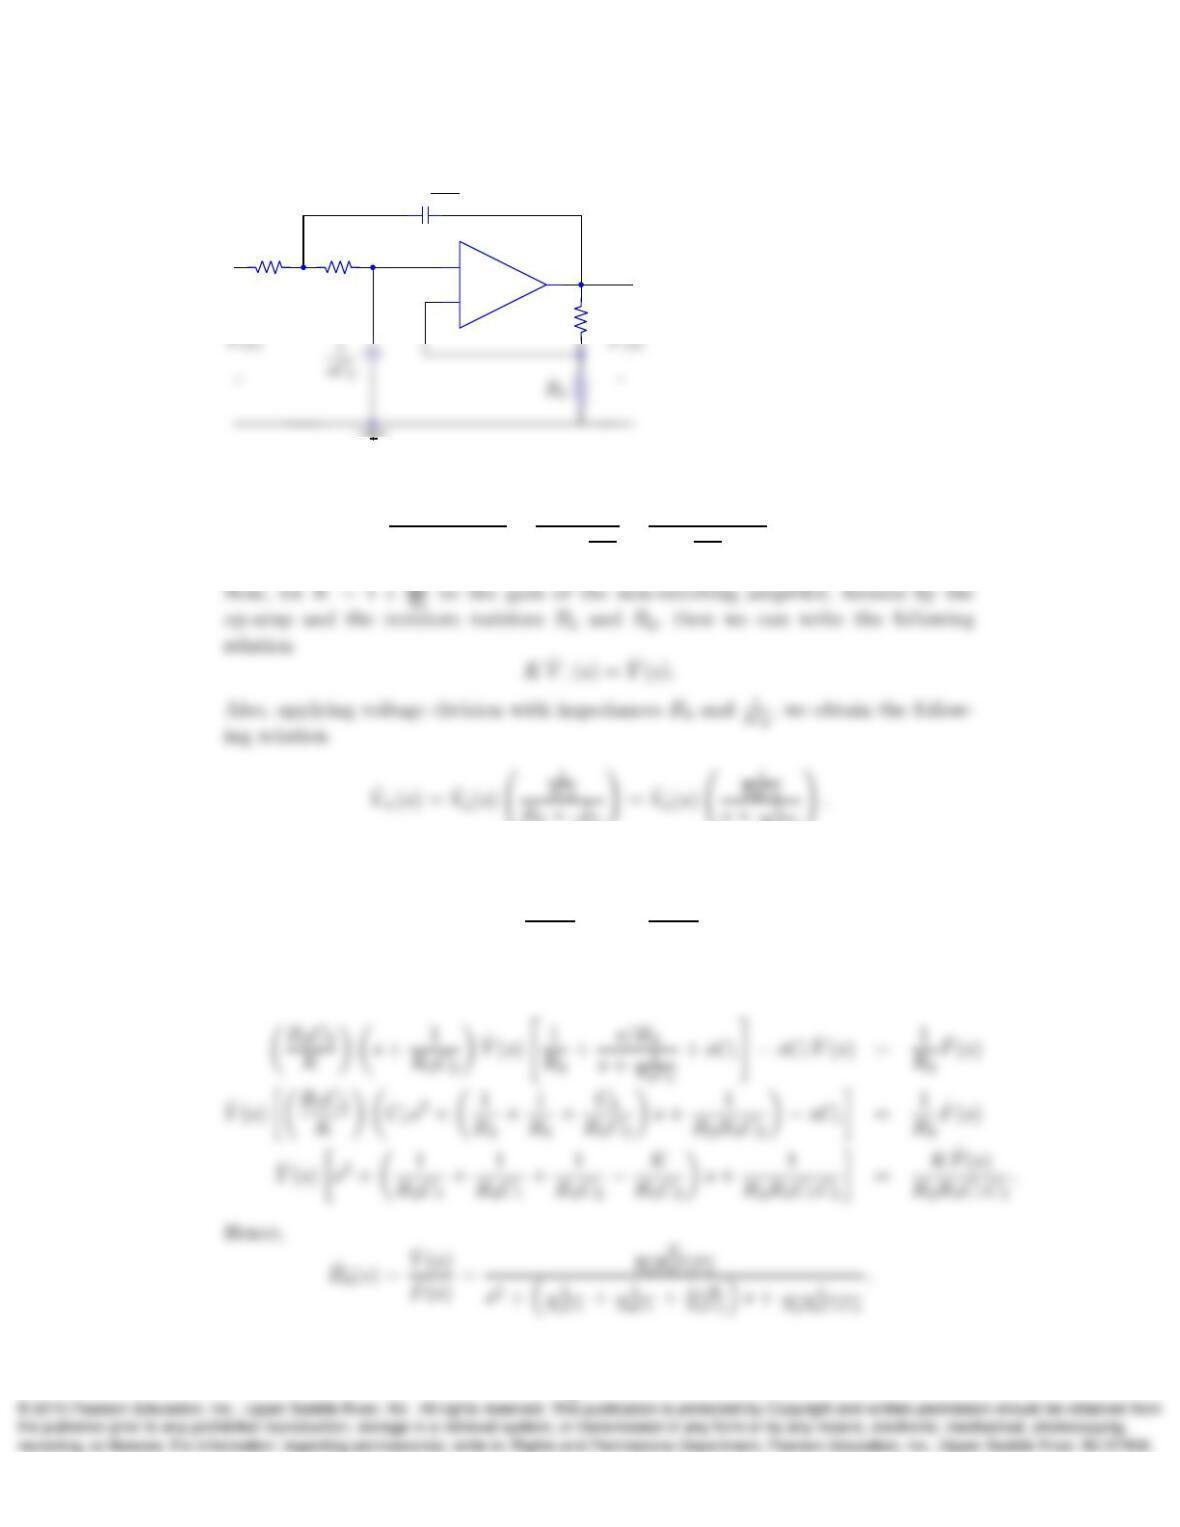
The equivalent s-domain circuit is
1
+
–
+
+
R4
R1
R3
ˆ
V+(s)
ˆ
V−(s)
1
sC1
ˆ
Va(s)
The KCL equation at node ˆ
Va(s)can be written as
ˆ
Va(s)−ˆ
F(s)
R3
+ˆ
Va(s)
R4+1
sC2
+ˆ
Va(s)−ˆ
Y(s)
1
sC1
= 0.
sC2!=ˆ
R4C2!.
Then from this two equations, we have
ˆ
Va(s) = R4C2
Ks+1
R4C2ˆ
Y(s).
Finally, replacing the obtained ˆ
Va(s)into the KCL equation, we obtain
2
3. Given the following transfer functions determine whether the system is under-
damped, overdamped, or critically damped, and calculate the quality factor Q:
a) ˆ
H1(s) = s
s2+4s+400 ,
b) ˆ
H2(s) = s+5
s2+2000s+106,
c) ˆ
H3(s) = s2+100
s2+20000s+106.
Solution:
a) From the characteristic polynomial,
P(s) = s2+ 4s+ 400 = s2+ 2αs +ω2
0,
we obtain the damping coefficient
b) For ˆ
H2(s)with P(s) = s2+ 2000s+ 106, we have
3
c) For ˆ
H3(s)with P(s) = s2+ 20000s+ 106, we have
4. Identify each of the three systems defined in Problem 3 as low-pass, band-pass, or
high-pass, and for the band-pass system determine the 3-dB bandwidth Ω.
Solution:
a) Obtaining the frequency response of the system
H1(ω) = ˆ
H1(jω) = jω
−ω2+j4ω+ 400 ,
and getting the magnitude, we obtain
b) Obtaining the frequency response of the system
H2(ω) = ˆ
H2(jω) = jω + 5
−ω2+j2000ω+ 106,
4
c) Obtaining the frequency response of the system
H3(ω) = ˆ
H3(jω) = −ω2+ 100
−ω2+j20000ω+ 106,
5. Given that y(t)is an underdamped zero-input response of the form given in the
first row of Table 12.1a, show that
Z∞
t|y(τ)|2dτ ≈τd|y(t)|2
e
2,
where τd=1
2αand |y(t)|e=Ae−αt is the envelope of underdamped y(t), and
explain why R∞
t|y(τ)|2dτ can be interpreted as stored energy of the system at
instant t. In performing the integral, make use of ωo≫αto handle an integral
with oscillatory integrand.
Solution:
The underdamped zero-input response has the following form
y(t) = Ae−αt cos(pω2
o−α2t+θ).
5
6. The zero-input response of a 2nd-order band-pass filter is observed to oscillate
about sixty cycles before the oscillation amplitude is reduced to a few percent of its
initial amplitude. Furthermore the oscillation period of the zero-input response is
measured as 1 ms. Assuming that the maximum amplitude response of the system
is 1, write an approximate expression for the frequency response H(ω) = ˆ
H(jω)of
the system.
Solution:
The fact that the zero-input response oscillates several times before attenuation,
indicates that
ω0≫α.
7. Determine the frequency response, 3-dB bandwidth, and quality factor Qof the
following parallel RLC bandpass filter circuit, below, in terms of resistance R:
1H
f(t)R
1F y(t)
+
–
Solution:
Getting the equivalent resistance, which happens to be the transfer function:
ˆ
Y(s)
ˆ
F(s)=ˆ
H(s) = Rk1
sks=Rks
s2+ 1 =
Rs
s2+1
R+s
s2+1
=s
s2+1
Rs+ 1.
6
8. Given θm= 90o(1 + m
n), verify that
(s−Ω∠θm)(s−Ω∠−θm)
multiplies out as
s2+ 2Ω sin(π
2
m
n)s+ Ω2.
Solution:
Multiplying term by term
2
ns+ Ω2.
9. Determine the pole locations of a 4th-order low-pass Butterworth filter with a 3-dB
frequency of 1 kHz.
Solution:
Since, n= 4, and Ω = 2π(1kHz), the pole locations are
7
10. What is the transfer function of the highest-Qsub-component of the 4th-order
Butterworth filter described in Problem 12.9.
Solution:
From the formula for the cascade configuration, we have the quality factors
Q=1
2 sin π
2
m
n.
11. Assuming R3=R4= 4 kΩ, determine the capacitance values C1and C2for the
2nd-order circuit of Figure 12.5b to implement the transfer function of Problem
12.10.
Solution:
Since choosing, R1= 0 and R2=∞, gives K= 1, then we have the following
damping coefficient for the circuit in figure 12.5b
We know also, from the circuit, that
12. Approximate the time delay of the filter described in Problem 12.10 by calculating
the slope of the phase response curve of the filter at ω= 0.
Solution:
8
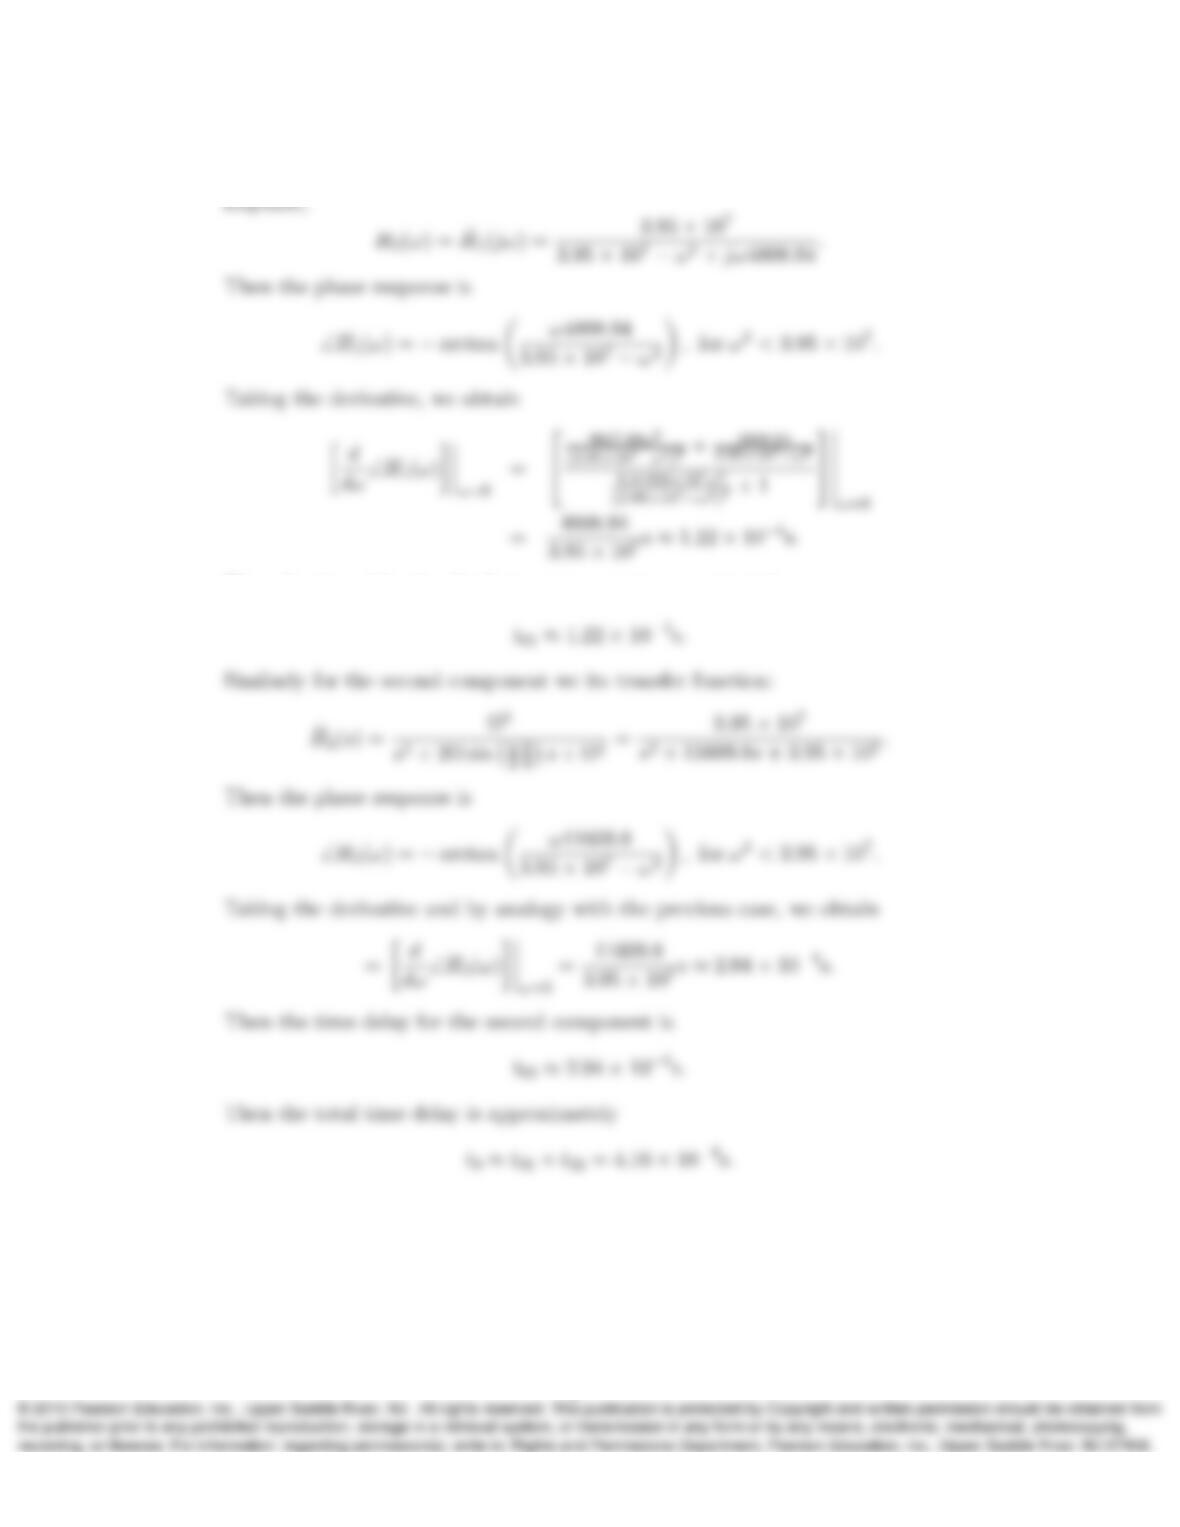
From the transfer function of the highest-Q component, we can obtain the frequency
Then the time delay for the first component is approximately
13. Determine the transfer function ˆ
H(s)of a 3rd-order Butterworth low-pass filter
having 3-dB cutoff frequency 15 kHz. Sketch the magnitude of the frequency re-
sponse. Verify that |ˆ
H(jω)|agrees with your sketch.
Solution:
9
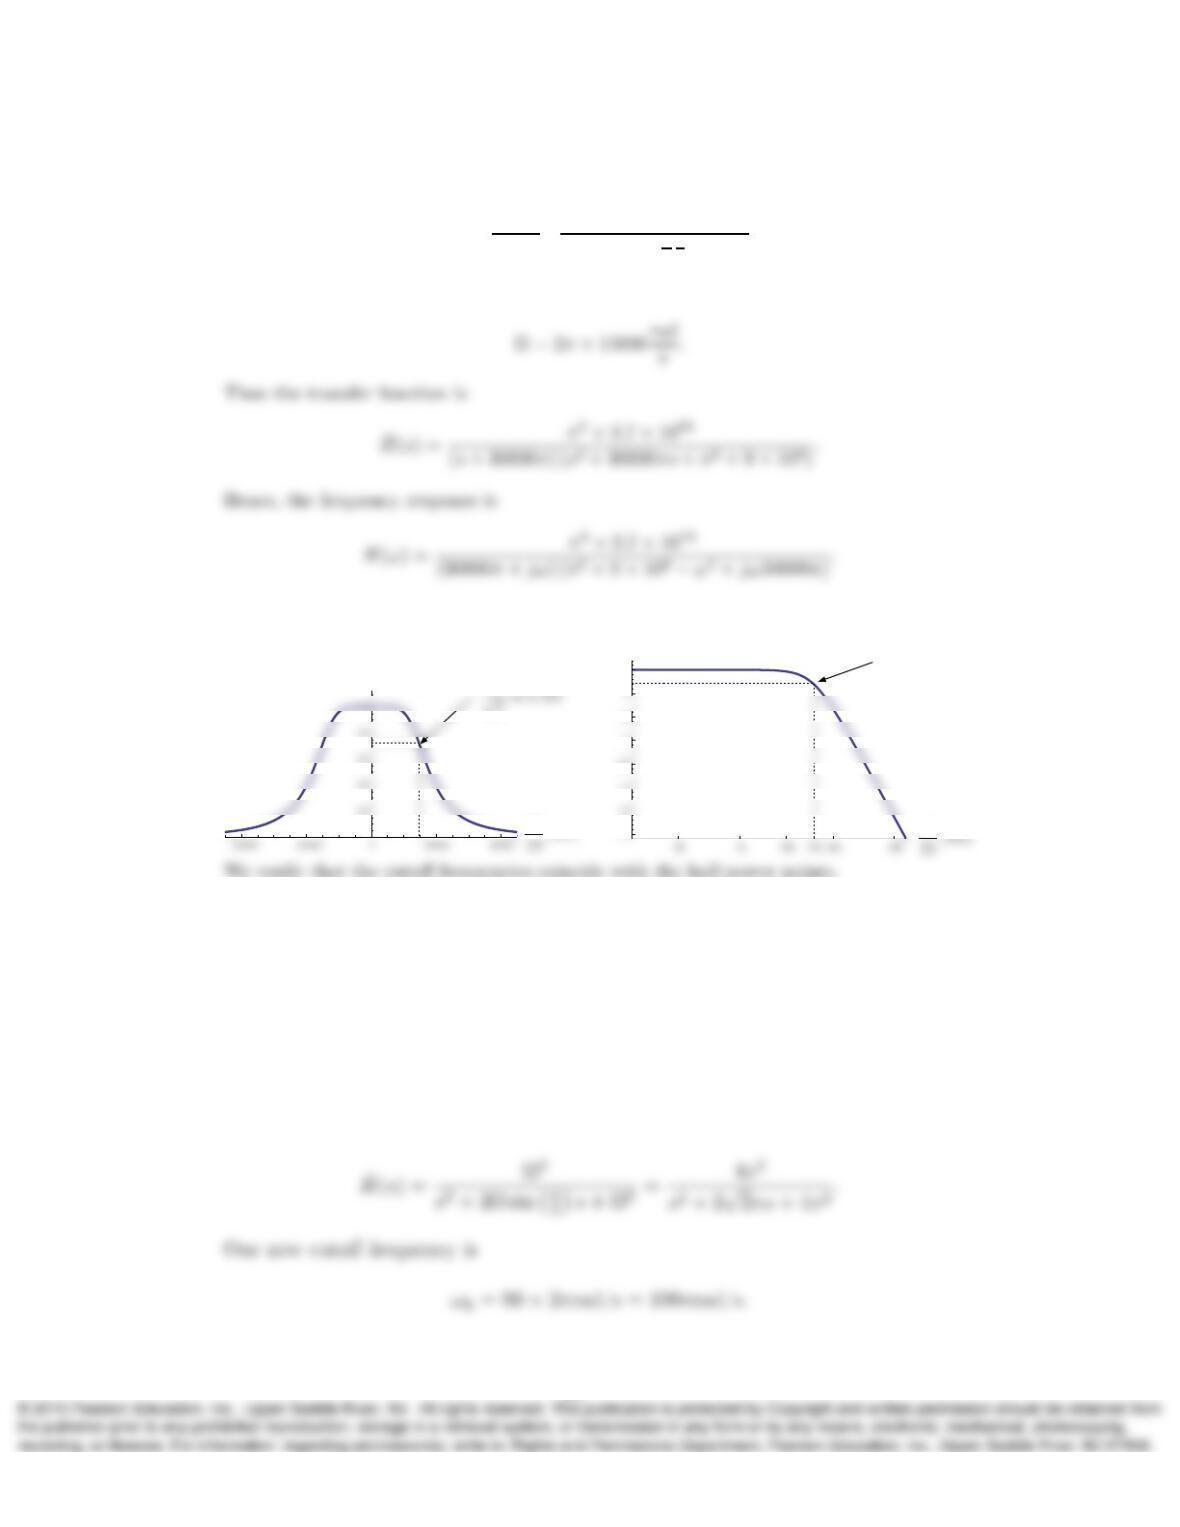
Since n= 3 is even, we have
ˆ
H(s) = Ω
s+ Ω Ω2
s2+ 2Ω sin(π
2
1
3)s+ Ω2.
We are given the cutoff frequency
Plotting |H(ω)|in linear scale and in decibels:
–35
–25
–20
–15
–10
0
ω
ω
|H(ω)|
|H(ω)|dB
1
−3dB
14. Design a 2nd-order Butterworth high-pass filter having cutoff frequency 50 Hz.
Do so by first designing a Butterworth low-pass filter having cutoff frequency 1
Hz and then transforming it to a high-pass filter using the low-pass to high-pass
transformation in Section 12.3.3. Sketch the magnitudes of the frequency responses
for both the low-pass prototype and the high-pass filter.
Solution:
We design the Butterworth low-pass filter with n= 2, and Ω = 2πrad/s, obtaining
the following transfer function:
10
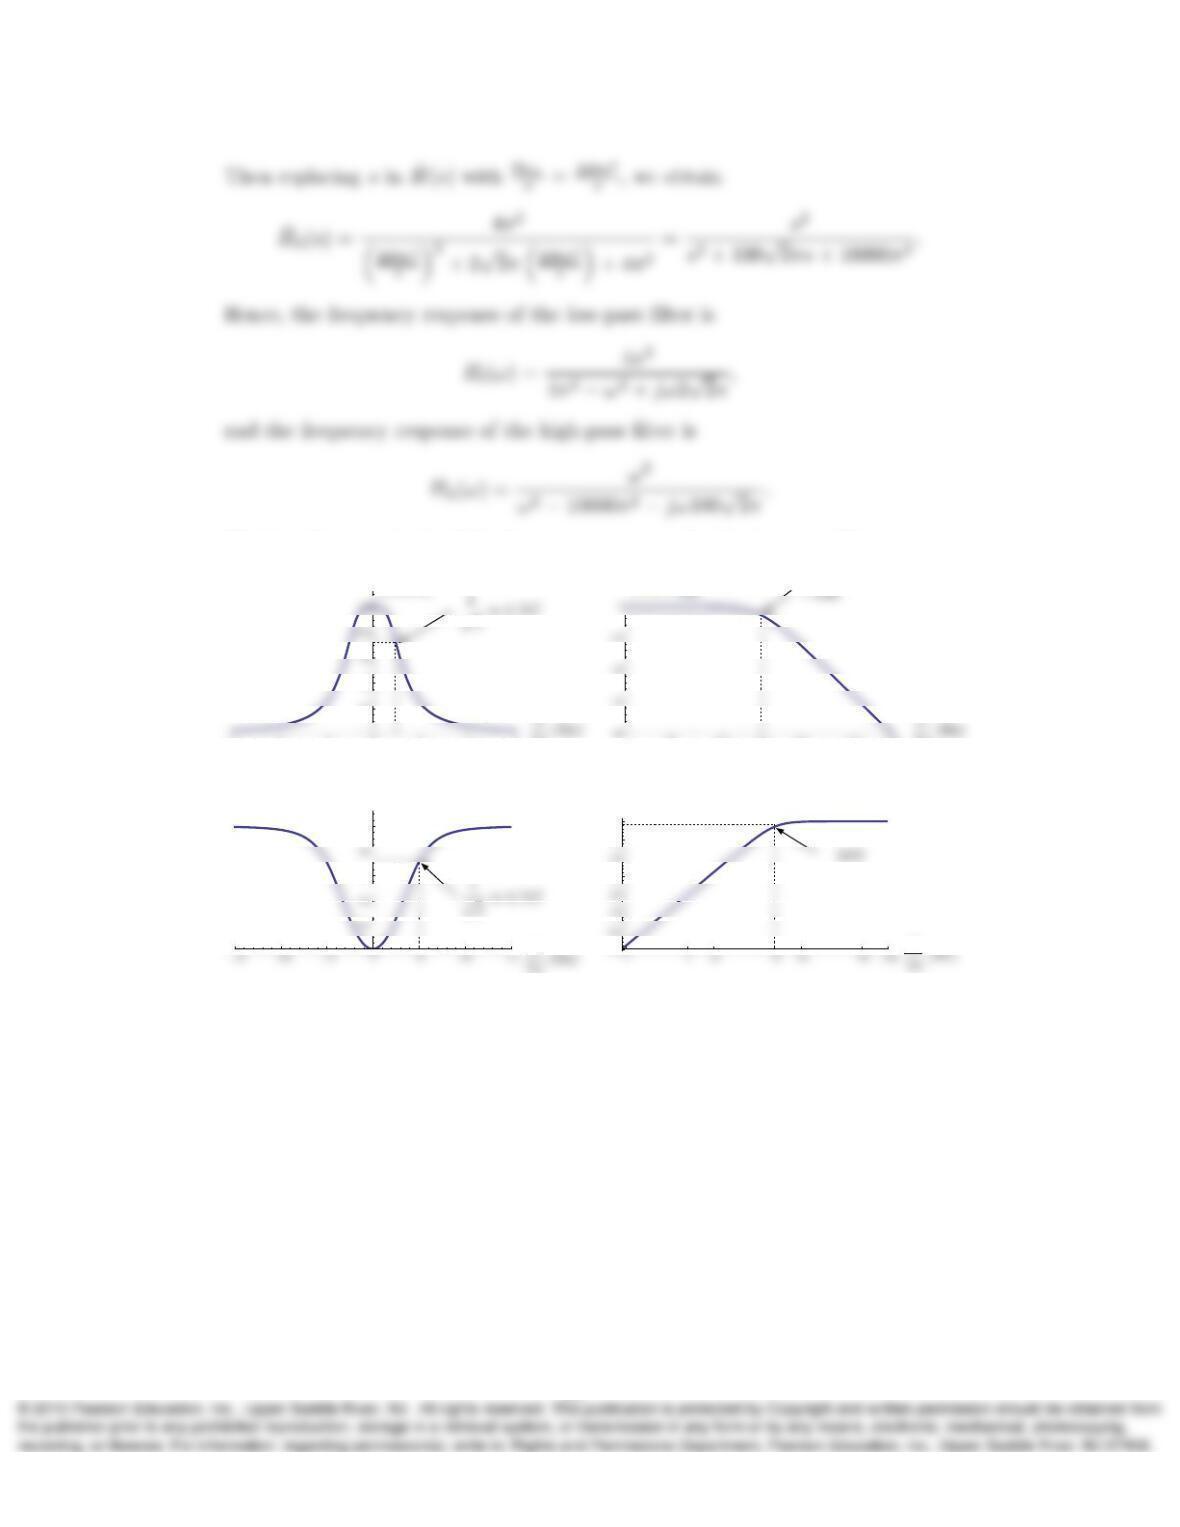
Plotting the magnitude of the frequency response for the low-pass filter:
–6
–4
–2
0
2
4
6
0.2
0.4
1.0
0.5
2.0
0.2
5.0
10.0
2π(Hz)
2π(Hz)
|Hl(ω)||Hl(ω)|dB
Plotting the magnitude of the frequency response for the high-pass filter:
0.6
1.0
–70
–30
–10
0
ω
ω
|Hh(ω)||Hh(ω)|dB
15. Show that application of the low-pass to band-pass transformation in Section 12.3.3
results in a band-pass transfer function with frequency response satisfying
HB(ωl) = H(−Ω)
and
HB(ωu) = H(Ω)
where HBis the band-pass frequency response with lower and upper cutoff frequen-
cies ωland ωu,respectively, and His the frequency response of the low-pass filter
with cutoff frequency Ω. Notice that these relations prove that the filter trans-
formation moves the 3-dB cutoff frequencies of the low-pass filter to the desired
frequencies for the band-pass filter.
11
Solution:
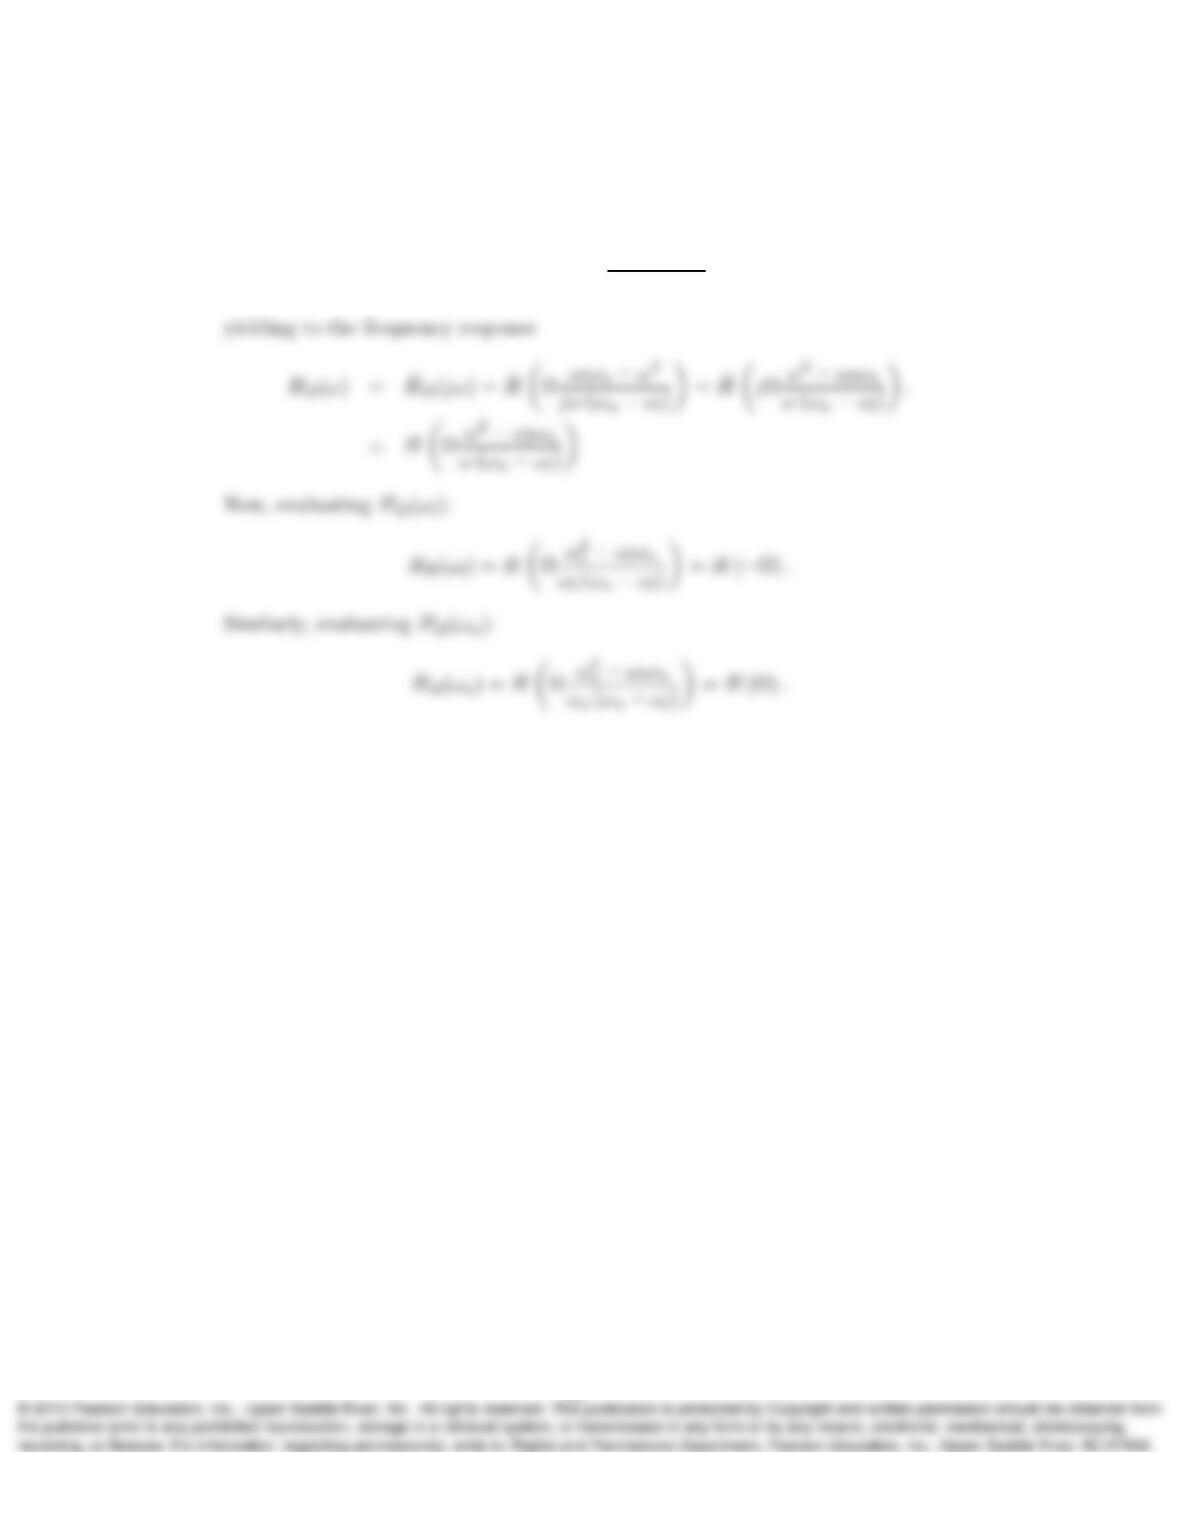
We obtain the band-pass transfer function with the following substitution
ˆ
HB(s) = ˆ
HΩs2+ωlωu
s(ωu−ωl).
12