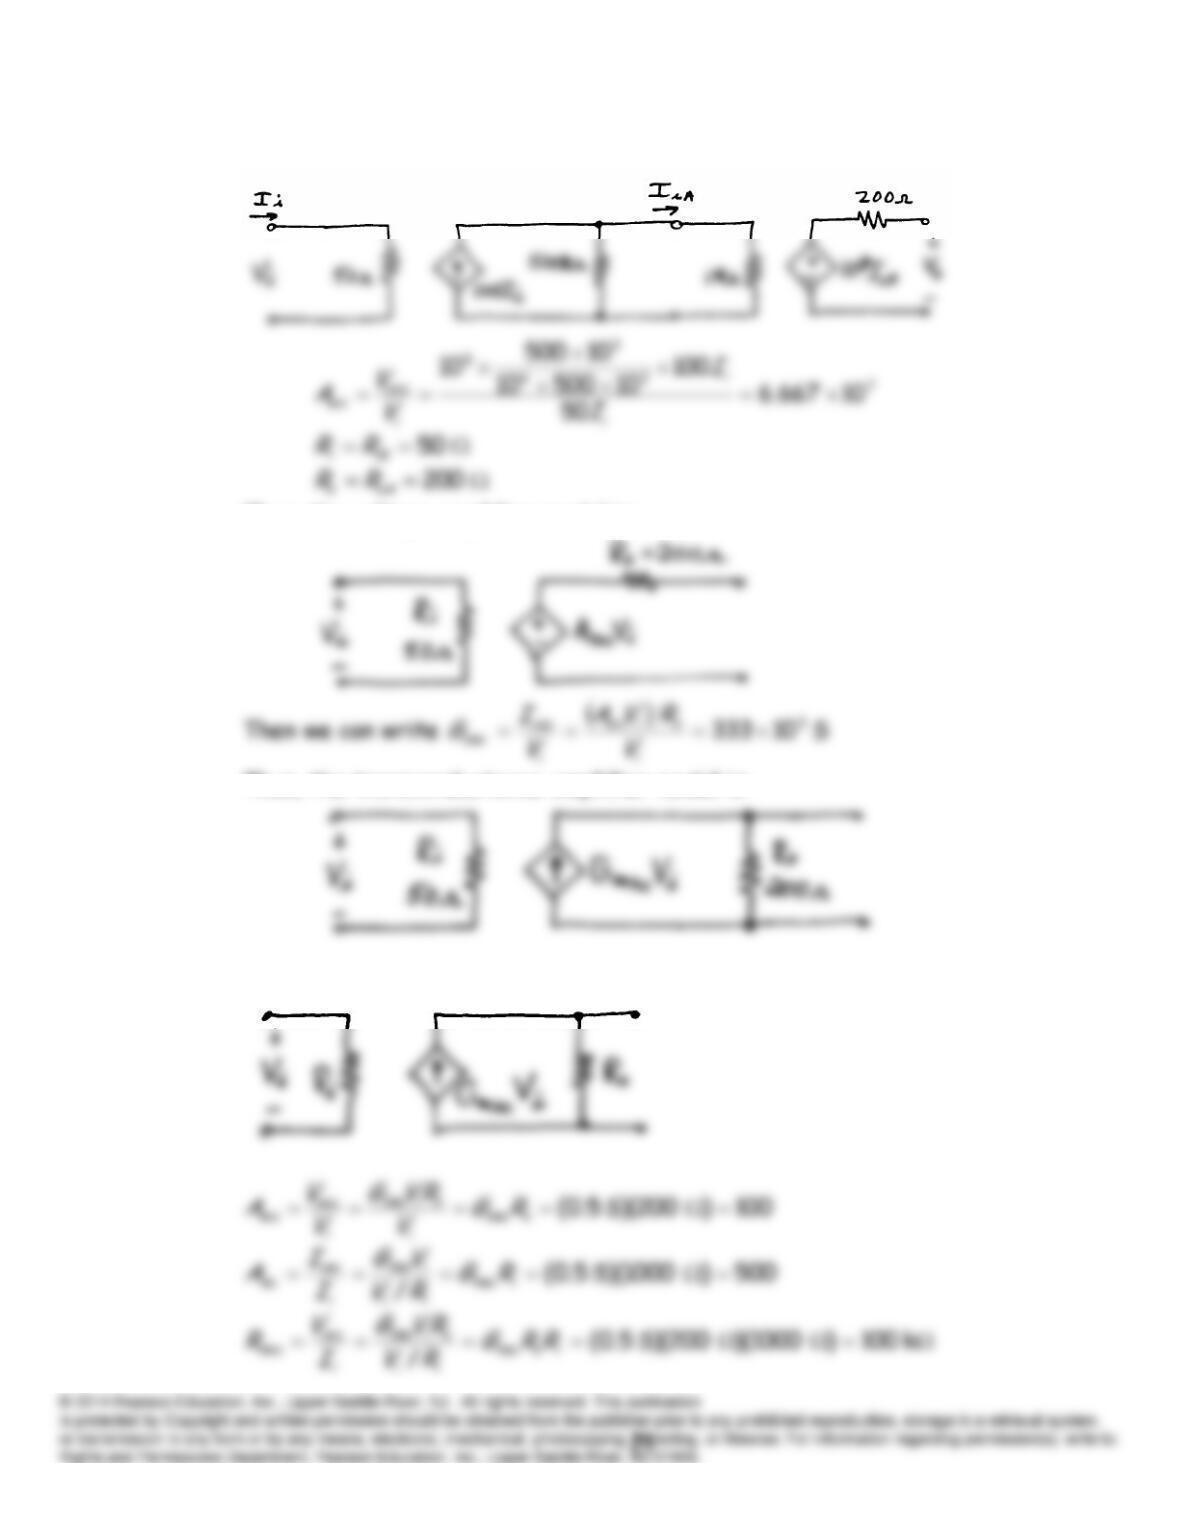
P11.39 The equivalent circuit is:
Thus, the voltage-amplifier model is:
Thus, the transconductance-amplifier model is:
P11.40* The circuit model for the amplifier is
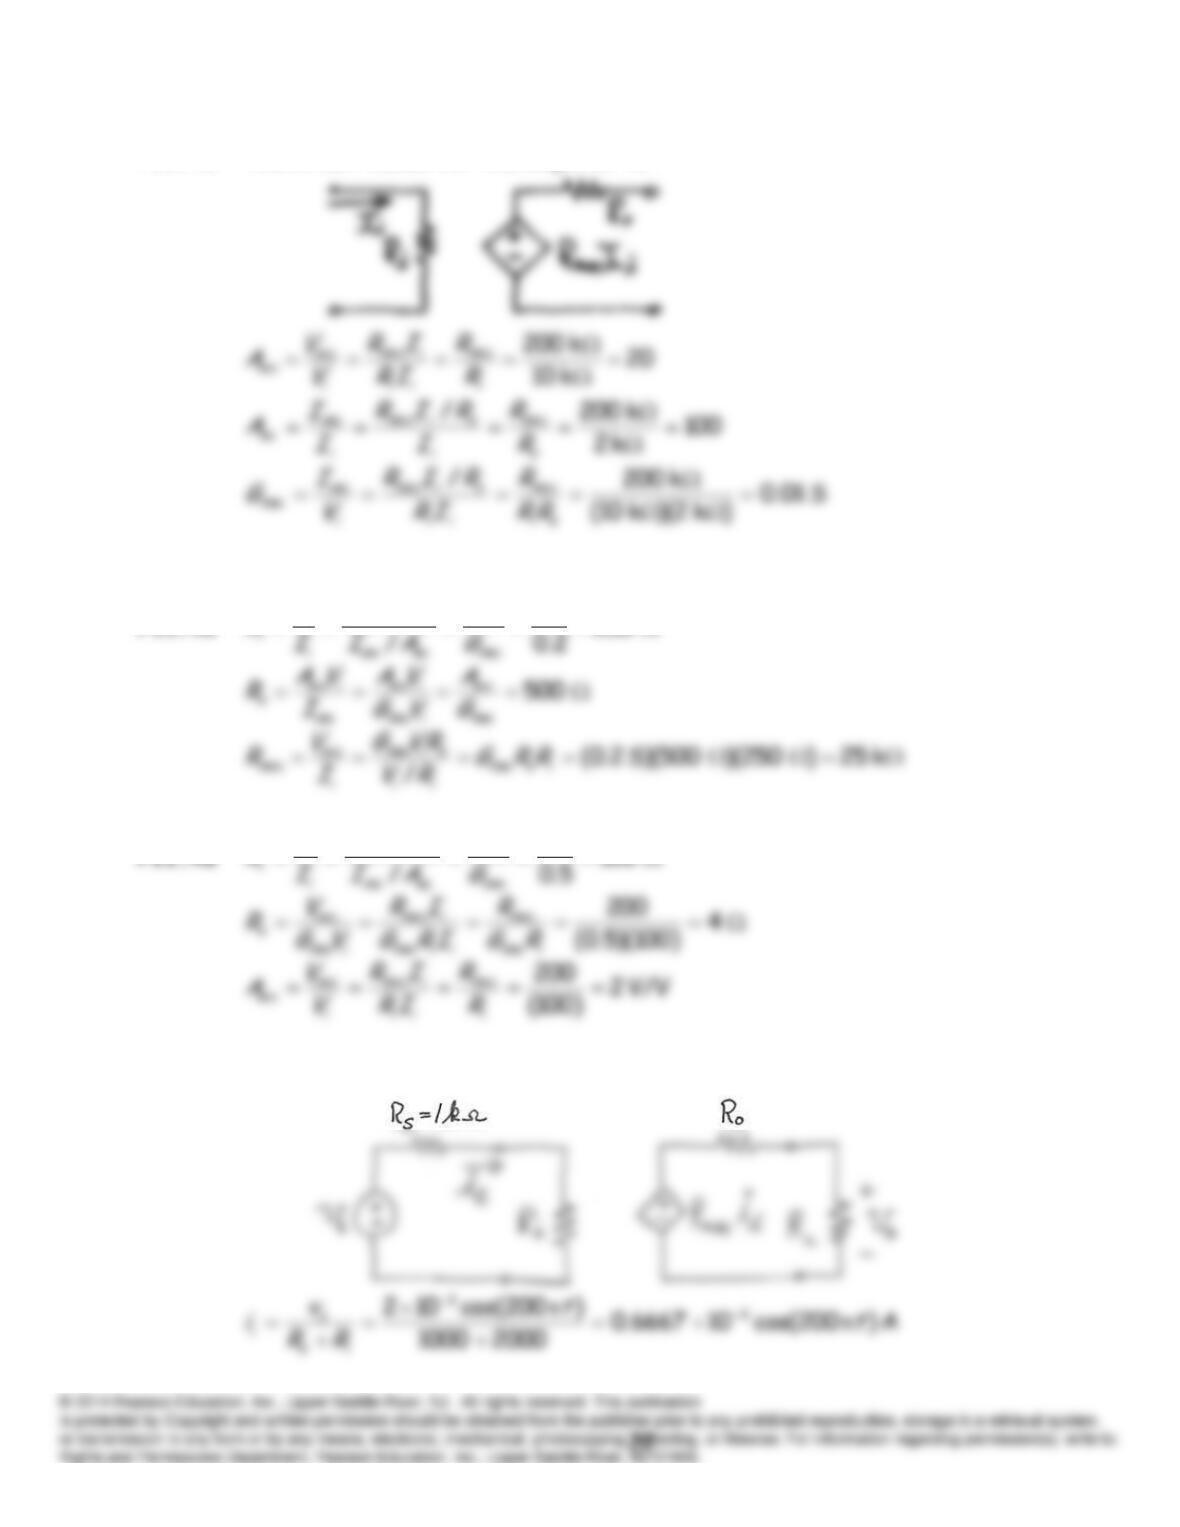
P11.41* The circuit model for the amplifier is:
P11.42
250
50
/
sc
scsc
i
mo
i
A
GI
V
R
50
/
sc
scsc
i
mo
i
A
GI
V
P11.44 The equivalent circuit is:
P11.45 An amplifier with a very high input resistance is needed if we want the
P11.46 An amplifier with a very low input impedance is needed if we want the
P11.47 To supply a constant voltage to a variable number of parallel loads, we
P11.48 (a) To force a current that is proportional to the input signal through the
P11.49 If a transmission line is connected to the input of an amplifier and if we
11.1 in the text.
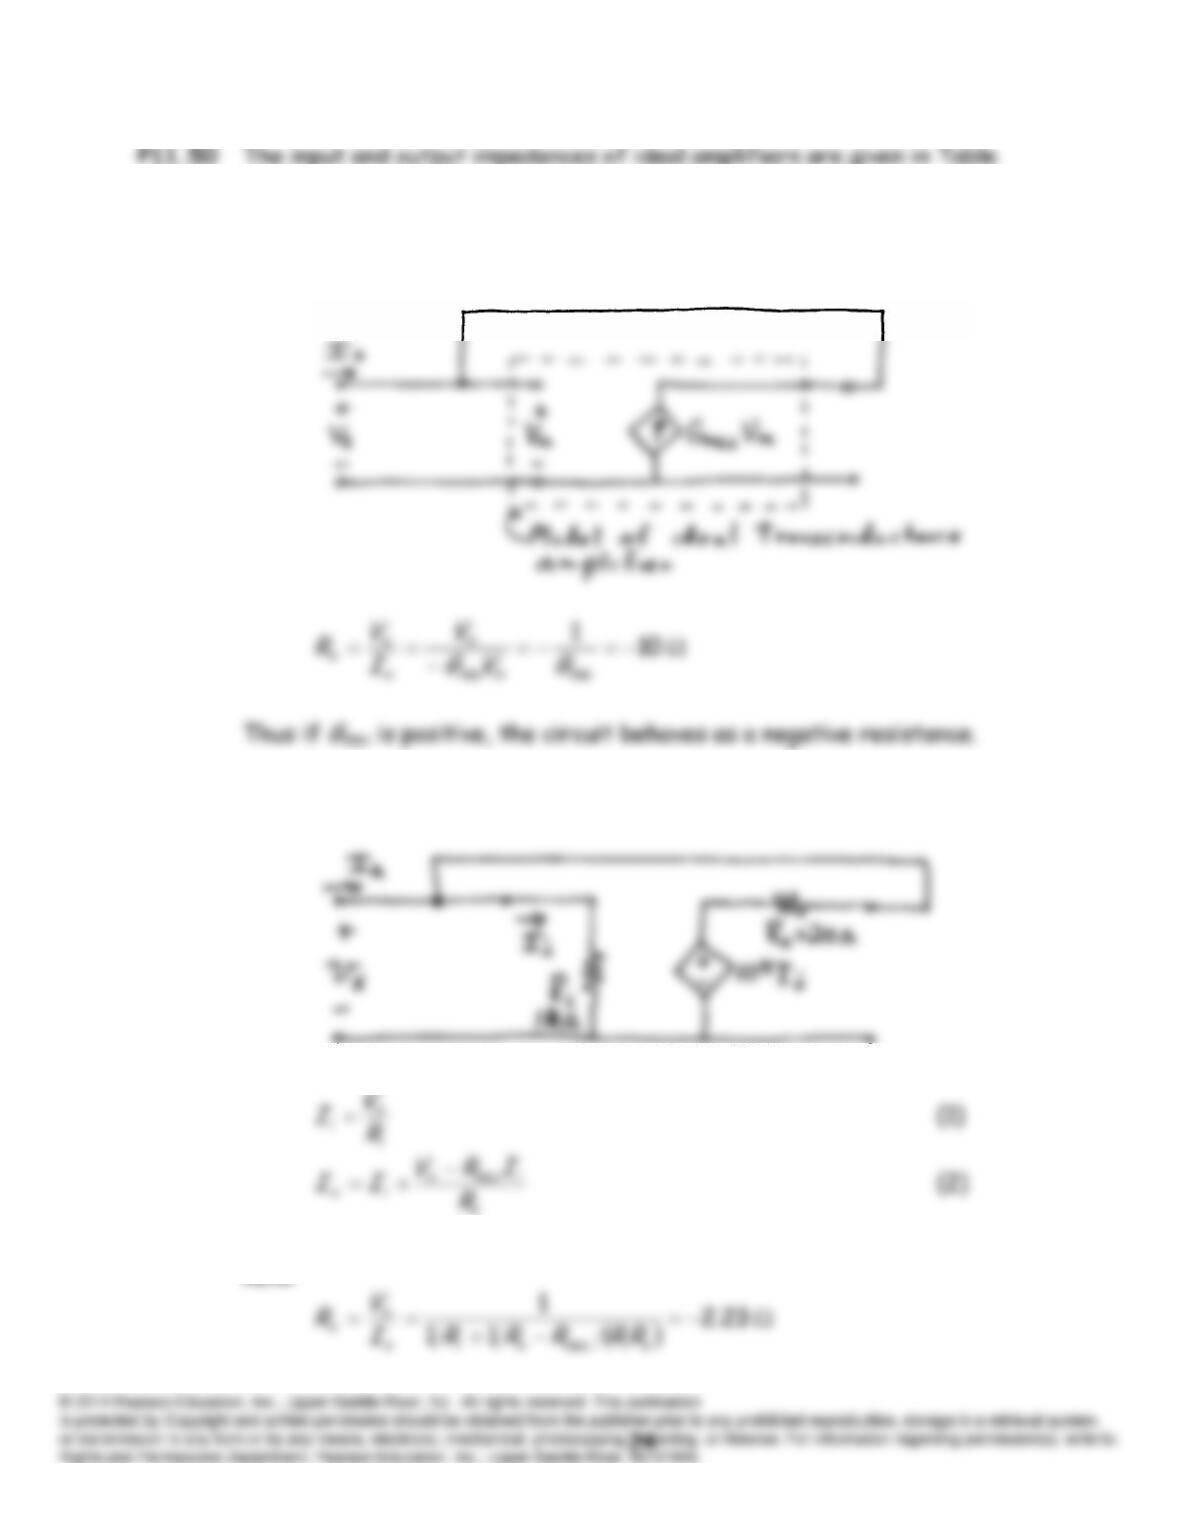
P11.51 The equivalent circuit is:
P11.52* The equivalent circuit is:
We can write:
Using Equation (1) to substitute for
i
I
in Equation (2) and solving, we
have:
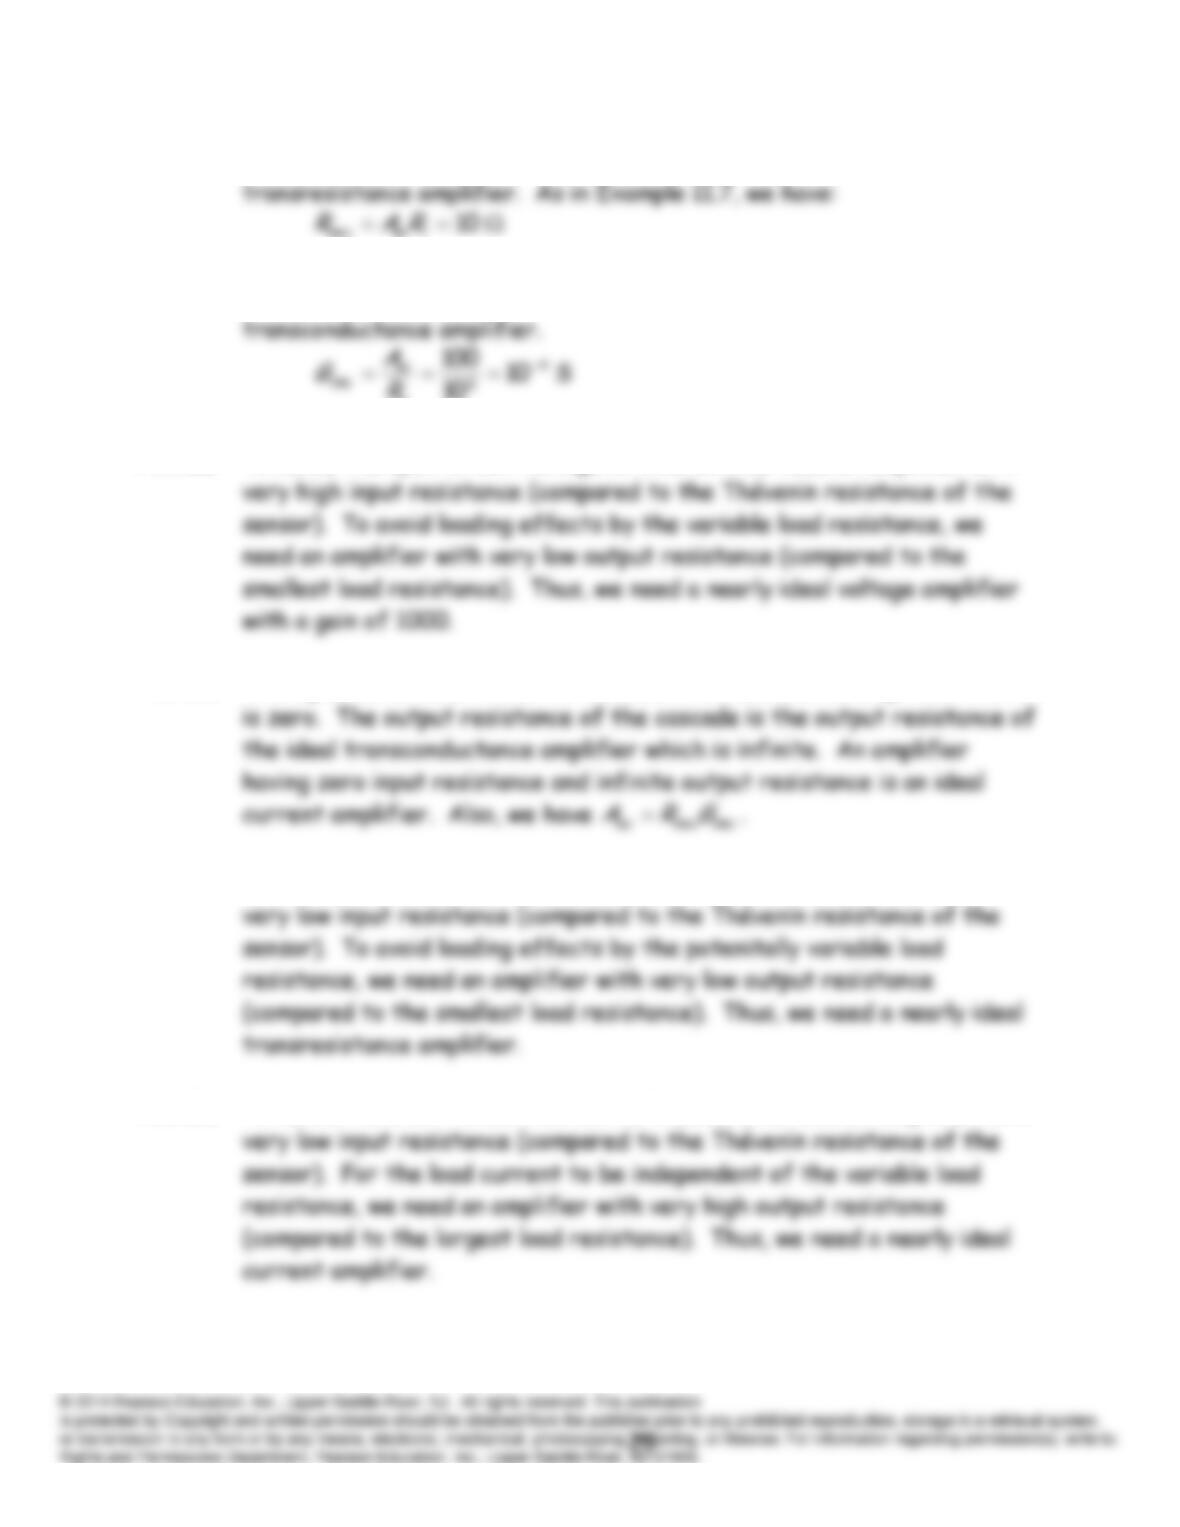
P11.53 We have
L
os
iRRRR
and
. Thus, we have an approximately ideal
P11.54 We have
L
os
iRRRR
and
. Thus, we have an approximately ideal
o
P11.55* To sense the open-circuit voltage of a sensor, we need an amplifier with
P11.56* The input resistance is that of the ideal transresistance amplifier which
P11.57 To sense the short-circuit current of a sensor, we need an amplifier with
P11.58 To sense the short-circuit current of a sensor, we need an amplifier with
P11.59 The input resistance is that of the voltage amplifier which is infinite.
The output resistance of the cascade is the output resistance of the
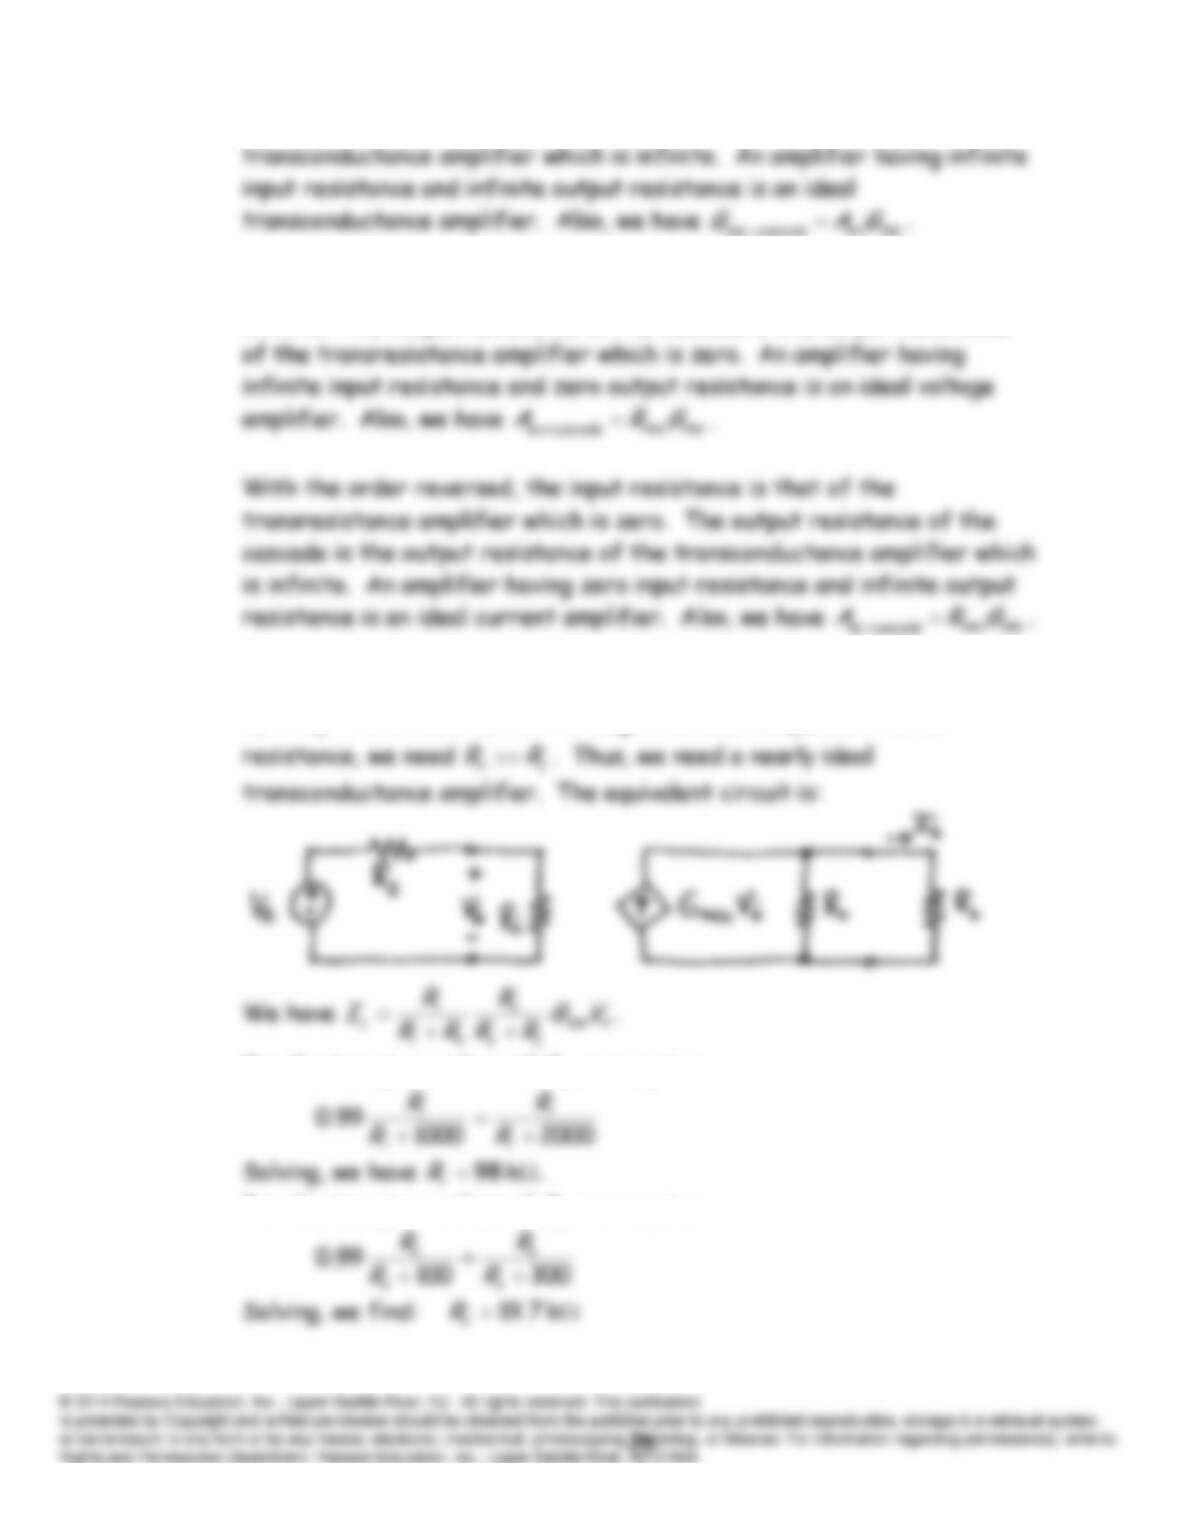
P11.60 The input resistance is that of the transconductance amplifier which is
infinite. The output resistance of the cascade is the output resistance
P11.61* To sense the source voltage with minimal loading effects, we need
s
iRR
. To force a current through the load independent of its
For the two given values of
s
R
, we require:
For the two given values of
L
R
, we require:
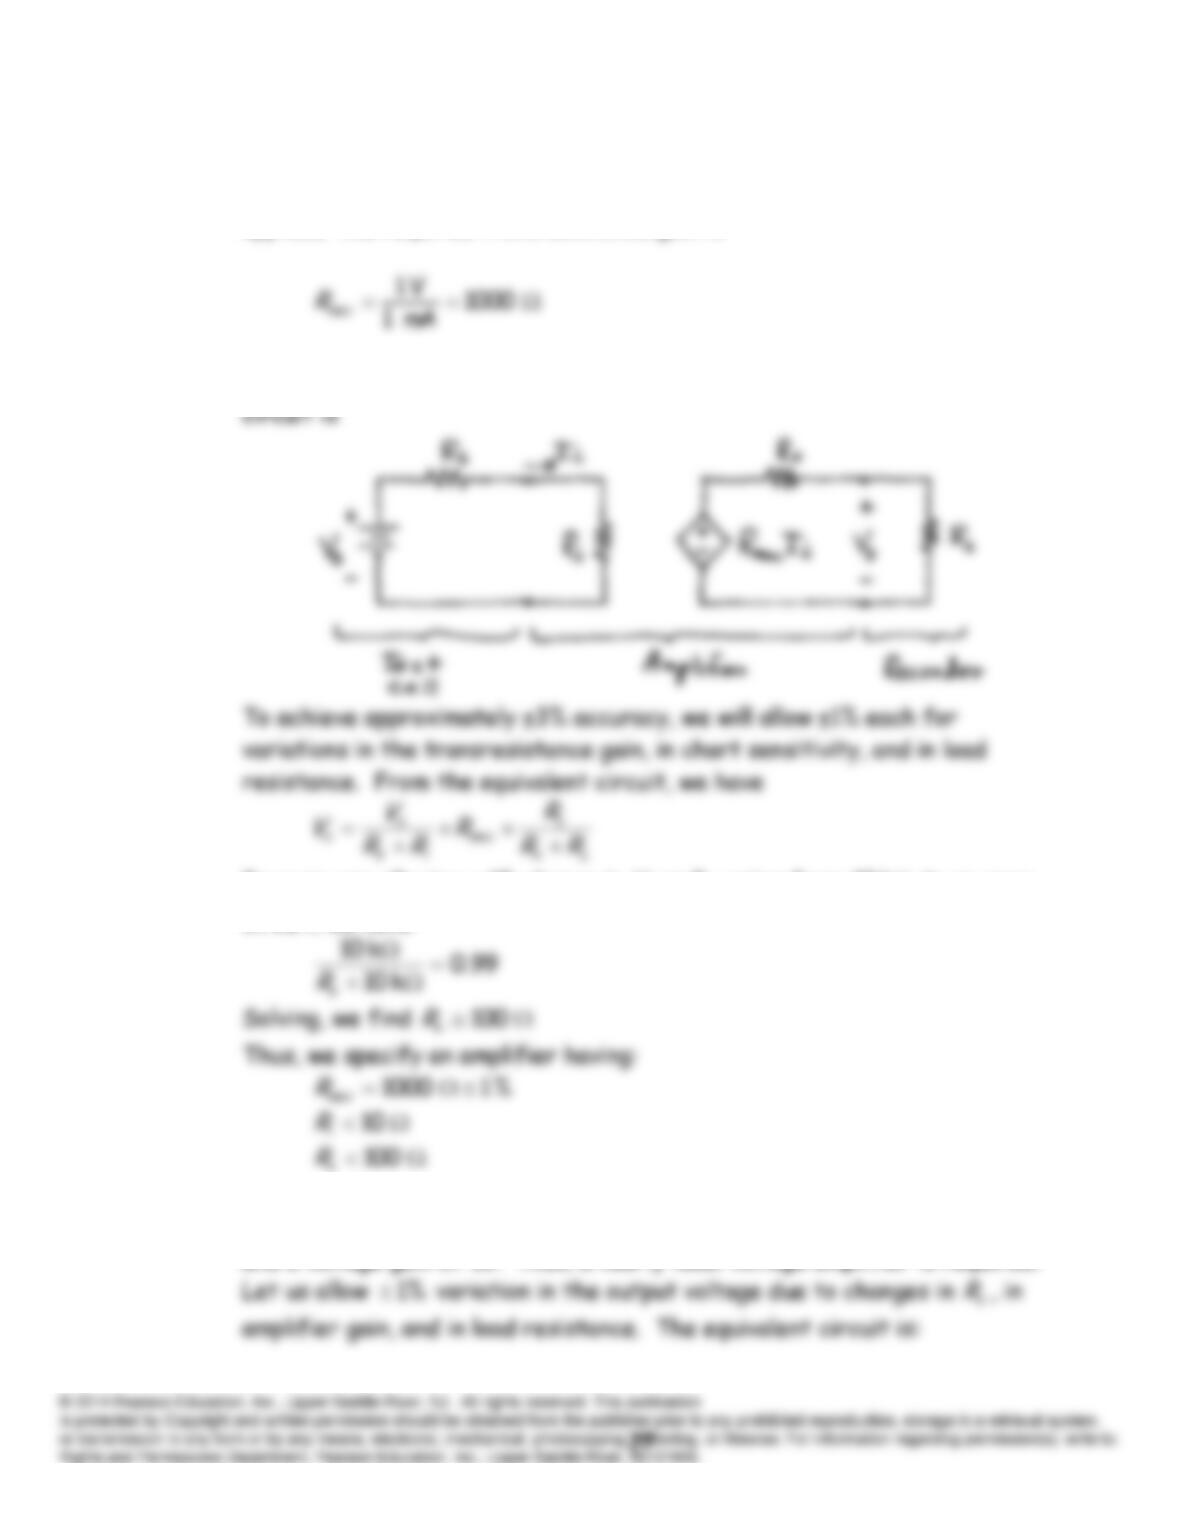
P11.62 We need
k 10 and 10
o
iRR
. Because we want the chart
calibration to be 1 mA/cm and the chart pen deflects 1 cm per volt
applied, the required transresistance gain is
Thus, a nearly ideal transresistance amplifier is needed. The equivalent
Because are allowing a 1% change in
L
oRV
as
varies from
k 10
to an open
circuit, we have:
P11.63 We need an amplifier with high input resistance, low output resistance,
and a voltage gain of 10. Thus, a nearly ideal voltage amplifier is required.
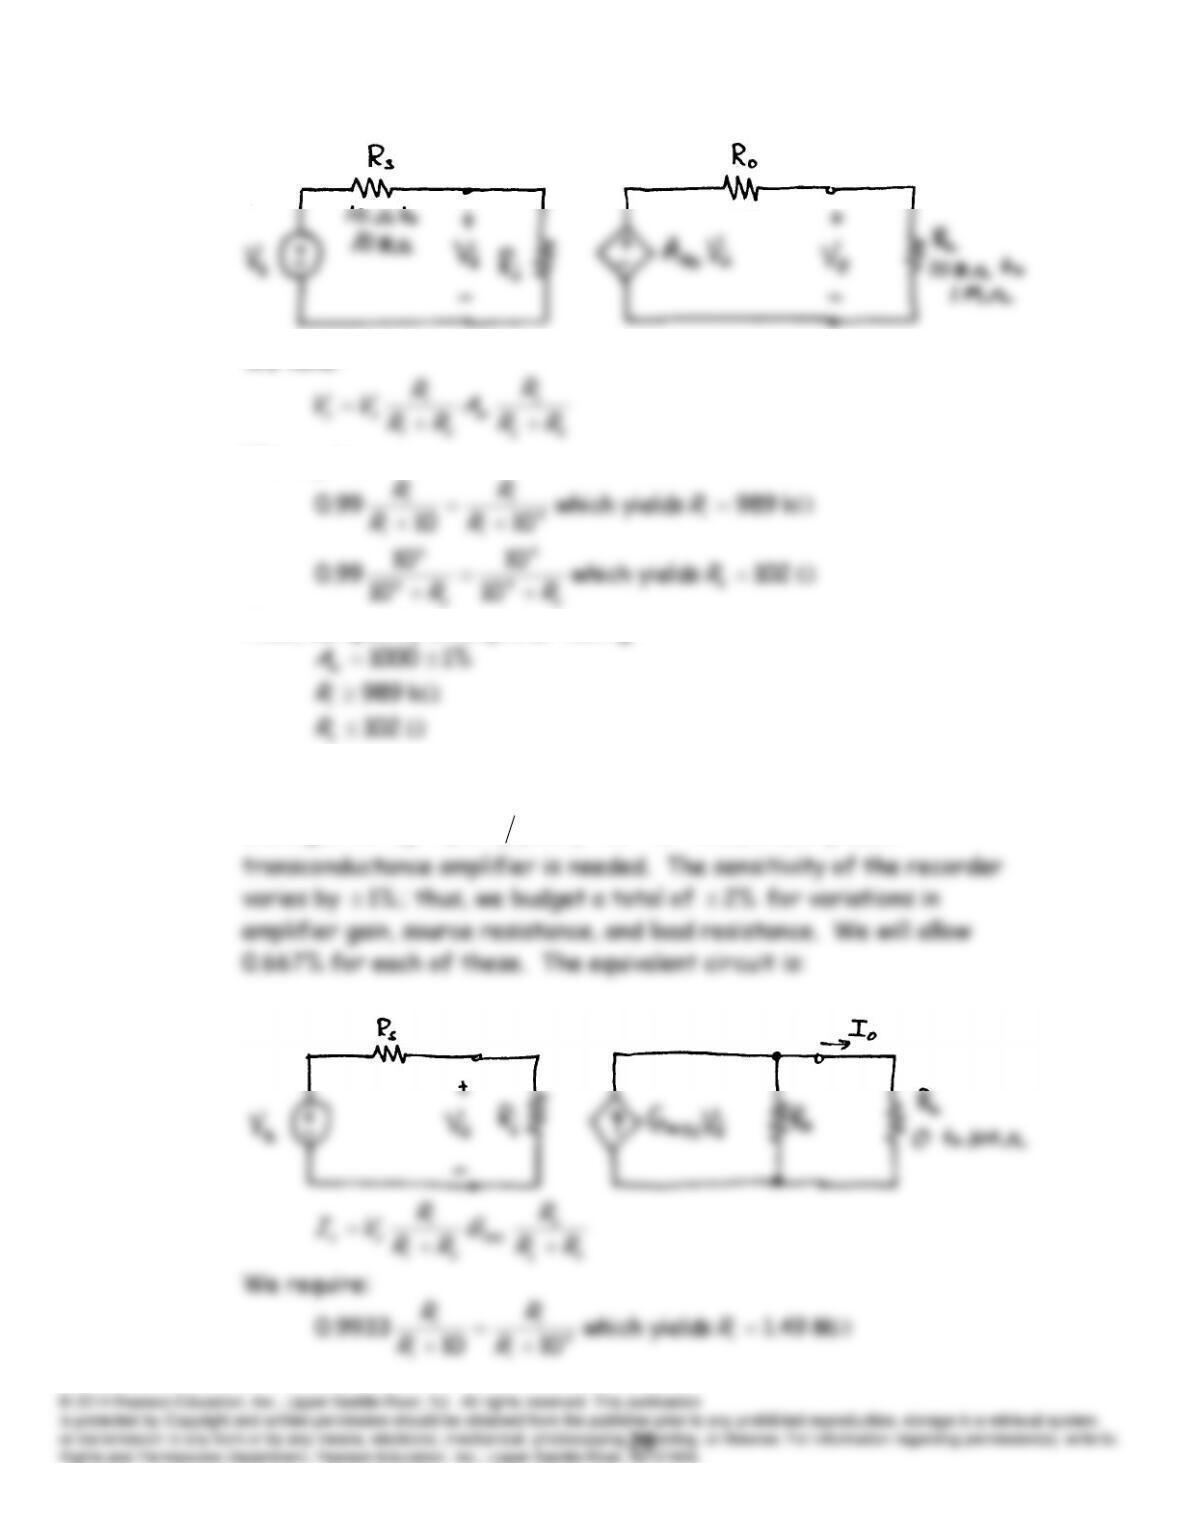
We have:
We require:
Thus, we specify an amplifier having:
P11.64 We need an amplifier with high input resistance, high output resistance,
and a gain of
S. 10V 1.0mA 1 2
m
G
Thus, a nearly ideal
P11.65
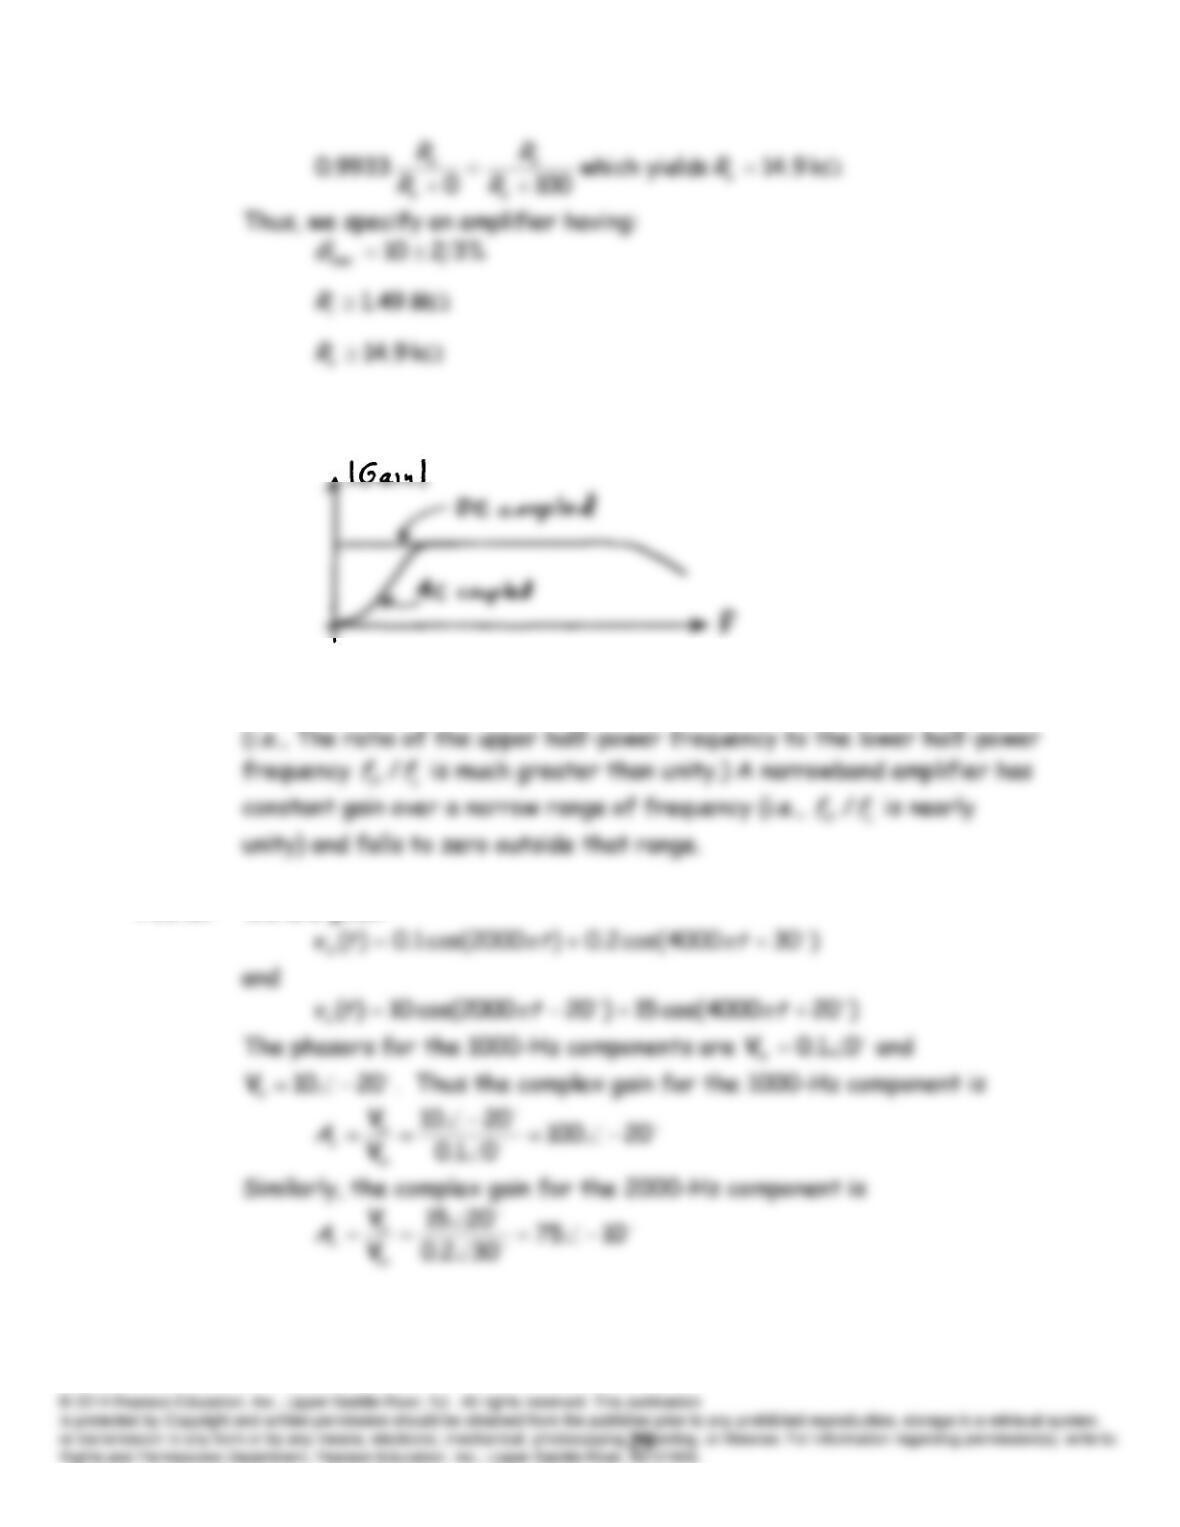
P11.66 A wideband amplifier has constant gain over a wide range of frequency.
P11.67* We are given
P11.68* The signal to be amplified is the short-circuit current of an
electrochemical cell (or battery). This signal is dc and therefore a dc-
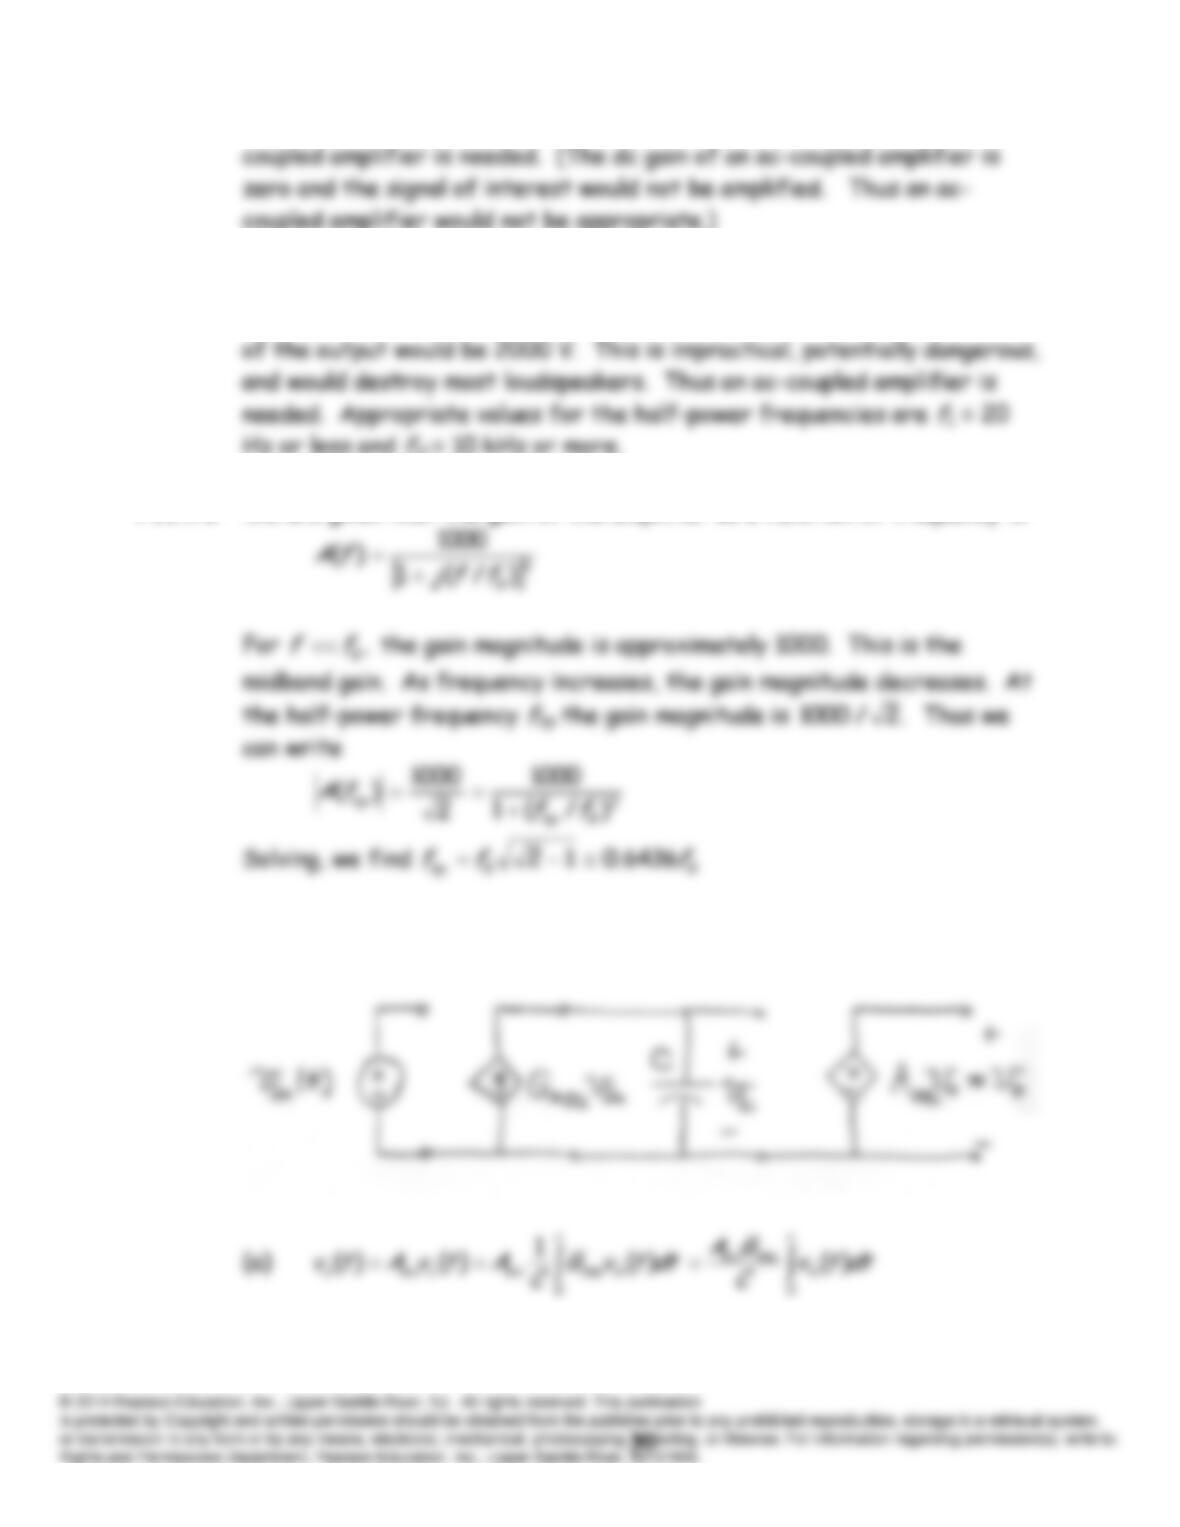
P11.69 We need a midband voltage gain of (10 V)/(10 mV) = 1000 for the audio
signal. Thus if a dc coupled amplifier were to be used the dc component
P11.70* We are given that the gain of the amplifier as a function of frequency is:
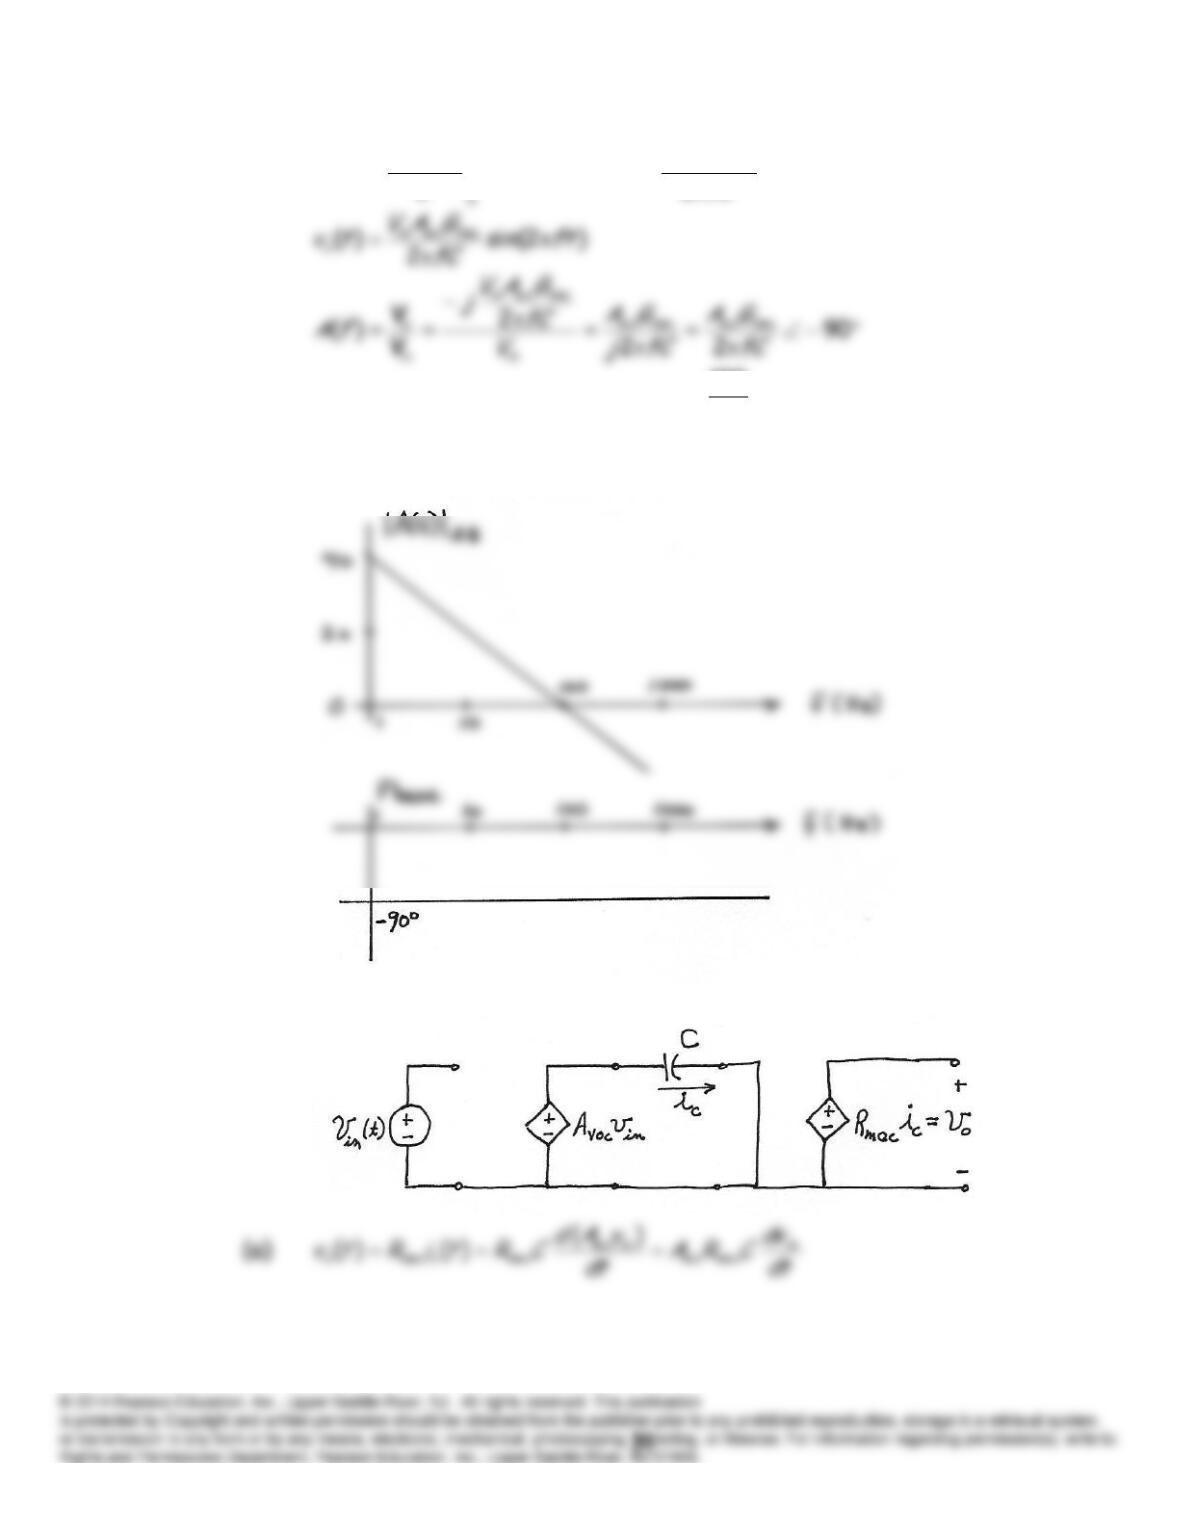
P11.71 The equivalent circuit is:
(b)
t
mvm
t
m
mv
oft
fC
GAV
dtftV
C
GA
tv
0
scoc
scoc )2sin(
2
)2cos()(
(c) For the values given, we have
90
100
)(
f
fA
. Then, the
magnitude of the gain in dB is
)log(2040|)(|
ffA dB
. The Bode Plots of
magnitude and phase are:
P11.72 The equivalent circuit is:
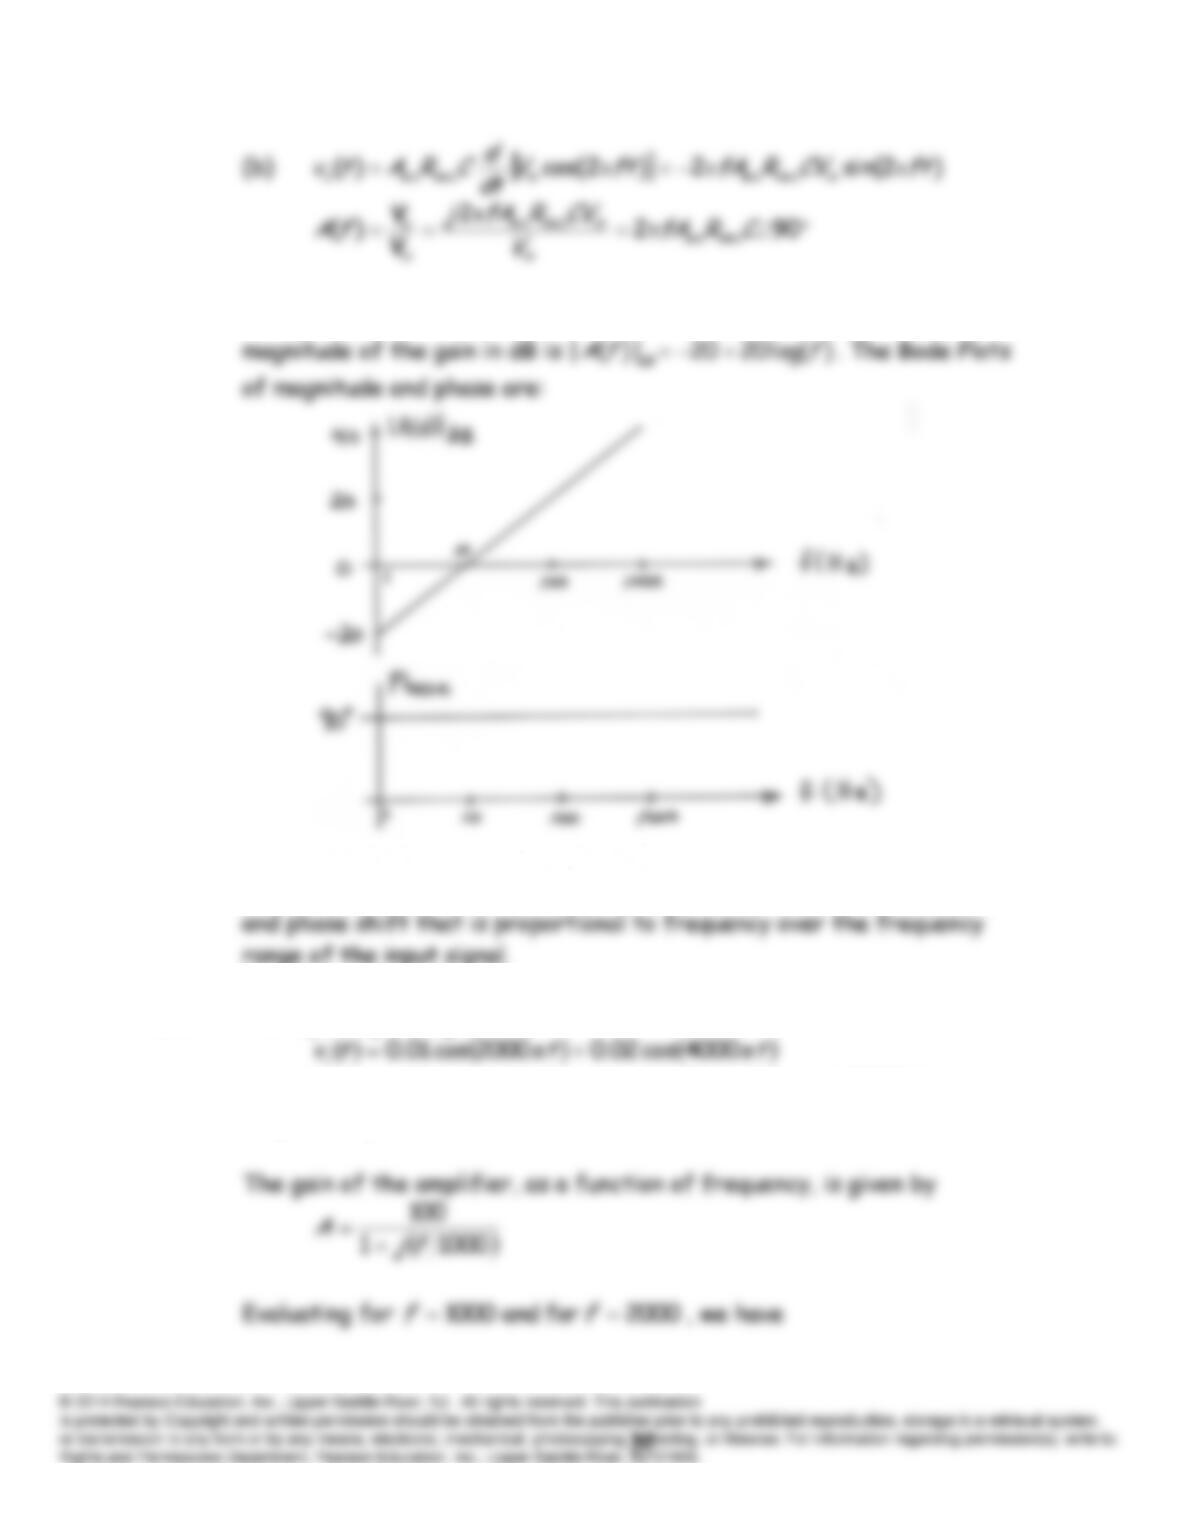
(c) For the values given, we have
901.0)(
ffA
. Then, the
P11.73 To avoid linear distortion, an amplifier must have constant gain magnitude
P11.74 The input signal is given as
which has components with frequencies of 1000 Hz and 2000 Hz
respectively.
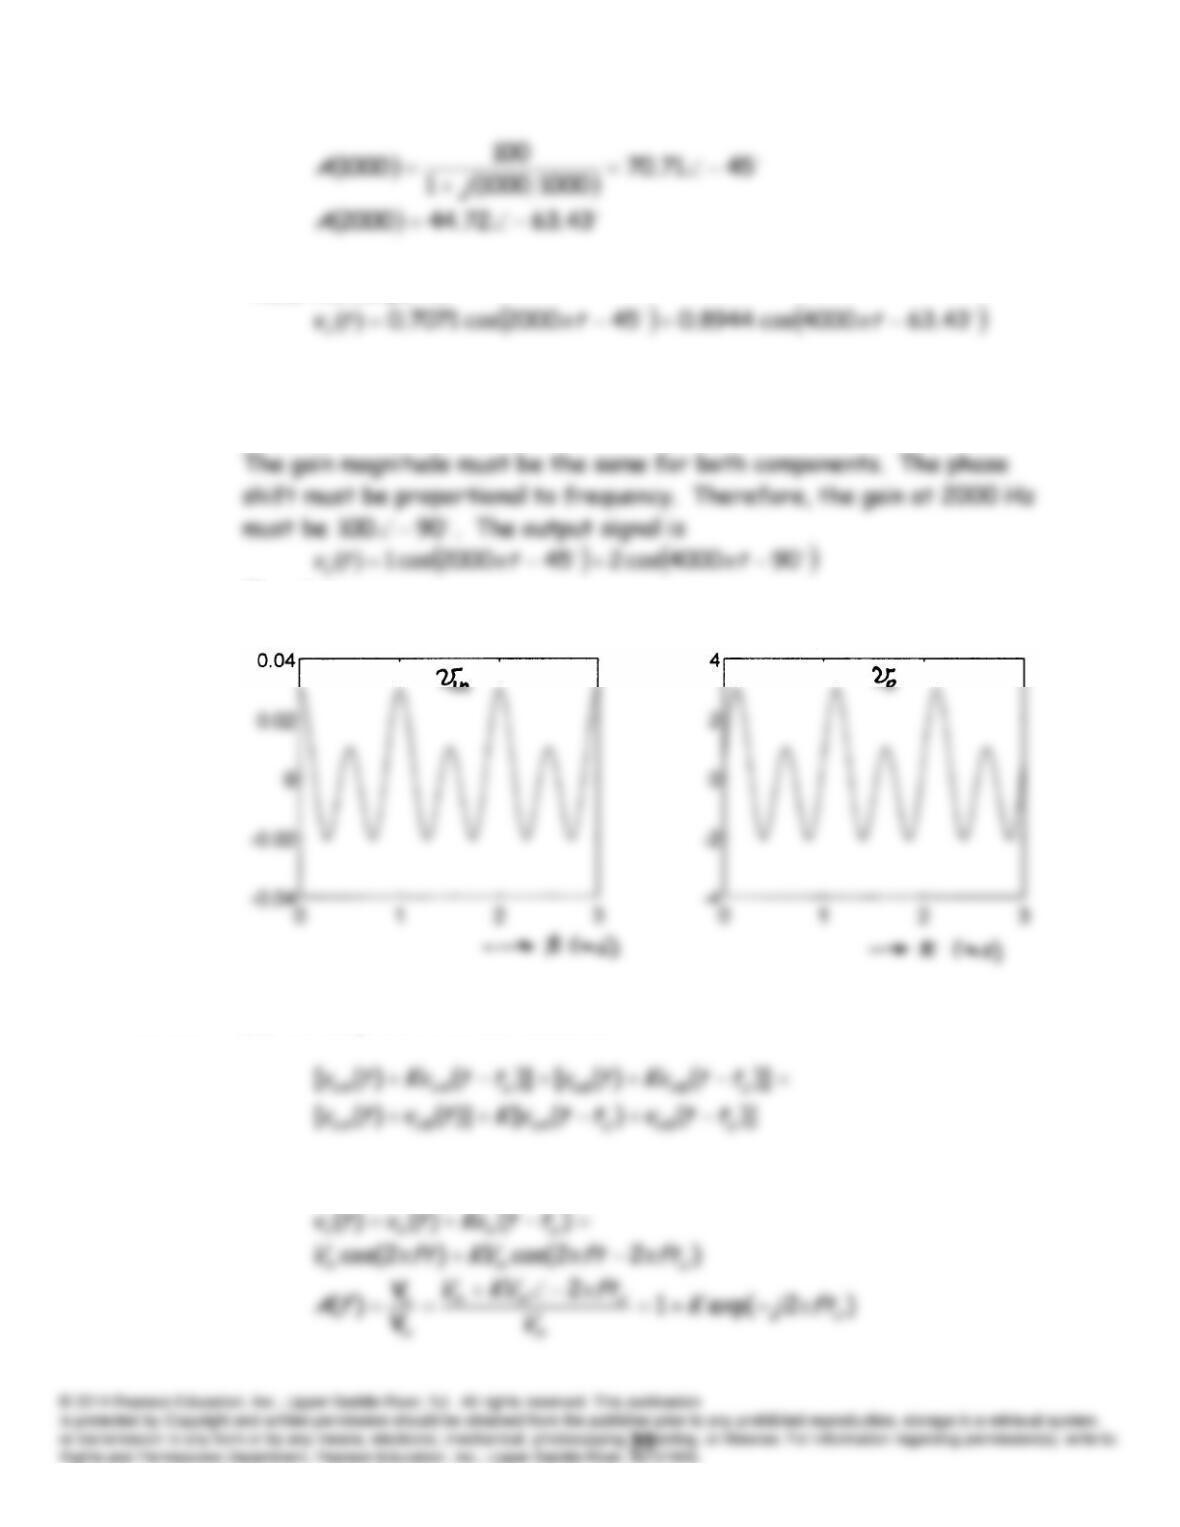
Thus, the output is:
P11.75*
tttvin
ππ 4000cos02.02000cos01.0
Thus,
tvin
contains a 1000 Hz component and a 2000 Hz component.
The plots are:
P11.76 (a) The amplifier is linear because
(b) For
)2cos()(
in
ftVtv m
, we have
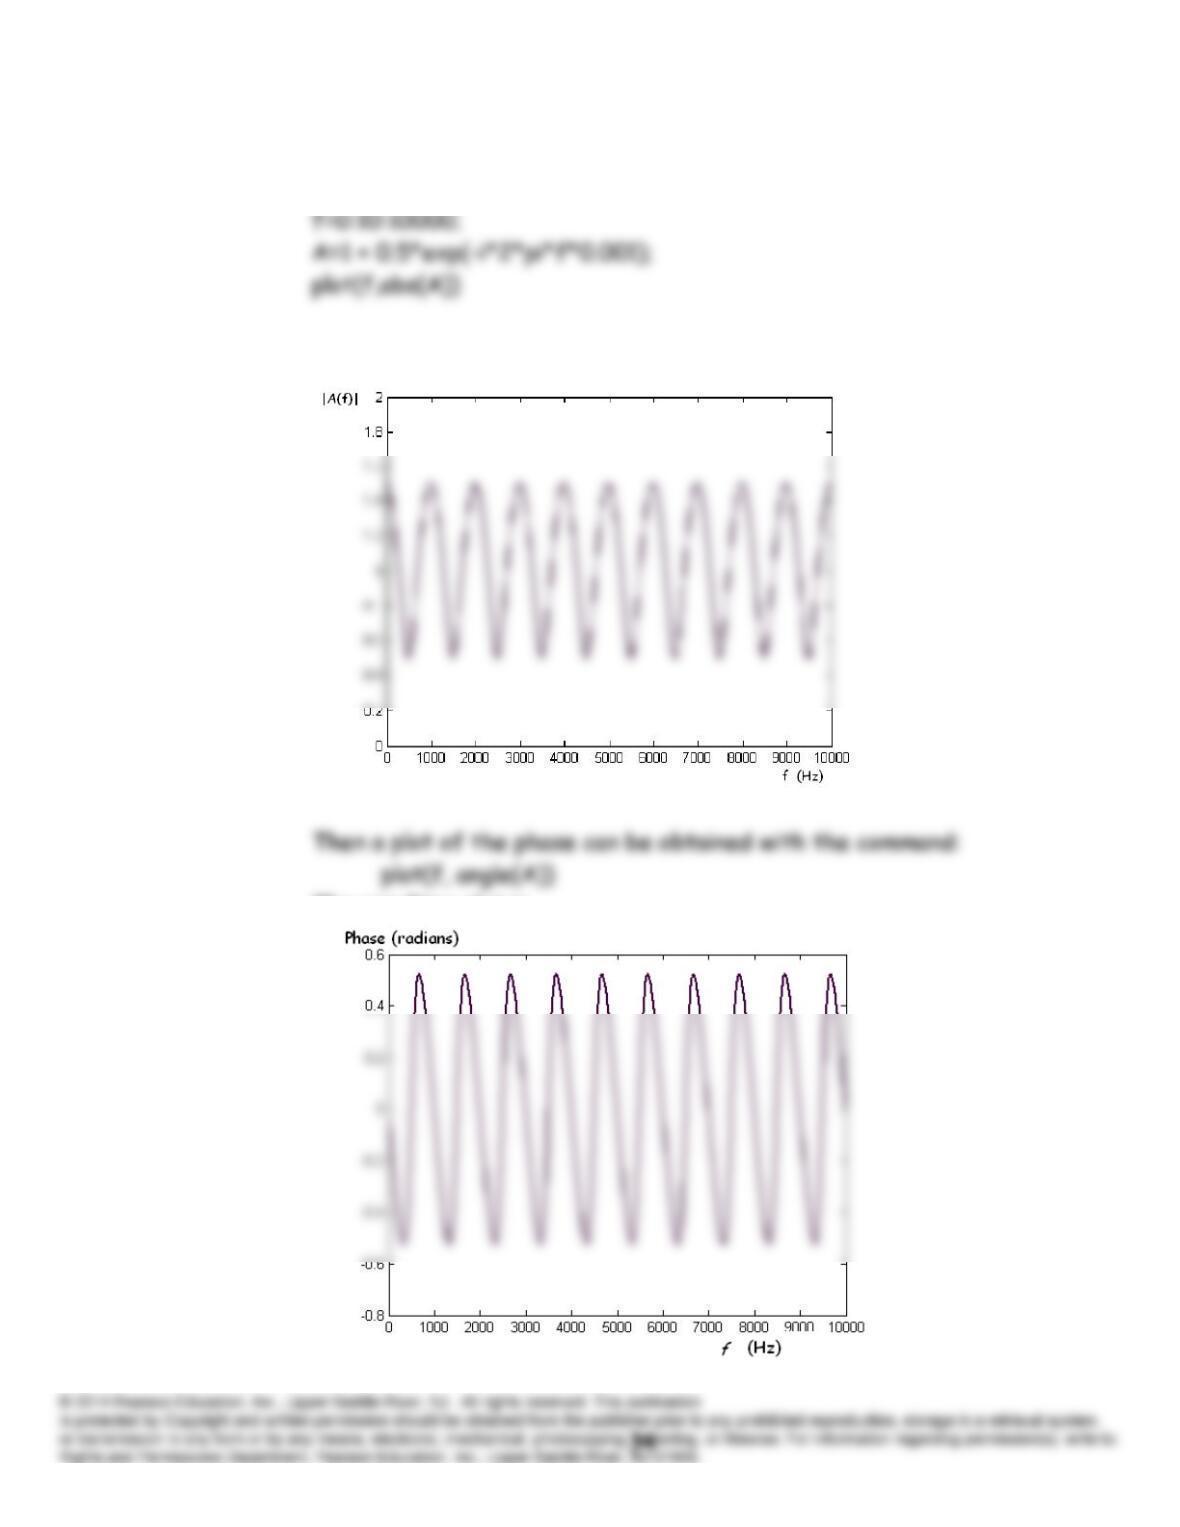
(c) In MATLAB, a plot of the magnitude can be obtained with the
commands:
The resulting magnitude plot is:
The resulting plot is
P11.77 (a) The amplifier is linear because
(b) For
)2cos()(
in
ftVtv m
, we have
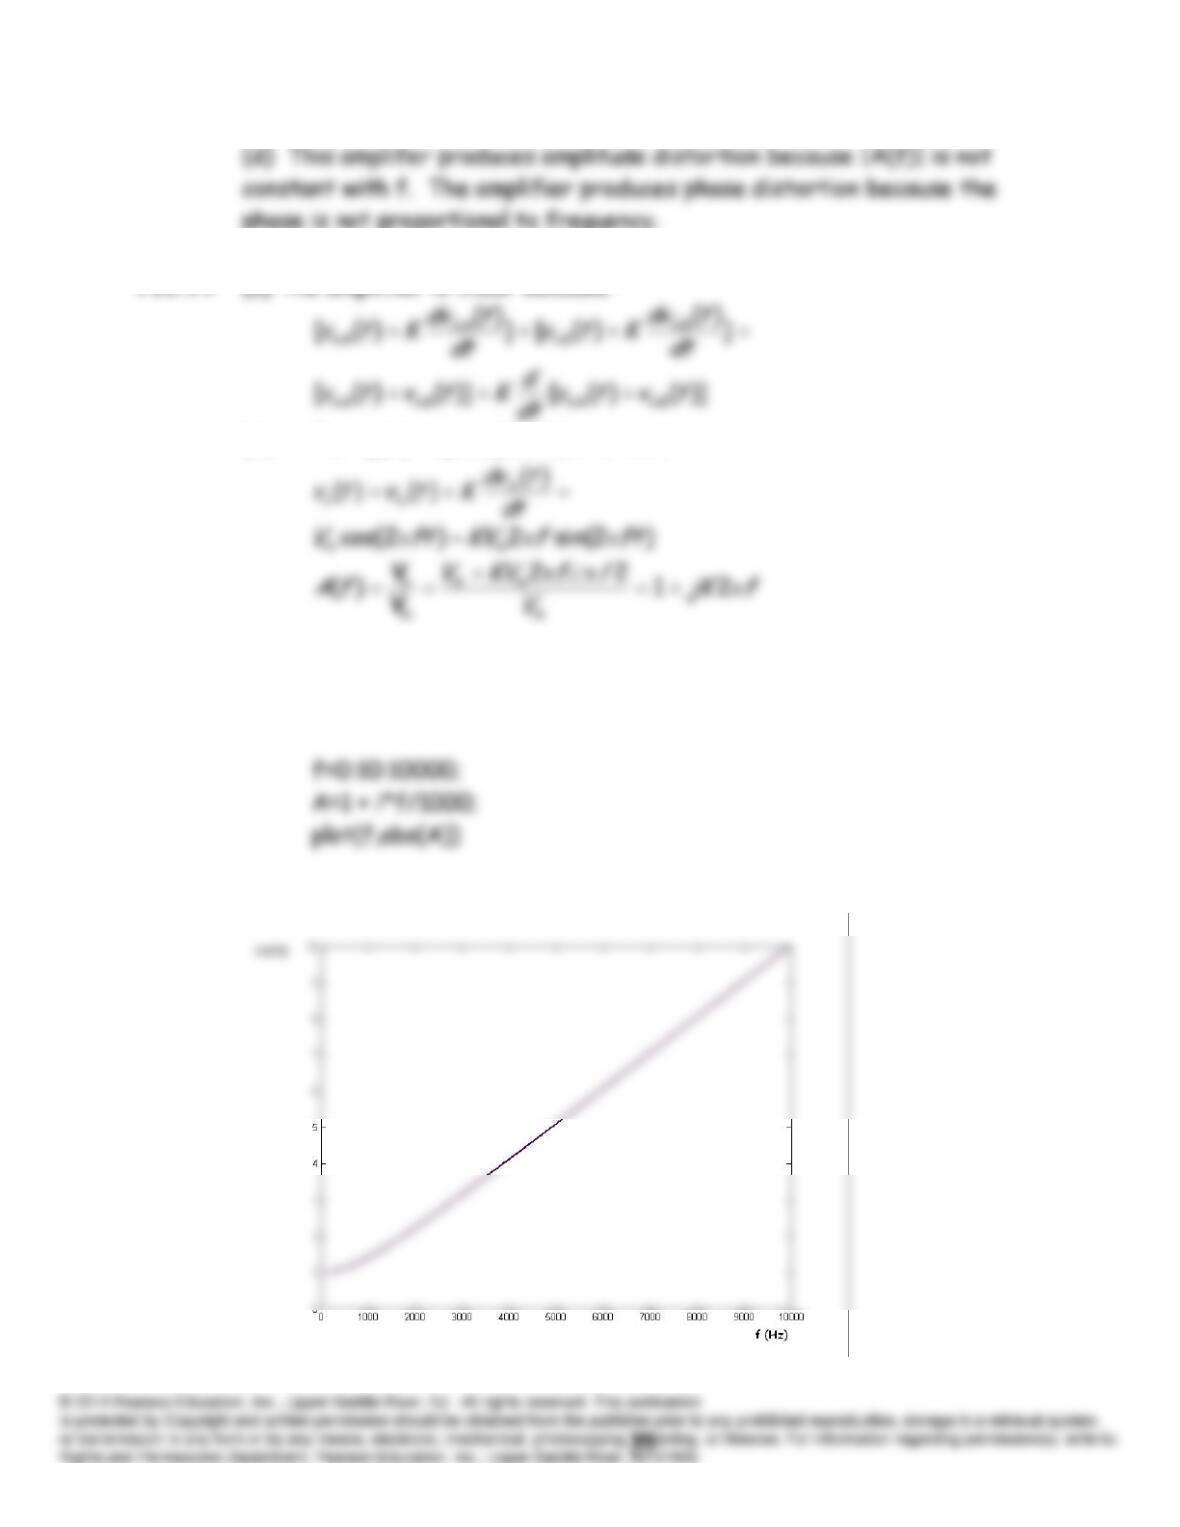
(c) In MATLAB, a plot of the magnitude can be obtained with the
commands:
The resulting magnitude plot is:
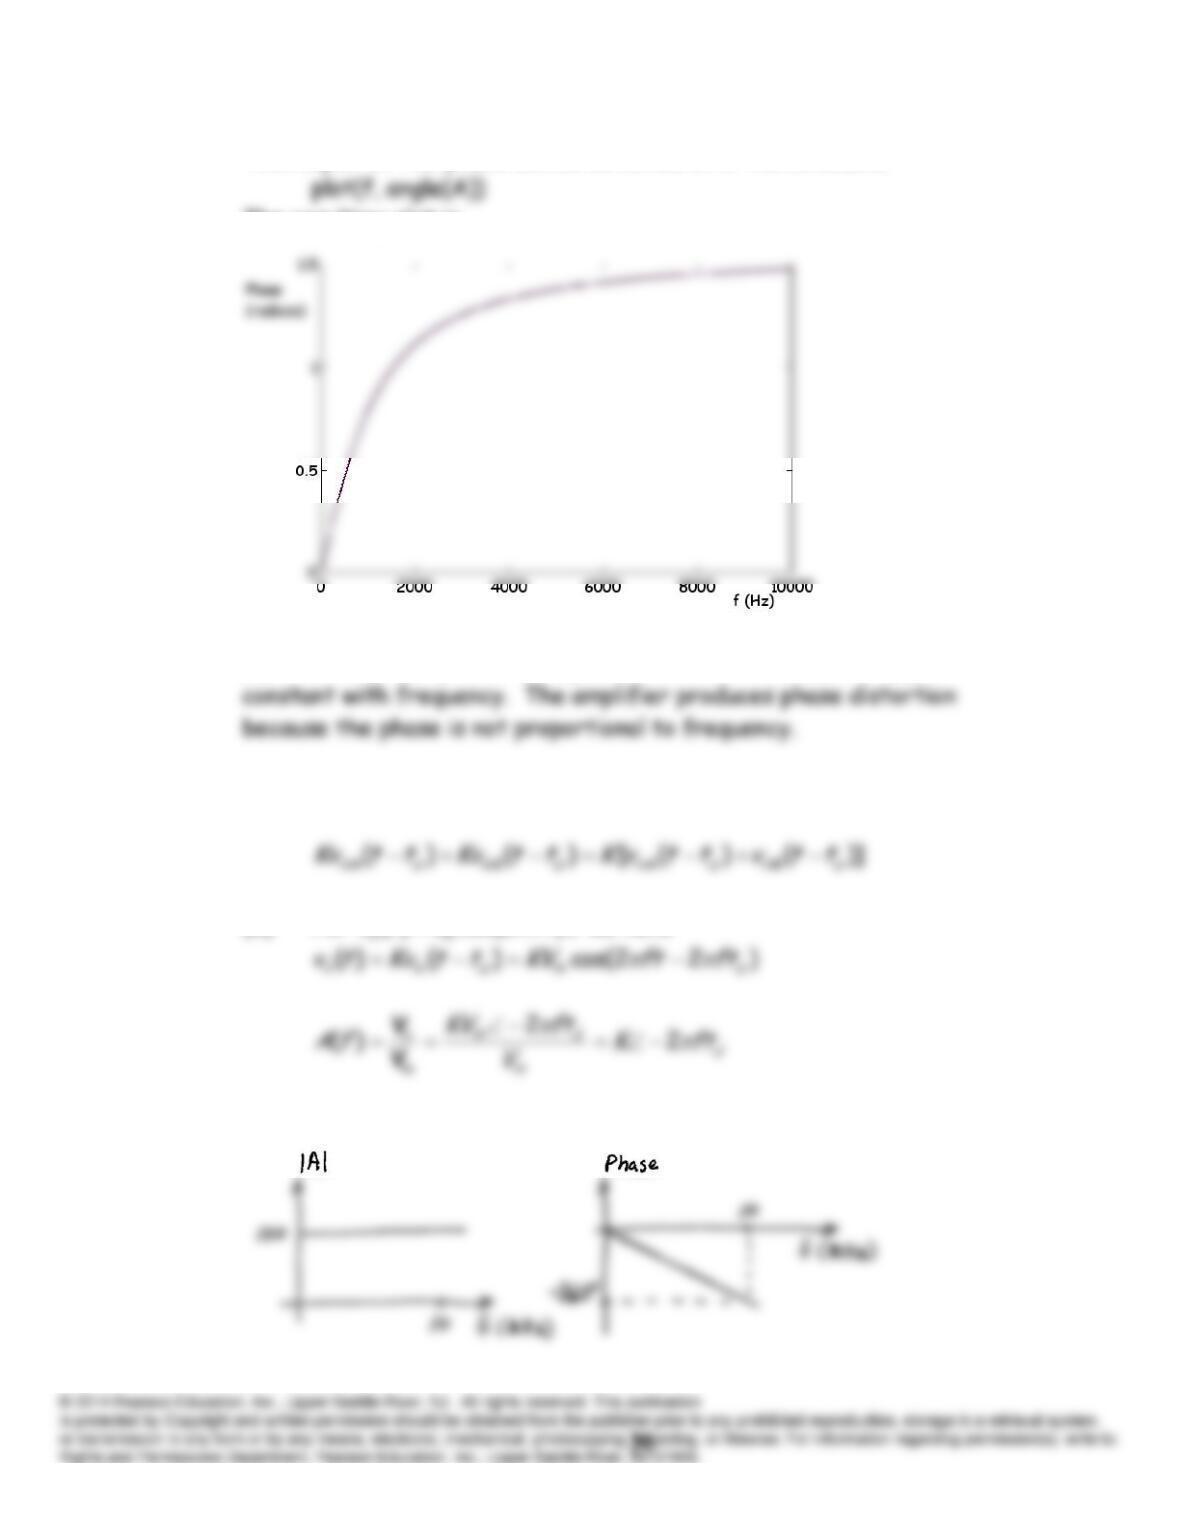
Then a plot of the phase can be obtained with the command:
The resulting plot is
(d) This amplifer produces amplitude distortion because |A(f)| is not
P11.78 (a) The amplifier is linear because
(b) For
)2cos()(
ftVtv m
, we have
(c) Plots of the magnitude and phase versus frequency are: