*It is suggested that this project not be assigned until after Section 1.5 or 1.6.
MATLAB PROJECTS
to accompany the text
LINEAR ALGEBRA AND ITS APPLICATIONS, 4th ed., David C. Lay
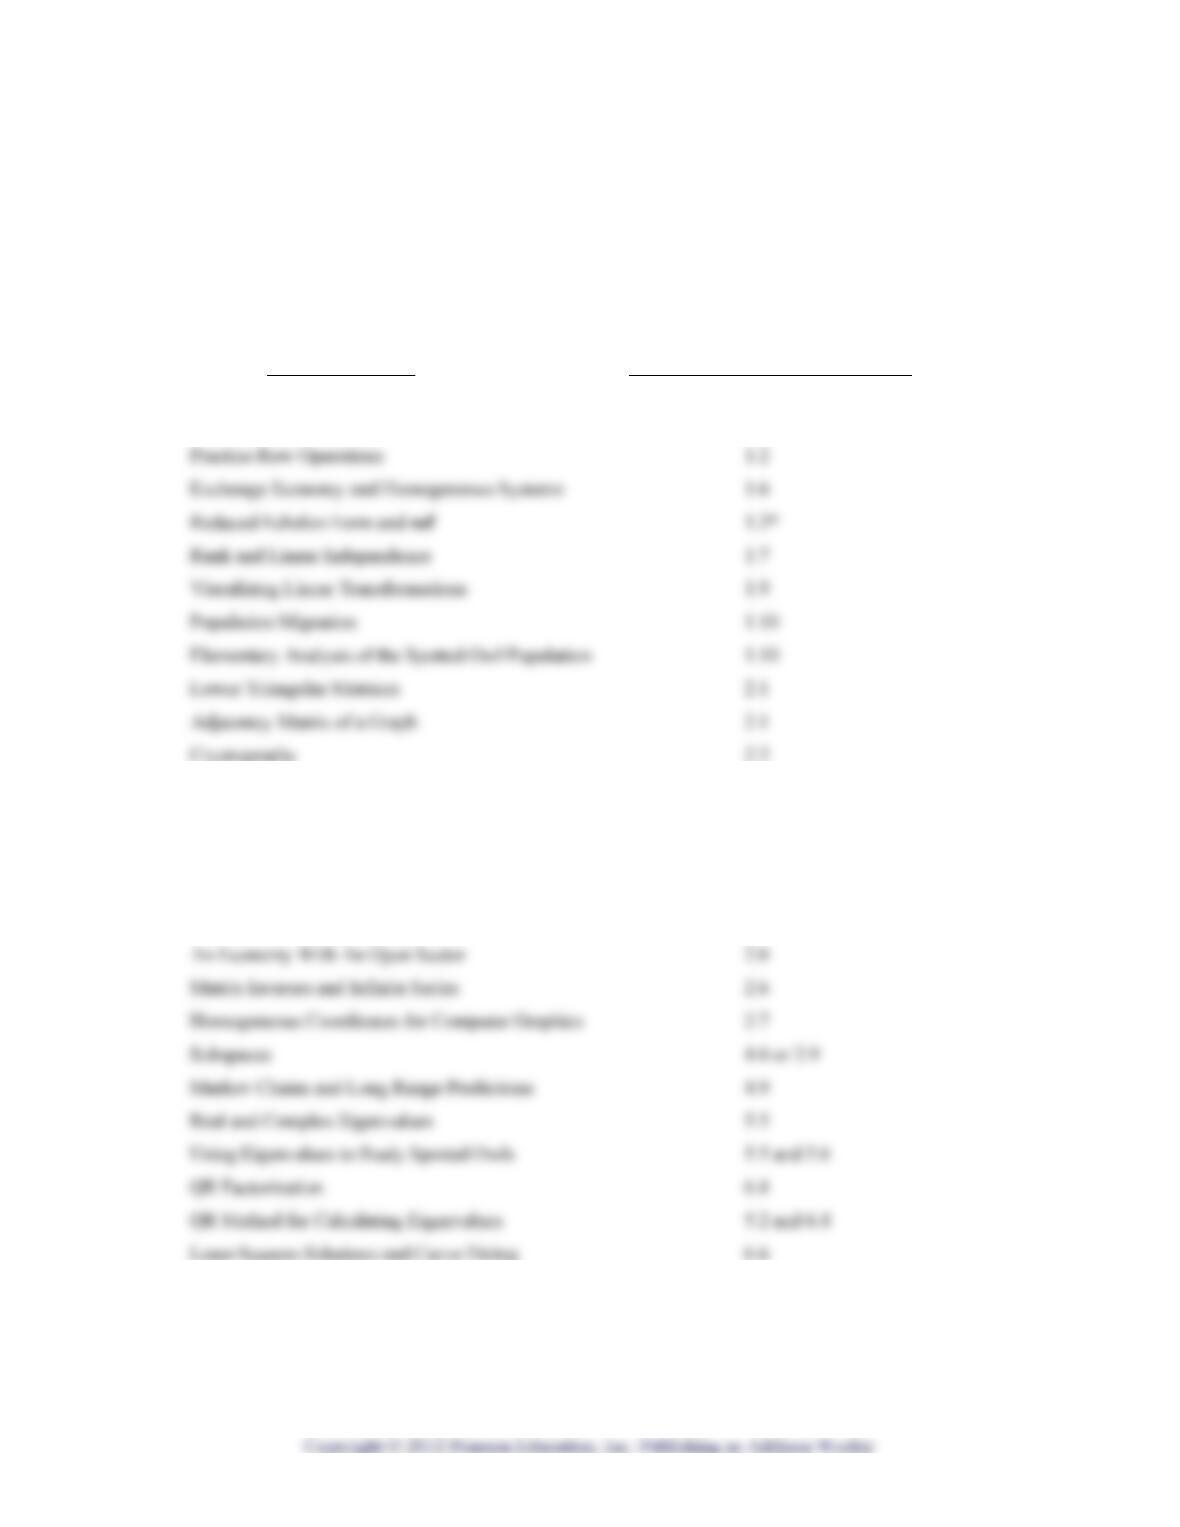
Title of Project Prerequisite Sections in Text
Getting Started With MATLAB None
Using Backslash to Solve Ax = b 2.3
Roundoff Error in Matrix Calculations 2.3
Partitioned Matrices 2.4
Schur Complements 2.4
LU Factorization 2.5
MATLAB Project: Getting Started with MATLAB Name_______________________________
Purpose: To learn to create matrices and use various MATLAB commands for reference later
MATLAB functions used: [ ] : ; + – * ^ , size, help, format, eye, zeros, ones, diag,
rand, round, cos, sin, plot, axis, grid, hold, path;
will write [Enter] to mean press that key, but we will omit this “carriage return” prompt later.) After
you execute each line, study the result to be sure it is what you expect, and take notes. After trying the
examples in each section, do the exercises.
If you do not complete this tutorial in one session, the variables you created will be erased when
you exit MATLAB. See the remark before Section 6 to find out how to get them back quickly the next
time you continue work on this project.
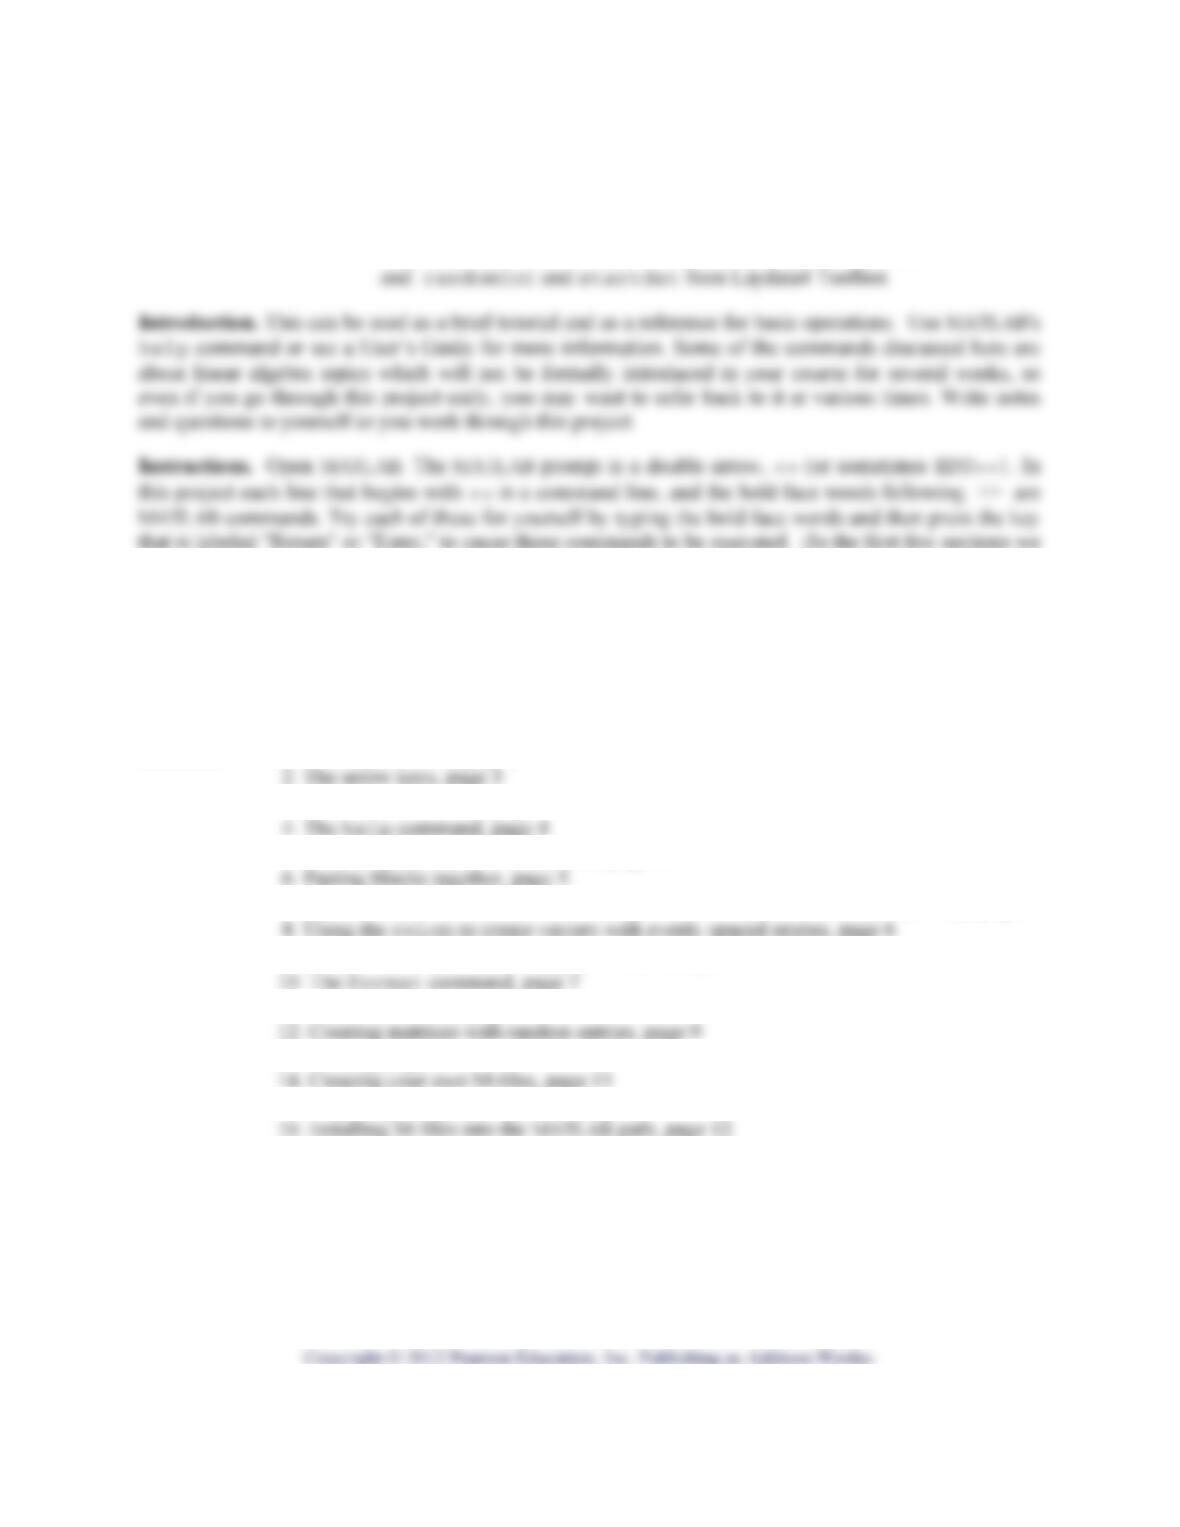
Sections: 1. Creating matrices, page 2
3. The size command, page 3
5. Accessing particular matrix entries, page 4
7. Special MATLAB functions for creating matrices: eye, zeros, ones, diag, page 5
9. Using the semicolon to suppress results, page 7
11. Matrix arithmetic, page 8
13. Plotting, page 10
15. Ways to get Laydata4 Toolbox, page 12
17. Other features of MATLAB, page 12
Page 2 of 12 MATLAB Project: Getting Started with MATLAB
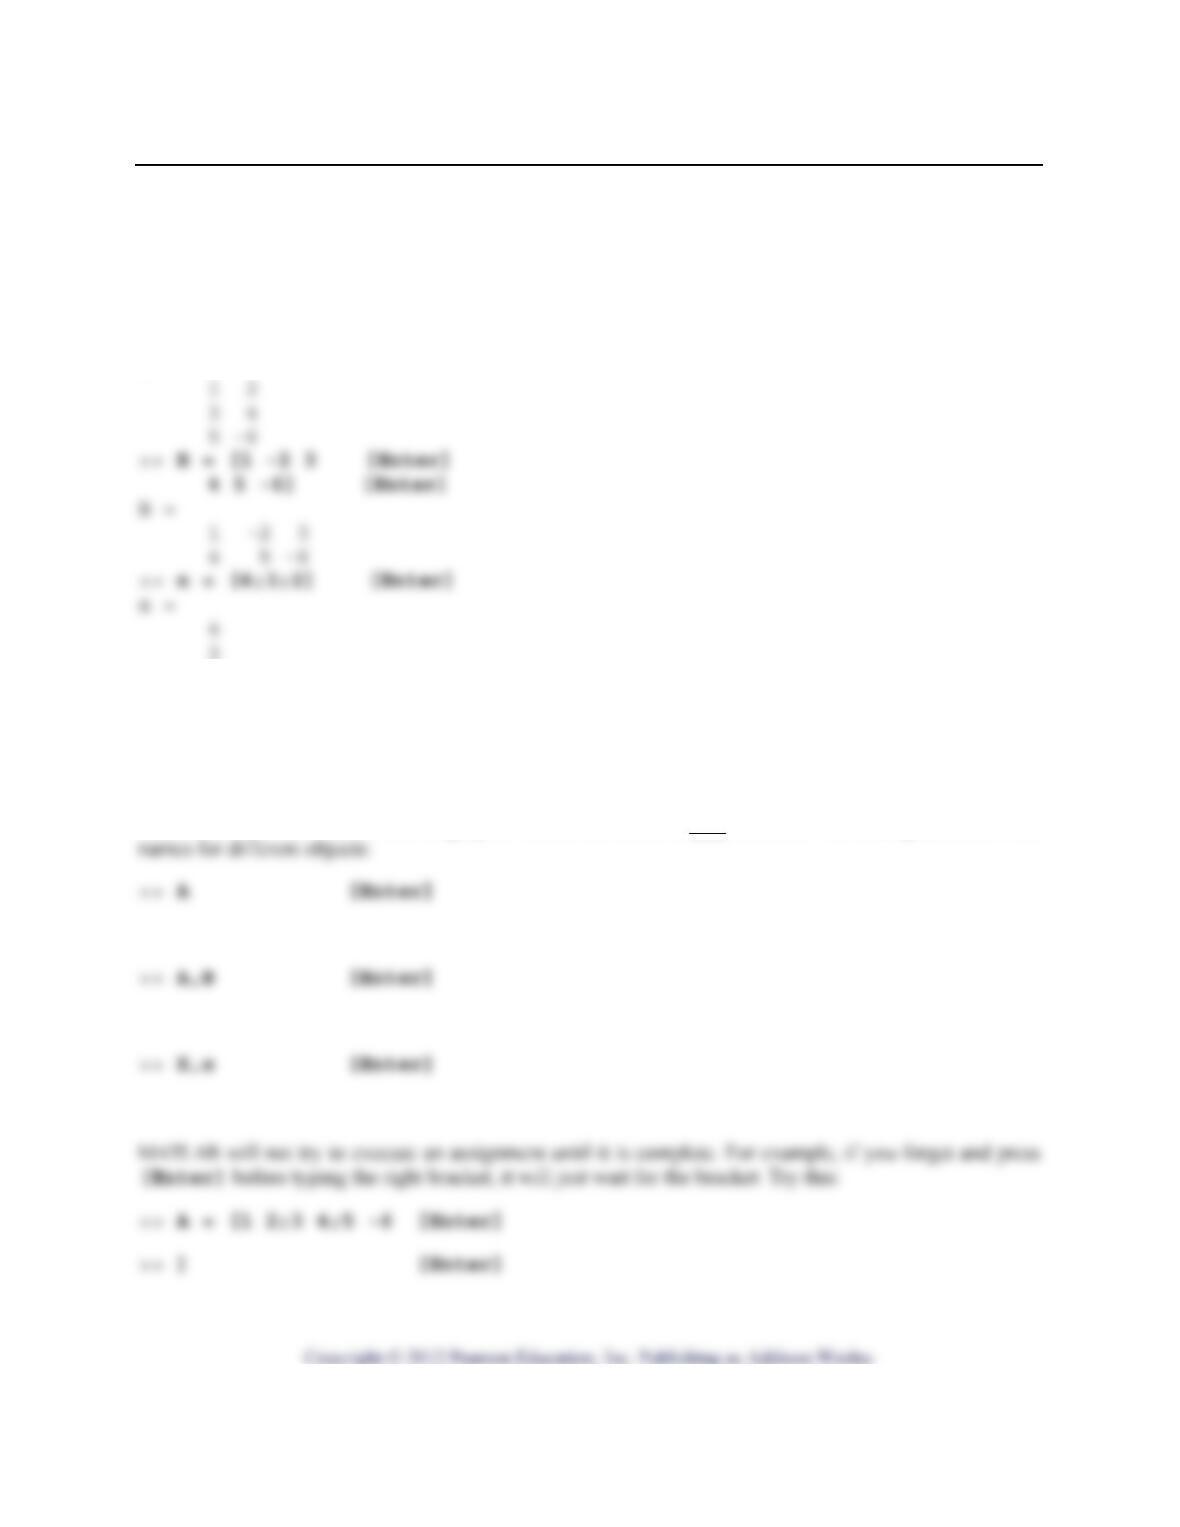
1. Creating matrices. A matrix is a rectangular array, and in linear algebra the entries will usually be
numbers. The most direct way to create a matrix is to type the numbers between square brackets, using a
space or comma to separate different entries. Use a semicolon or [Enter] to create row breaks.
Examples:
>> A = [1 2;3 4;5 -6] [Enter]
A =
2
>> X = [1,2,3] [Enter]
X =
1 2 3
a) To see a matrix you have created, type its name followed by [Enter]. Try each of the following and
make notes how the results were displayed. Notice MATLAB is case sensitive—for example, x and X are
Page 3 of 12 MATLAB Project: Getting Started with MATLAB
Exercise: If you have not done it already, create the matrices A, B, x, and X above. Then create C, D, E,
and vec as shown below. (We write them with square braces as a textbook would, but MATLAB does not
display braces.)
b) For each matrix, record what you typed, and be sure the MATLAB display is what you expected.
48 1
⎢
⎢
⎢
⎣
−−
⎡⎤
21
−
⎡⎤
21
−
⎡
⎤
3
⎡⎤
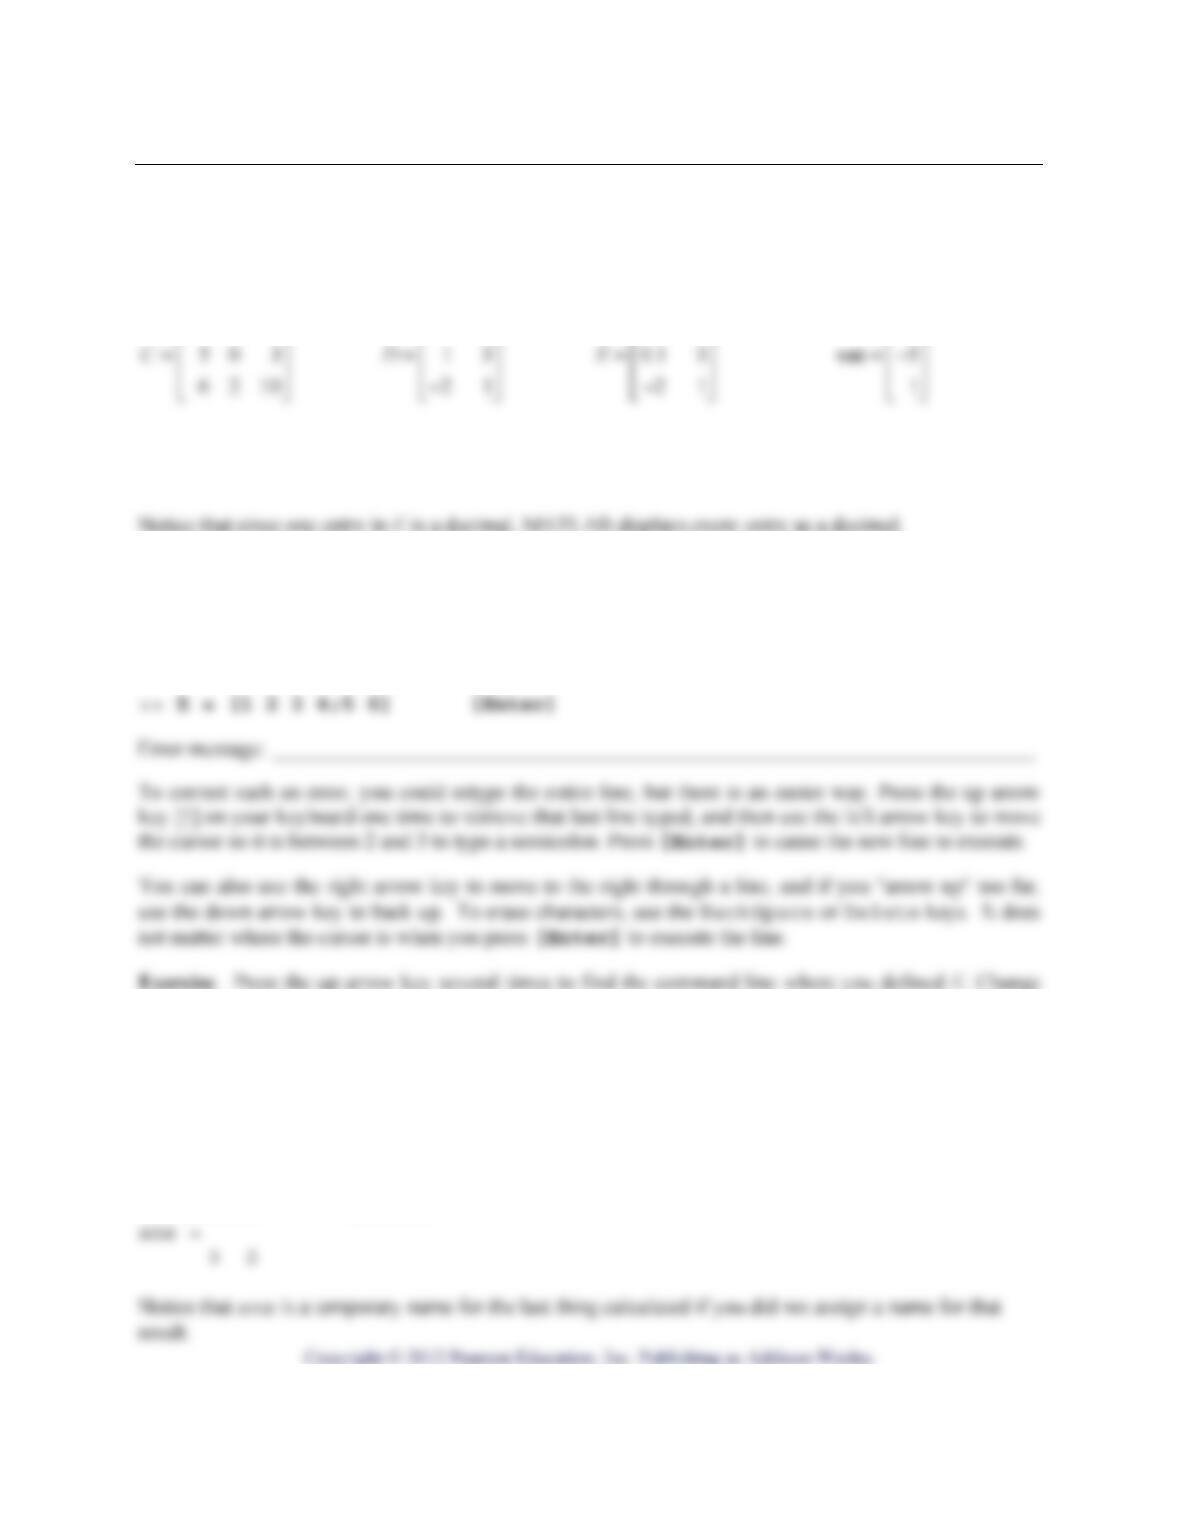
2. The arrow keys. MATLAB keeps about 30 of your most recent command lines in memory and you can
“arrow up” to retrieve a copy of any one of those. This can be useful when you want to correct a typing
error, or execute a certain command repeatedly.
a) Type the following line and record the error message:
the 0.1 entry to 0.01 and press [Enter] to execute.
b) Record the new version of E:
3. The size command. When M is a matrix, the command size(M)returns a vector with two entries
which are the number of rows and the number of columns in M.
>> size(A) [Enter]
Page 4 of 12 MATLAB Project: Getting Started with MATLAB
Exercise. Calculate the size of the other matrices you have created, B, X, x, C, D, E, vec, Z.
4. The help command. The command help can provide immediate assistance for any command
whose name you know. For example, type help size. Also try help help.
5. Accessing particular matrix entries. If you want to see a matrix which you have stored, type its
name. To correct entries in a stored matrix, you must reassign them with a command. That is, MATLAB
does not work like a text editor – you cannot edit things visible on the screen by highlighting and typing
over them.
However, you can change a particular entry, an entire row, an entire column, or even a block of entries.
6. Pasting blocks together. When the sizes allow it, you can create new matrices from ones that already
exist in your MATLAB workspace. Using the matrices B, C ,D created above, try typing each of the
following commands and record the result of each command in the space below it. If any error messages
appear, think why.
[C D] [D C] [C;B] [B;C] [B C]
7. Some special MATLAB functions for creating matrices: eye, zeros, ones, diag. Examples:
>> eye(3) >> zeros(3) >> ones(size(D))

Page 6 of 12 MATLAB Project: Getting Started with MATLAB
a) Type each of the following commands and record the result:
eye(4) zeros(3,5) zeros(3) ones(2,3) ones(2)
diag([4 5 6 7]) diag([4 5 6 7], -1) C,diag(C),diag(diag(C))
b) Type commands to create the following matrices. For each, record the command you used:
⎡
⎢
⎢
⎢
⎢
⎣
⎦
8. Using the colon to create vectors with evenly spaced entries. In linear algebra, a vector is an ordered
n-tuple. Thus, one-row and one-column matrices like those we called x, X and vec above would be called
vectors. Frequently it is useful to be able to create a vector with evenly spaced entries (for example, in
loops or to create data for plotting). This is easy to do with the colon. Examples:
>> v1 = 1:5 >> v2 = 1:0.5:3 >> v3 = 5:-1:-2
v1 = v2 = v3 =
1 2 3 4 5 1.0 1.5 2.0 2.5 3.0 5 4 3 2 1 0 -1 -2
a) Use the colon notation to create each of the following vectors. Record the command you used for each:
9. Using the semicolon to suppress results. When you place a semicolon at the end of a command, the
x =
1.0 1.2 1.4 1.6 1.8 2.0 2.2 2.4 2.6 2.8 3.0
10. The format command. This command controls how things look on the screen.
a) Type each of the following commands and record the result carefully. Notice that “e” means
exponent—it means multiply by some power of 10. For example, 1.2345e002 is the number 1.2345( 2
10 ).
>> R = 123.125
>> format long, R
>> format short e, R
>> format short, R
The default mode for display of numbers is format short. To restore the default mode at any time,
type format.
11. Matrix arithmetic. You will soon see the definitions of how to multiply a scalar times a matrix, and
how to add matrices of the same shape. MATLAB uses * and + for these operations. Try the following
examples, using matrices defined above. You should be able to figure out what the operations are doing.
a) Type each line and record the result. If you get an error message, read it carefully and notice why the
command did not work:
>> A, A+A, 2*A >> A, D, A+D, A-D
b) MATLAB also uses * for multiplication of matrices, which is a somewhat more complicated operation.
You will see the definition in Section 2.1 of Lay’s text. The definition requires that the “inner dimensions”
of the two matrices agree. Without knowing that definition, you can still investigate some of the
properties of matrix multiplication (and you may even be able to figure out what the definition is). Type
the following lines and record the result of each:
>> A, B >> A*B
Page 9 of 12 MATLAB Project: Getting Started with MATLAB
c) The symbol ^ means exponent in MATLAB. For example, Y^2 is a way to calculate 2
Y(which can also
be calculated as Y*Y of course). Try these:
>> C, C*C, C^2 >> Y = 2*eye(3), Y^2, Y^3
12. Creating matrices with random entries. MATLAB‘s function rand creates numbers between 0 and
1 which look very random. They are not truly random because there is a formula which generates them,
but they are very close to being truly random. Such numbers are often called “pseudorandom.” Similarly,
the function randomint in Laydata4 Toolbox creates matrices with pseudorandom integer entries
between -9 and 9.
a) Type the commands below and describe the result of each. Arrow up to execute the first two lines
several times, to see that the numbers change each time rand or randomint is called.
>> P = rand(2), Q = rand(2,3) >> format long, P, Q
Remarks. You can scale and shift to get random entries from some interval other than (0,1). For example,
6*rand(2)yields a 22×matrix with entries between 0 and 6; and -3+6*rand(2) yields a 22×
matrix with entries between -3 and 3. It is also easy to create random integer matrices without
randomint. For example, the command round(-4.5 + 9*rand(2))produces a 2×2 matrix with
every entry chosen fairly randomly from the set of integers { 5, 4, ,4,5}−−….
13. Plotting. The plot command does 2-D plotting, and when you use it, a graph will appear in a
Figure window. If the Figure window obscures most of the Command window and you want to see
both windows at once, use the mouse to resize and move them. If you cannot see a particular window at
all, pull down the menu Windows and select the one you want.
a) You can specify a color and a symbol or line type when you use plot. To learn more, use help
plot and the MATLAB boxes in Lay’s Study Guide. Try the following examples and make a sketch or
write notes to describe what happened each time. Notice we use semicolons when creating the vectors
here because each vector is quite long, and there is no reason to look at them:
>> x = 0:0.1:2*pi; si = sin(x); co = cos(x);
>> plot(x,si)
>> plot(x,si,’r’)
b) Here is one way to get more than one graph on the same axis system. Describe the result of each
command:
>> plot(x,si,’r*’,x,co,’b+’)
c) Another way to get different graphs on the same axes is to use the hold on command. This causes
the current graphics screen to be frozen so the next plot command draws on the same axis system. The
Page 11 of 12 MATLAB Project: Getting Started with MATLAB
d) It can be helpful to have grid lines displayed and to set your own limits for the axes. Try the following.
>> plot(x, si), grid
>> plot(x, si), axis([ -8 8 -2 2 ])
14. Creating your own M-files. An M-file allows you to place MATLAB commands in a text file so that
you do not need to reenter the same information at the MATLAB prompt again and again. It is a good idea
to have MATLAB running while you edit an M-file. This will allow you to quickly switch back and forth
between the Edit screen and the MATLAB screen so you can try running your file, editing it again,
running it again, until it works the way you want.
To use the M-File Editor inside MATLAB, click File on the upper left corner of the MATLAB
screen. Choose New|M-File if you want to create a new M-file. If you want to edit one that exists
already, choose Open and then browse to find the file you want. The M-File Editor/Debugger will open
for you to edit your work. You can also edit an M-file using another text editor but you should realize that
an M-file must be saved with the extension .m, not .txt or .docx whereas the .m extension will be
added automatically if you use the M-File Editor. Type the commands you want in the Edit window and
save your work.
Page 12 of 12 MATLAB Project: Getting Started with MATLAB
15. Ways to get Laydata4 Toolbox. The M-files in Laydata4 Toolbox can be downloaded from the
text’s web site http://pearsonhighered.com/lay . Follow the on-screen directions. Refer to
the README file for information on downloading and decompressing the files.
16. Installing M-files into the MATLAB path. Whenever you want to use M-files that are not part of
commercial MATLAB, such as those in Laydata4 Toolbox, you must tell MATLAB where to look for
them. For example, suppose the Laydata4 M-files are stored on your C: drive, in a folder called
laydata4. The following procedures will work for installing any M-files, except the names of the
folders may be different.
A. For Macintosh: Drag the icon for the laydata4 folder into the MATLAB folder on your hard drive.
Start MATLAB. From the File menu, select Open. Select one of the M-files in the laydata4 folder
(to open the file as if for editing), then close the file. You are done now – after this, MATLAB will
always know to look in that laydata4 folder.
B. For Windows: Open your Explore window and drag the folder called laydata4 into your
MATLAB folder. Its address is now something like c:\matlab\laydata4 . The MATLAB command
path outputs a long string that contains the addresses of all the folders where MATLAB looks for M-
17. Other Features of MATLAB. We have only scratched the surface of the many features MATLAB
provides. For example, some versions of MATLAB have a notebook feature. If available, type nb=mupad
to begin your exploration.
MATLAB Project: Practice Row Operations Name_______________________________
Purpose: To practice calculating the reduced echelon form with individual row operations
Prerequisite: Section 1.2
MATLAB functions used: – , / ; and replace, swap, and scale from Laydata4 Toolbox
Background: Read about elementary row operations and reduced echelon form in Section 1.2.
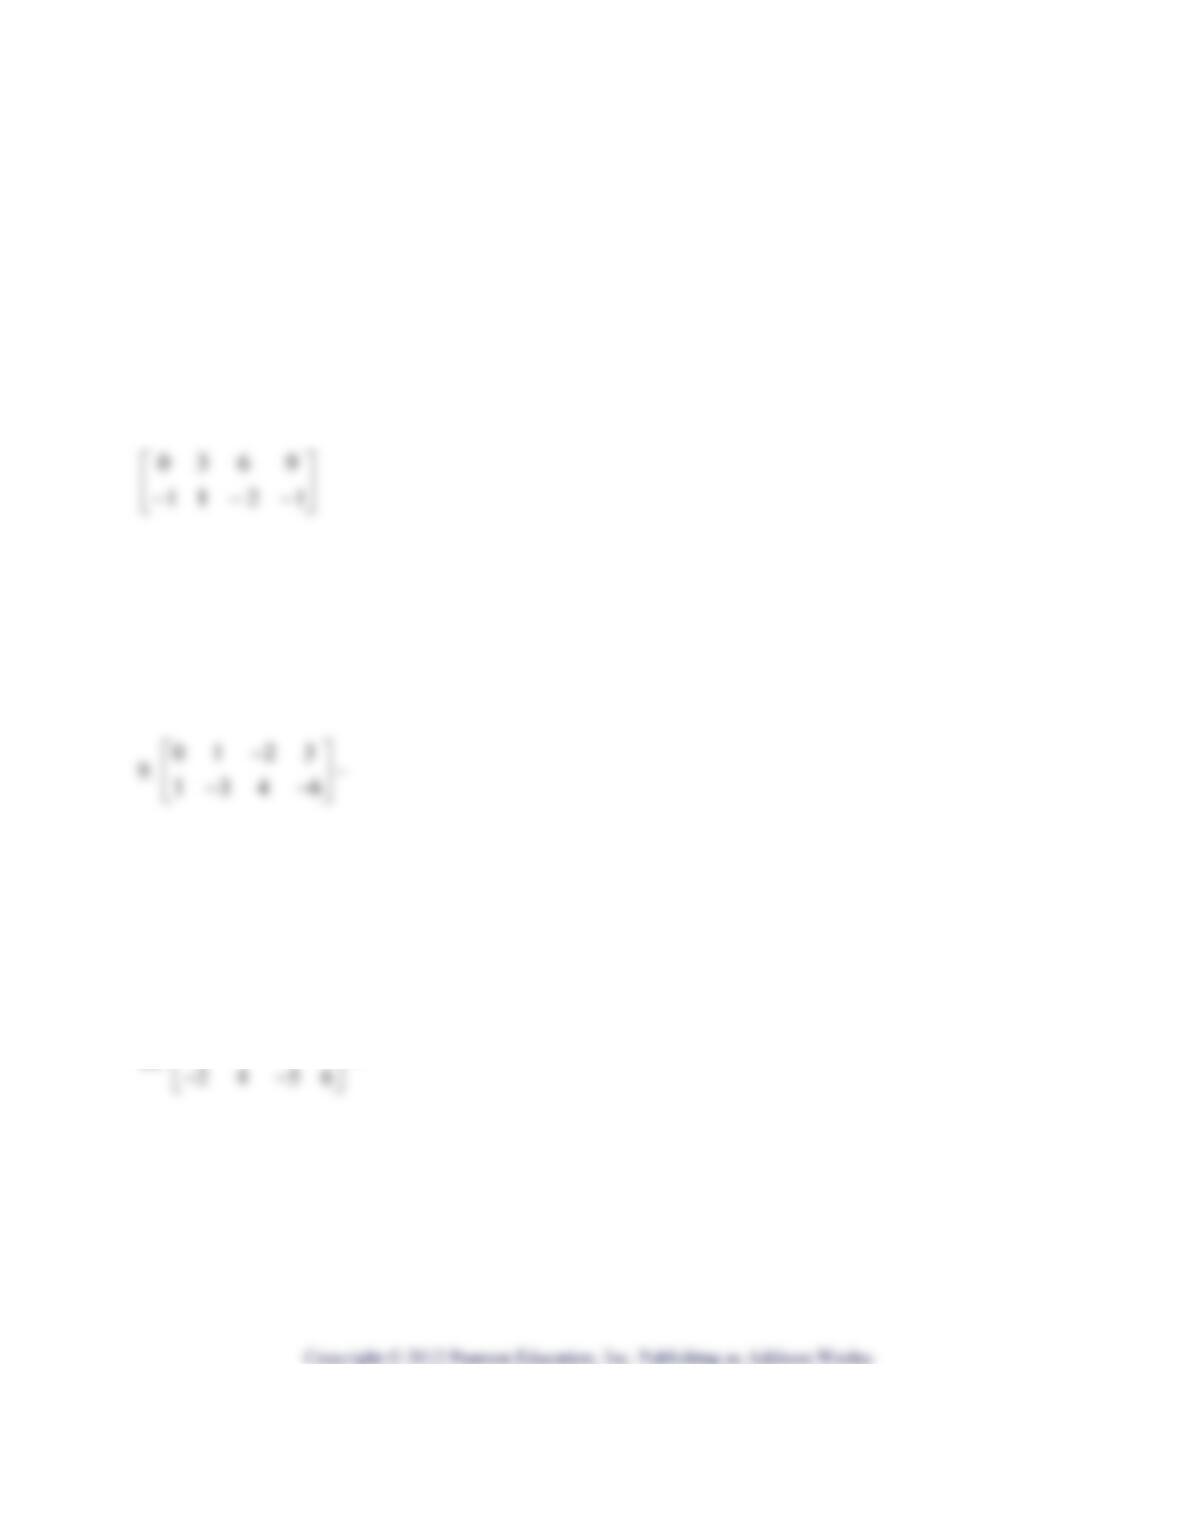
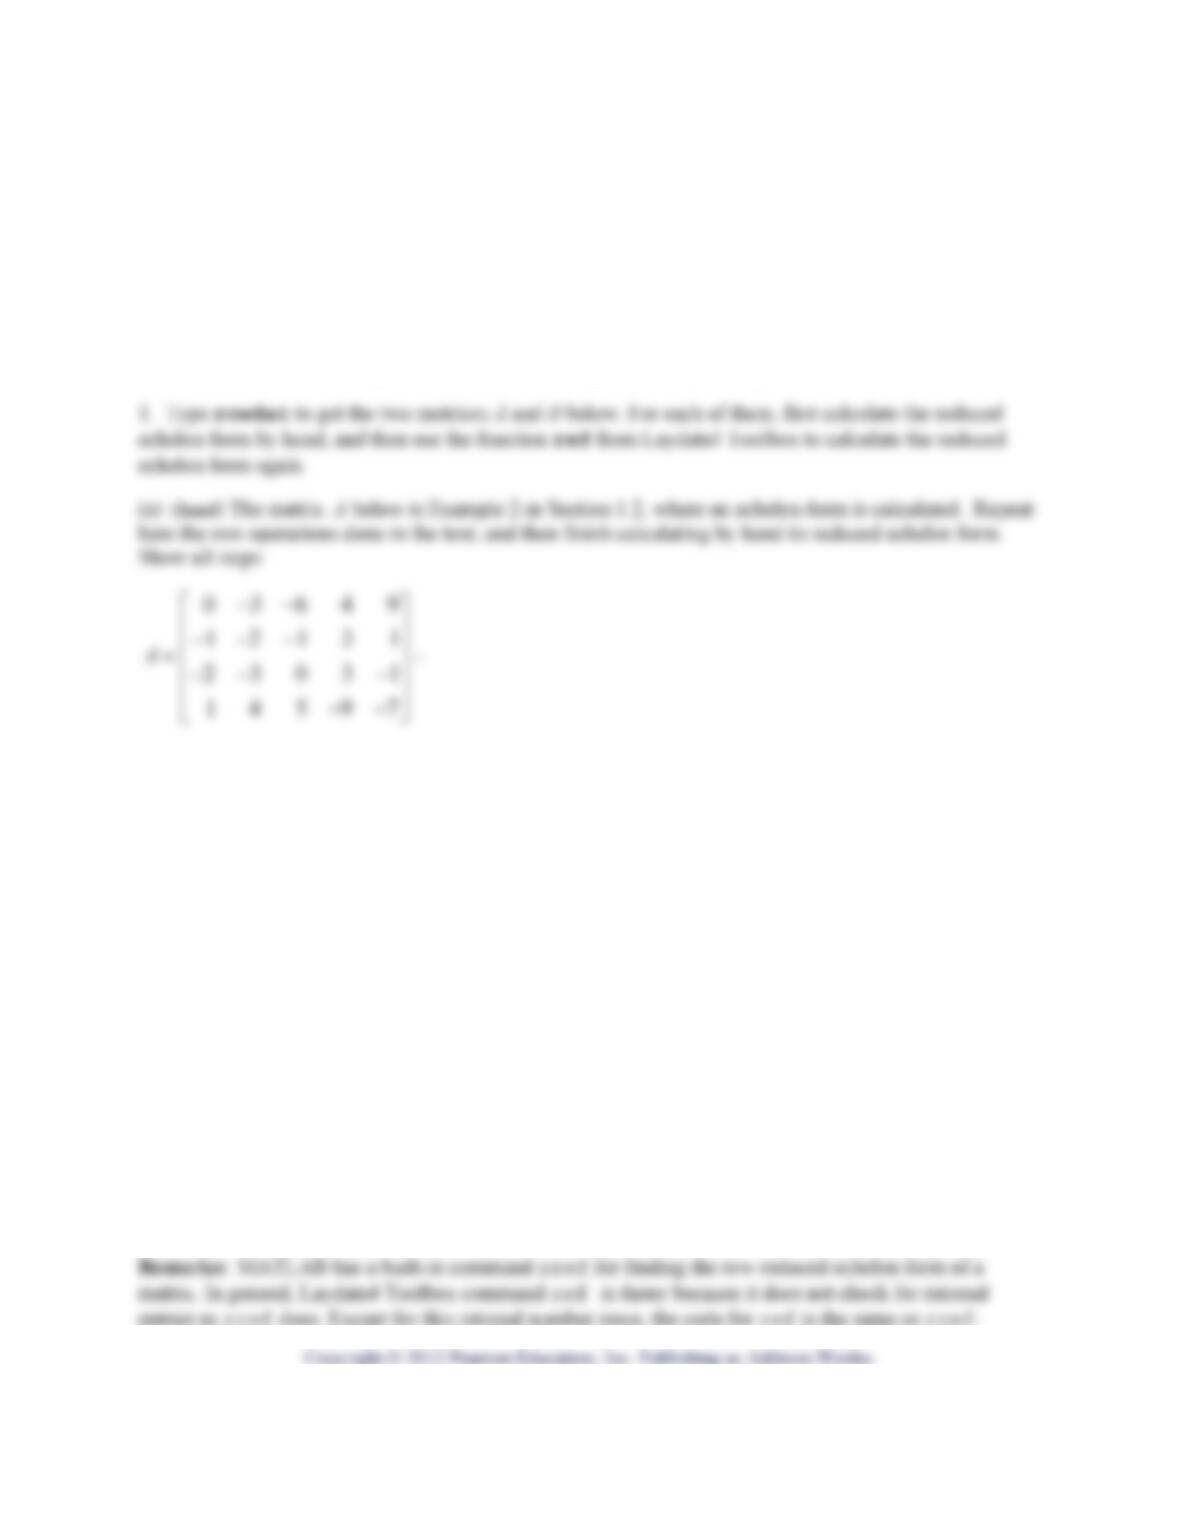
1. (hand) For each matrix, calculate its reduced echelon form by hand. The last three matrices are
exercises 9, 10, and 11 from Section 1.2, and it will be beneficial to you to keep a record of what was
done in each step. Again, be sure to reduce all the way to reduced echelon form and to show each step:
10. 1214
−−
⎡⎤
~
Page 2 of 3 MATLAB Project: Practice Row Operations
11.
3240
96120
6480
−
⎡⎤
⎢⎥
−
⎢⎥
⎢⎥
−
⎣⎦
~
(MATLAB) We can use the MATLAB functions swap, replace and scale to do the same row
operations on the same matrices as in question 1. One possible solution for the first matrix is shown to
illustrate how the functions work. Try the example: type each command line shown, press [Enter], and
verify the result. The first line enters the matrix and the second line makes a copy of it. It’s a good idea
to work on a copy so if you decide to start over, the original matrix is still in your workspace.
M=[0 3 6 9; -1 1 –2 -1] 1211
9630
−−−
A = M 1211
9630
−−−
2. Now you use these functions to reduce the matrices in exercises 9, 10 and 11. To get the matrices from
Laydata4 Toolbox, type the commands in bold below and press [Enter] after each line. By the way, you
can find the MATLAB data for most problems in the text using this method.
c1s2 (Chapter 1, section 2)
As you reduce each matrix using MATLAB, record each line you type and the resulting matrix. If
necessary, attach an extra sheet or use the back. To save your work to a computer file, use MATLAB’s
diary command. For more information regarding the diary command, see the MATLAB appendix in
Lay’s study guide.
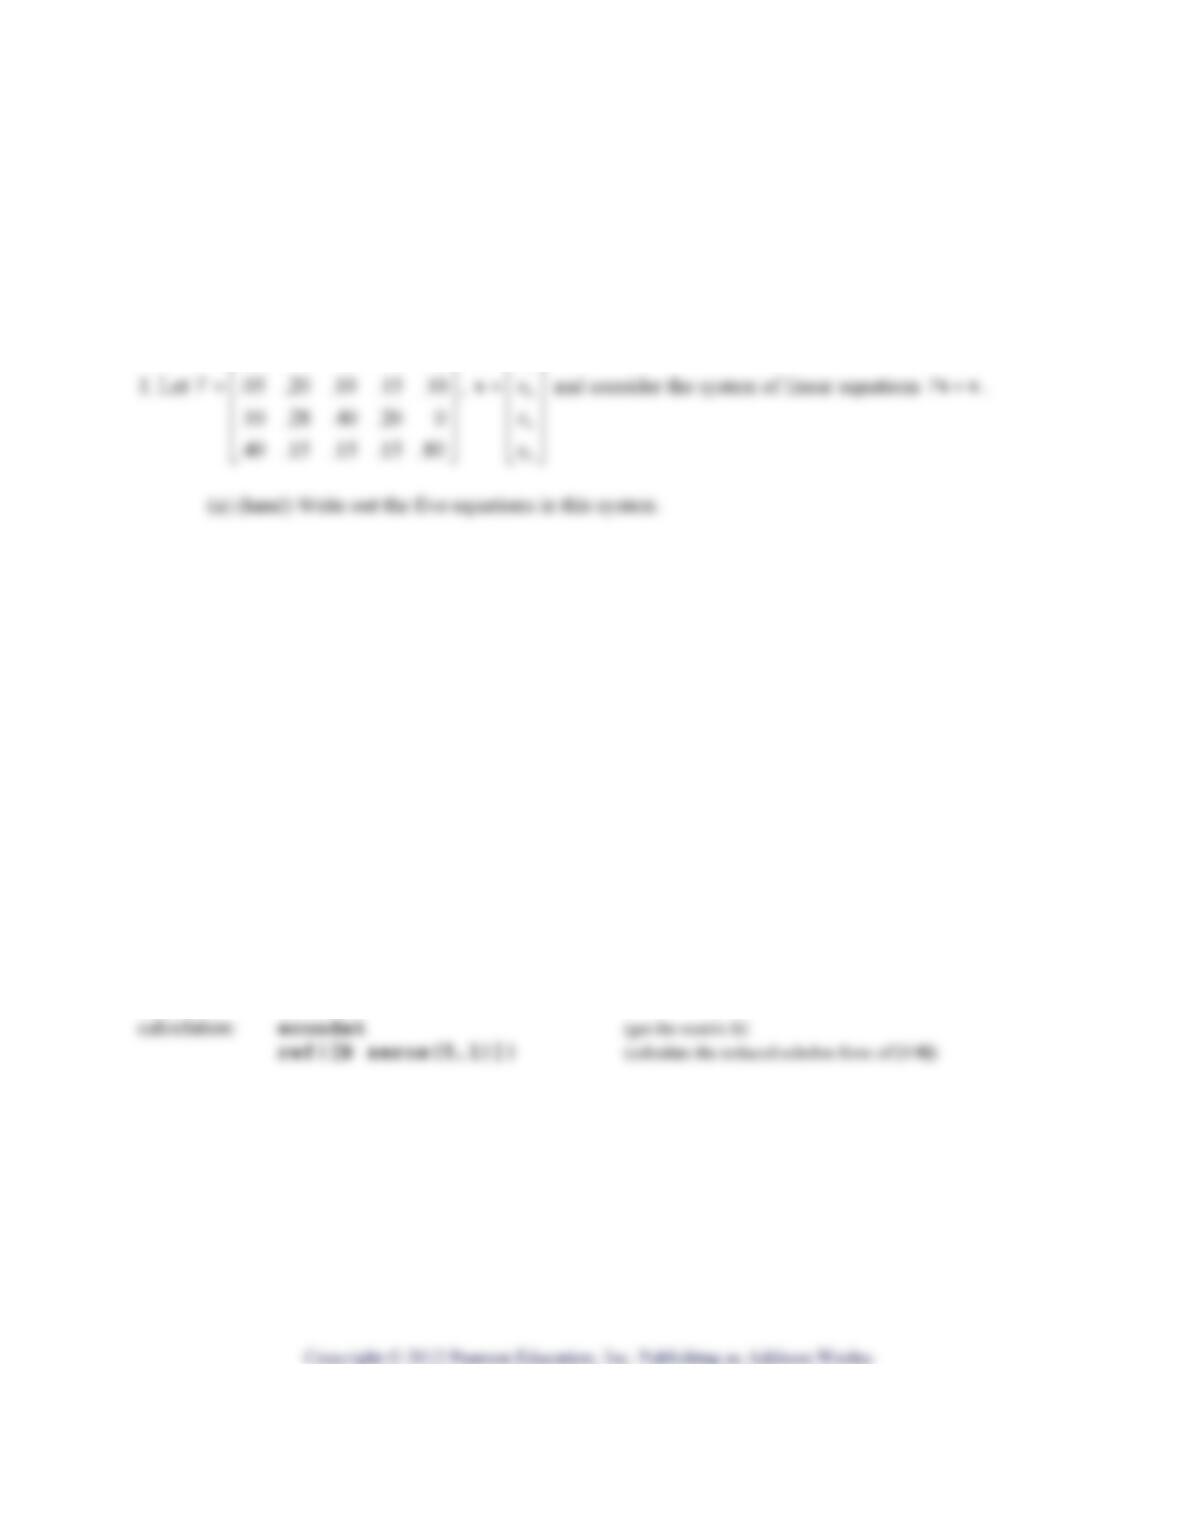
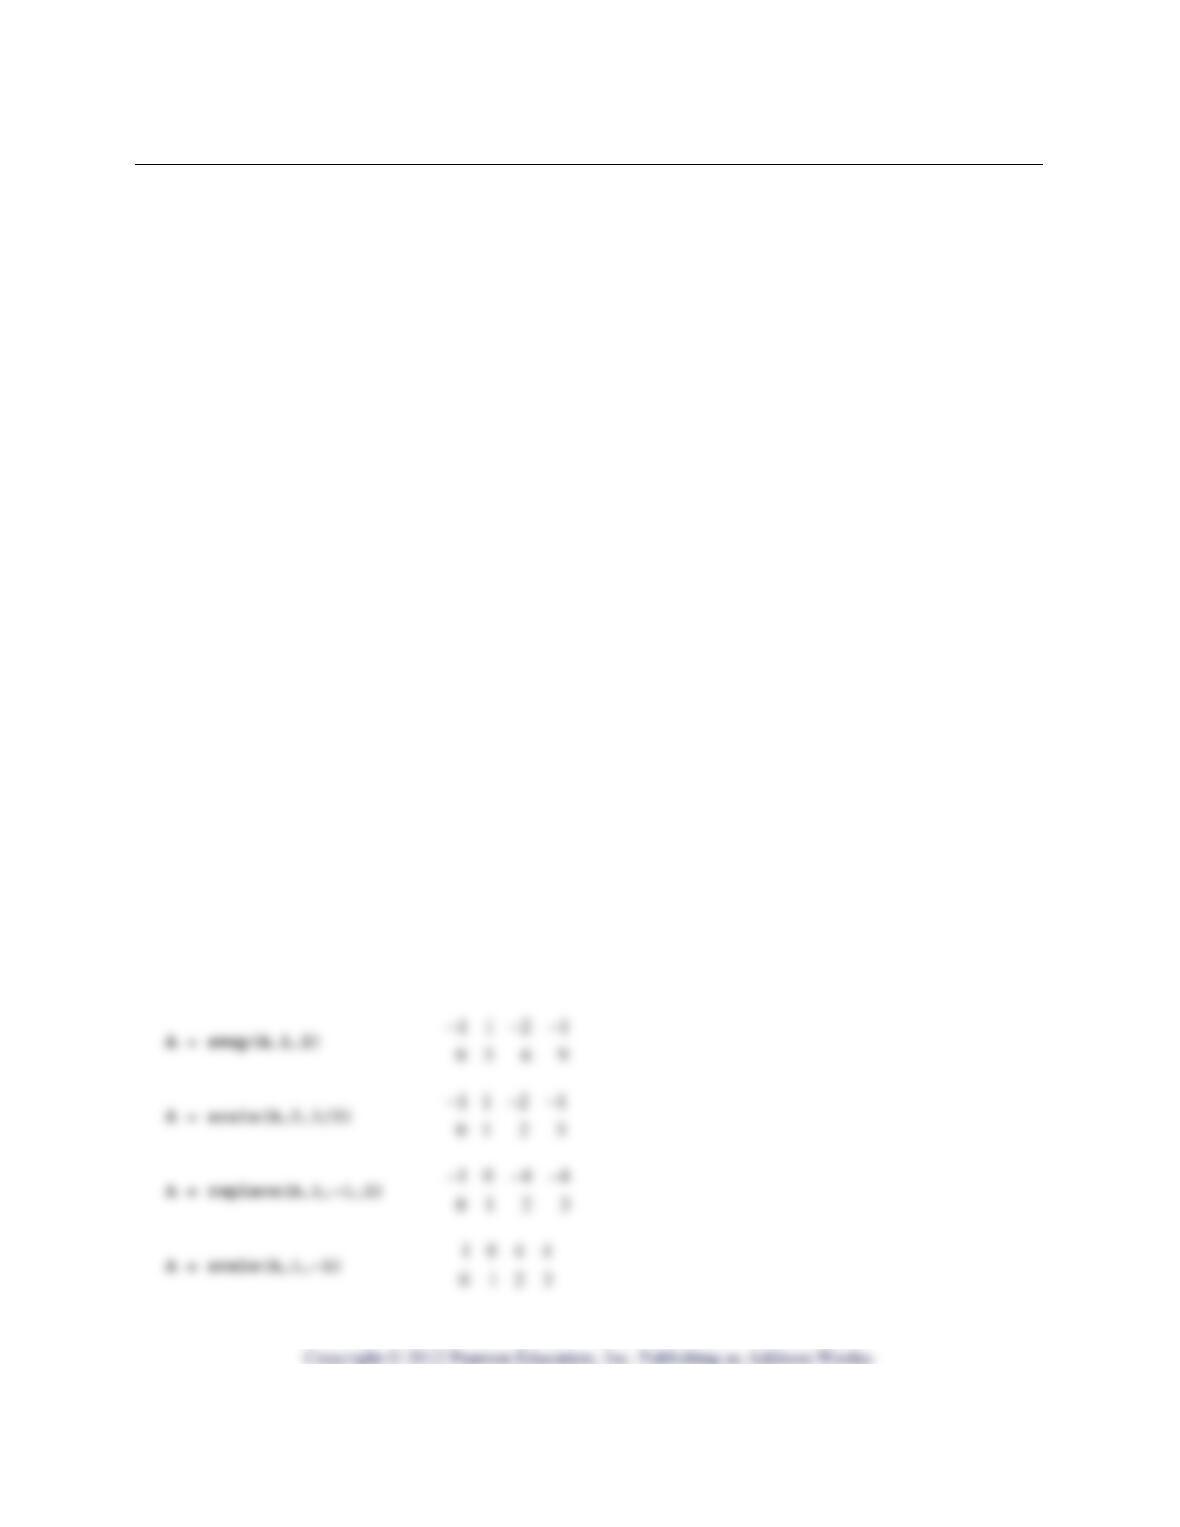
MATLAB Project: Exchange Economy and Homogeneous Systems Name_________________
Purpose: To solve a homogeneous system to find equilibrium prices for an exchange model
economy.
Prerequisite: Section 1.2
MATLAB functions used: –, /, eye, sum; and econdat and ref from Laydata4 Toolbox
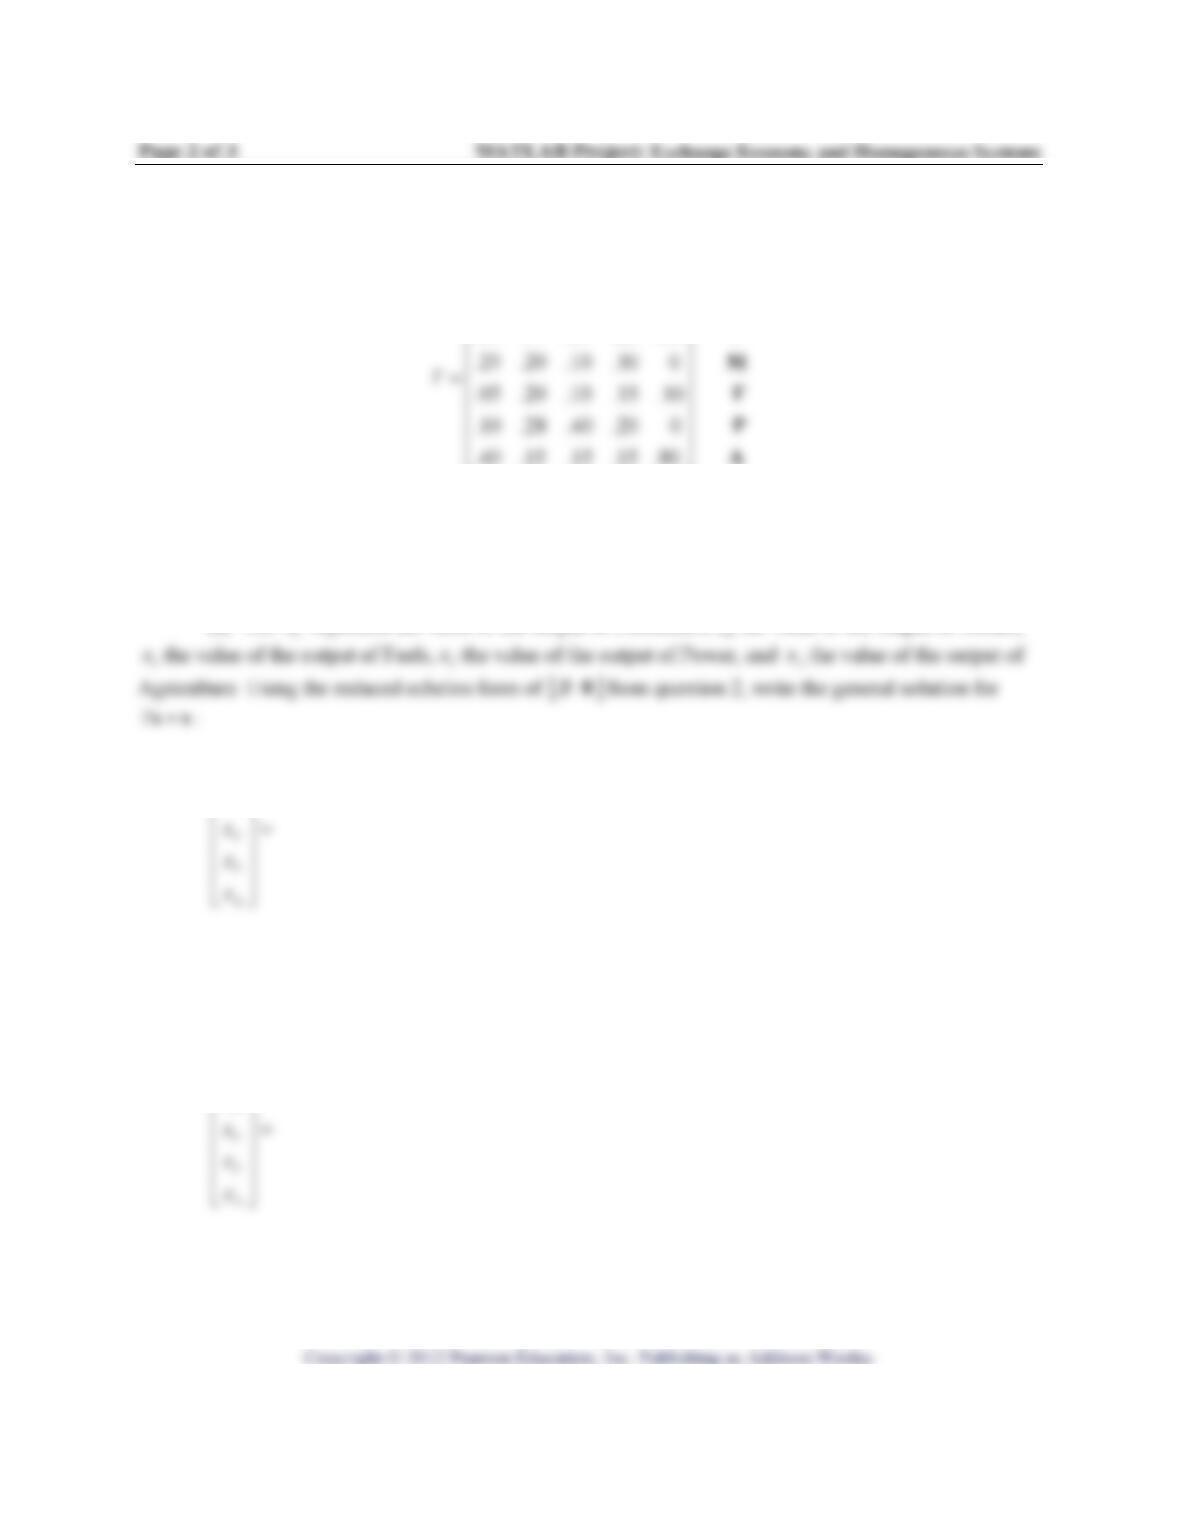
x
x
x
⎢
⎢
⎢
⎢
⎣
.20 .17 .25 .20 .10
.25 .20 .10 .30 0
⎡⎤
⎢⎥
1
2
x
x
⎡
⎤
⎢
⎥
⎢
⎥
(b) Collect terms in your equations to get a homogenous linear system, and write out the five new
equations.
2. (MATLAB) Let Bx = 0 denote the homogenous system you obtained in 1(b), and calculate the reduced
echelon form of
[
]
B0. Record the reduced form below. These lines will get the matrix and do the
3. (hand) First read about Leontief Economic Models in Section 1.6 of the text. Now consider an exchange
model economy which has five sectors, Chemicals, Metals, Fuels, Power and Agriculture. Assume the
matrix T in question 1 above gives an exchange table for this economy as follows:
.20 .17 .25 .20 .10
⎡⎤
⎣⎦
CMFPA
C
Notice that each column of Tsums to one, indicating that all output of each sector is distributed among
the five sectors, as should be the case in an exchange economy. The system of equations T=xx
must be
satisfied for the economy to be in equilibrium. As you saw above, this is equivalent to the system .B=x0
(a) Let C
x
represent the value of the output of Chemicals,
x
x
x
x
the value of the output of Metals,
C
M
x
x
⎡⎤
⎢⎥
⎢⎥
(b) Suppose the economy described above is in equilibrium and 100
A
x= million dollars. Calculate the
values of the outputs of the other sectors and record this particular solution for the system T=xx
:
C
M
x
x
⎡⎤
⎢⎥
4. (hand) Consider the matrices Tand
B
created above. As already observed, each column of T sums to
one. Consider how you obtained
B
from T and explain why each column of
B
must sum to zero.
B
B
B
MATLAB Project: Reduced Echelon Form and ref Name_______________________________
Purpose: To calculate the reduced echelon form by hand and with ref, and to see some effects of
roundoff error.
Prerequisite: Section 1.2
MATLAB functions used: – , / ; and replace, swap, and scale from Laydata4 Toolbox
Background: Read about elementary row operations and reduced echelon form in Section 1.2. To learn
about the functions from Laydata4 Toolbox, use help or see Lay’s Study Guide.
(b) (MATLAB) Type format rat and then ref(A). Is the output identical to what you obtained
above? ____________ (If not, redo hand calculations.)