Part 4/Unit I 427
2008, draws graph showing impact of an effective price ceiling on price and quantity
Sample Multiple-Choice Questions for Macro Unit I
1. The central economic problem faced by all economies of the world is
(A) balancing the budget of the government.
(B) avoiding periods of inflation while maintaining high employment.
(C) regulating big business and big labor.
(D) unlimited wants with limited resources.
(E) balancing the goals of economic growth and environmental protection.
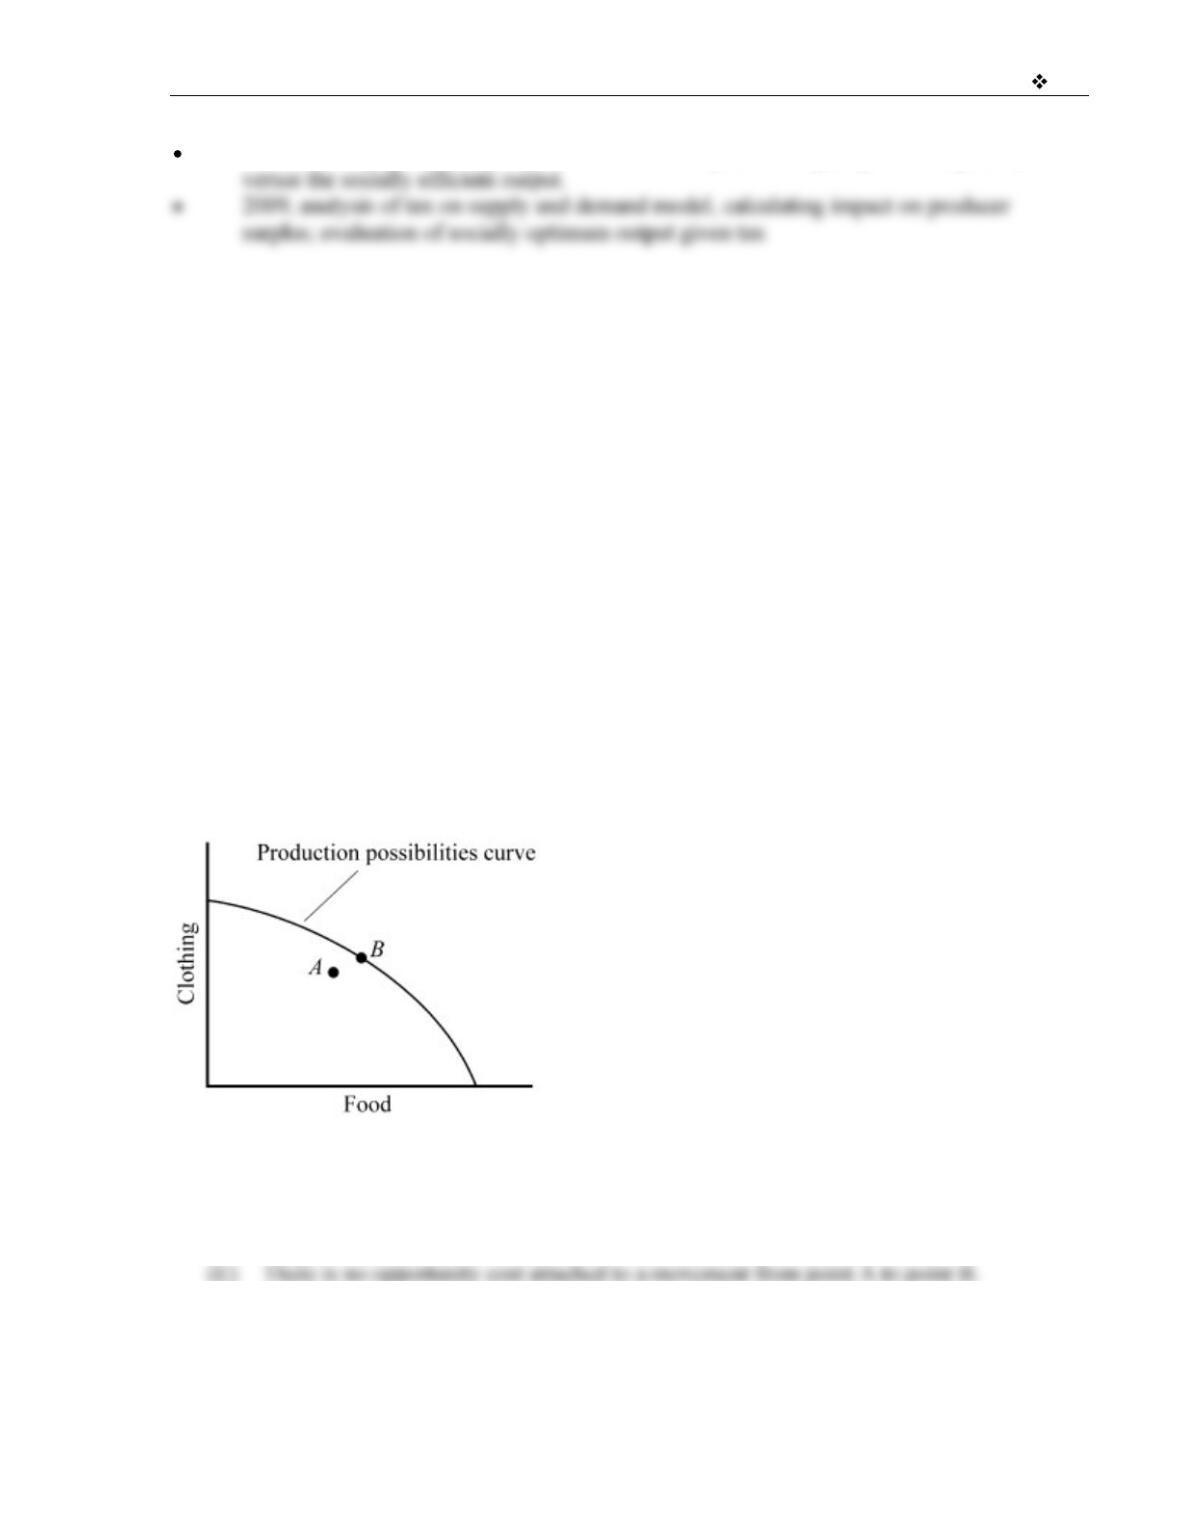
2. The graph in Figure 1 demonstrates
(A) increasing opportunity cost.
(B) constant opportunity cost.
(C) decreasing opportunity cost.
(D) the law of comparative advantage.
(E) the law of absolute advantage.
Figure 1
3. The opportunity cost of moving from point A to point B in Figure 1 is
(A) the loss of some clothing.
(B) the loss of some food.
(C) the gain of some clothing.
(D) the gain of some food.
428 Part 4/Unit I
Use the production possibilities data below for Econville and Jimonia to answer the following
questions.
Oranges Apples
Econville 0 16
1 12
2 8
3 4
4 0
Oranges Apples
Jimonia 0 8
1 6
2 4
3 2
4 0
4. Which of the following is correct?
(A) Econville has the comparative advantage in both goods.
(B) Jimonia has the comparative advantage in oranges.
(C) Econville has the comparative advantage in oranges.
(D) Jimonia has a comparative advantage in both goods.
(E) It would be impossible for Econville and Jimonia to gain from trade.
5. Which of the following would be a mutually agreeable rate of exchange?
(A) Jimonia trades one orange to Econville for every one apple.
(B) Jimonia trades one orange to Econville for every two apples.
(C) Jimonia trades one orange to Econville for every three apples.
(D) Jimonia trades one orange to Econville for every four apples.
(E) Jimonia trades four oranges to Econville for every sixteen apples.
6. According to the law of comparative advantage, both Econville and Jimonia could gain if
(A) Econville produced all of the apples and oranges, and Jimonia did not produce anything.
(B) Econville specialized in producing apples, Jimonia specialized in producing oranges,
and they traded.
(C) Econville specialized in producing oranges, Jimonia specialized in producing apples,
and they traded.
(D) Jimonia produced all of the apples and oranges, and Econville did not produce anything.
(E) Jimonia and Econville were both were self-sufficient and did not trade.
7. Use the table below to choose the correct answer. The table outlines the production
possibilities currently facing an economy.
Good Y Good X
1 5
2 4
3 3
4 2
5 1
The opportunity cost of increasing the production of good X from 2 units to 3 units is
(A) 12 units of good Y and constant.
(B) 9 units of good Y and constant.
(C) 1 unit of good Y and constant.
(D) 12 units of good Y and increasing.
(E) 9 units of good Y and increasing.
8. Because of a late night out with friends, Francis decided to sleep in rather than attend his
8 a.m. economics class. According to economic analysis, his choice was
(A) irrational, because economic analysis suggests you should always attend classes that you
have already paid for.
(B) irrational, because oversleeping is not in Francis s self-interest.
(C) rational only if Francis has not missed any other classes.
(D) rational if Francis values sleep more highly than the benefit he expects to receive from
attending the class.
(E) rational if Francis likes his economics class better than the rest of his classes.
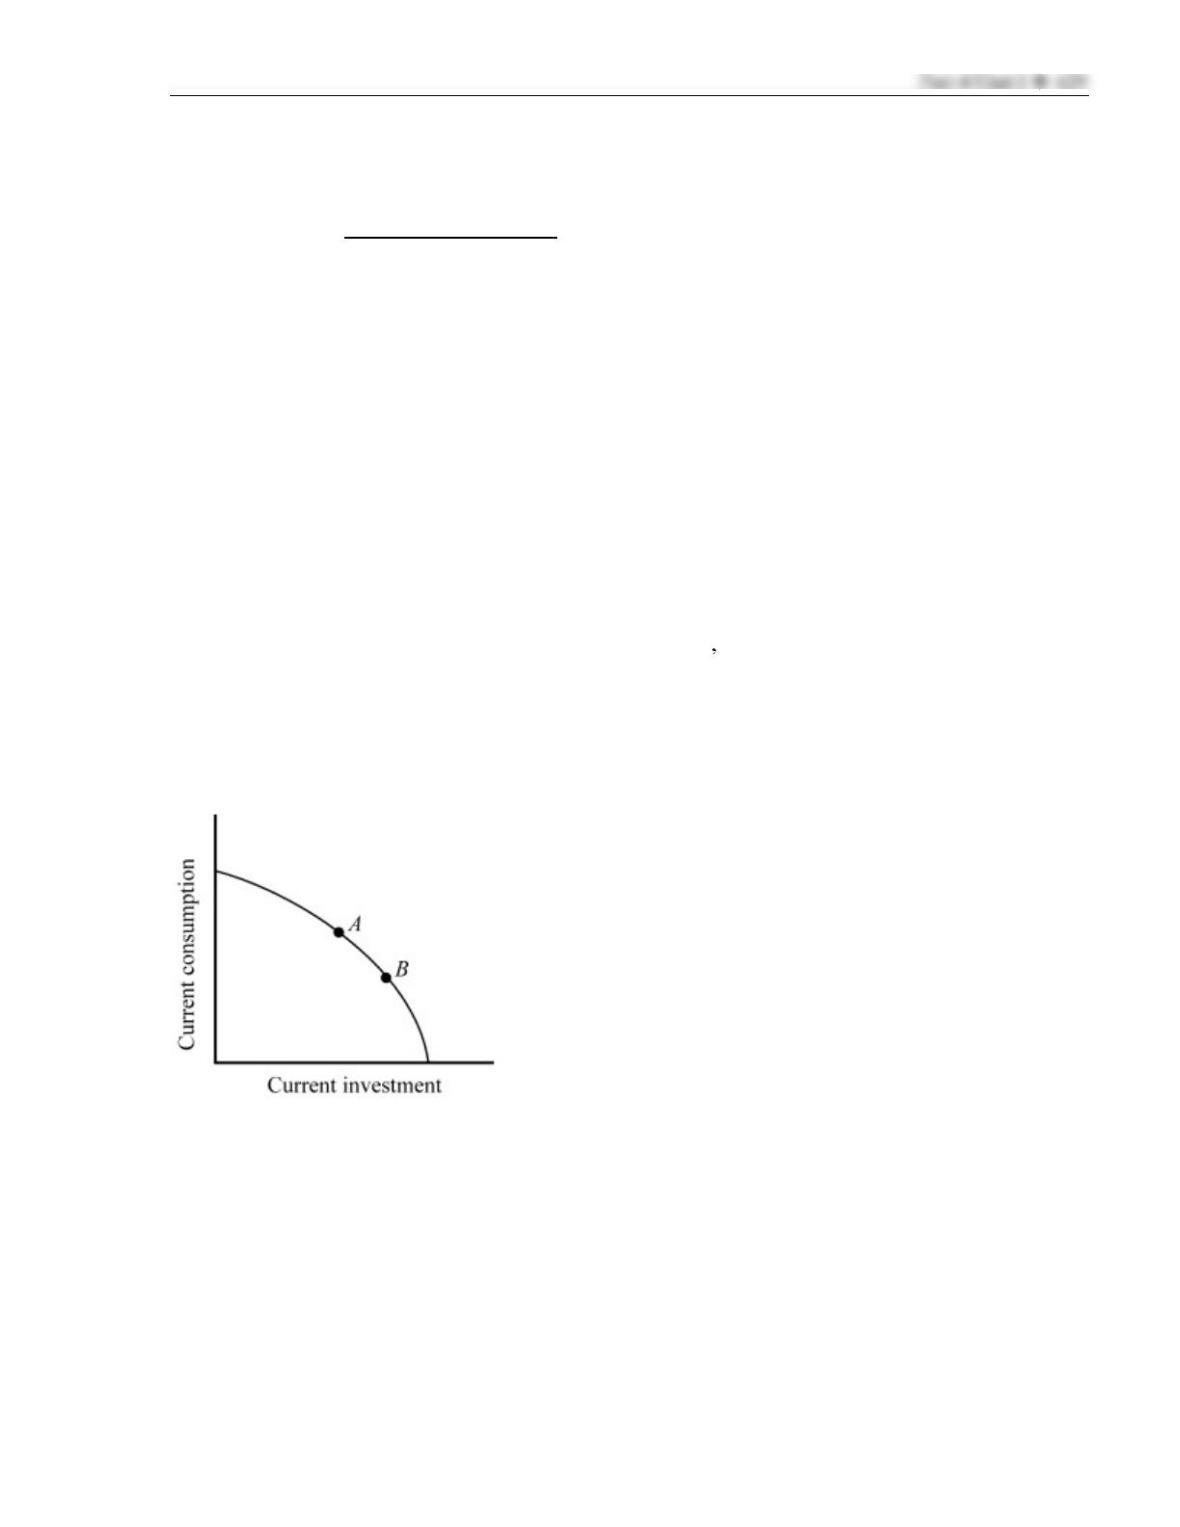
Figure 2
9. Points A and B in the figure shown indicate consumption and investment for two economies.
Other things constant, which of the economies is likely to grow more rapidly in the future?
(A) economy A
(B) economy B
(C) They can be expected to grow at the same rate.
(D) This is uncertain since growth is not influenced by the factors indicated in this example.
(E) Neither economy will experience growth as they are not maximizing their current
investment.
10. When economists say a good is scarce, they mean
(A) there are only a limited number of consumers who would be interested in purchasing the
good.
(B) the human desire for the good exceeds the amount freely available from nature.
(C) most people in poorer countries do not have enough of the good.
(D) the production of the good has no opportunity cost for society.
(E) there are some things on which it is impossible to put a price, such as human life.
11. Which of the following is true in competitive markets?
(A) Price reflects the marginal value consumers place on the last unit purchased.
(B) Price reflects the average value consumers derive from the consumption of all units of
the good.
(C) Price reflects the total value consumers derive from the consumption of all units of the
good.
(D) The total area under the demand curve, but above the price, indicates the surplus
producers derive from the production and sale of the good.
(E) The total area above the supply curve, but below the price, indicates the surplus
consumers derive from the consumption of the good.
12. In a supply and demand graph, the triangular area that represents the difference between the
market price consumers pay and the height of the demand curve is called
(A) consumer surplus.
(B) producer surplus.
(C) total surplus.
(D) triangular arbitrage.
(E) deadweight loss.
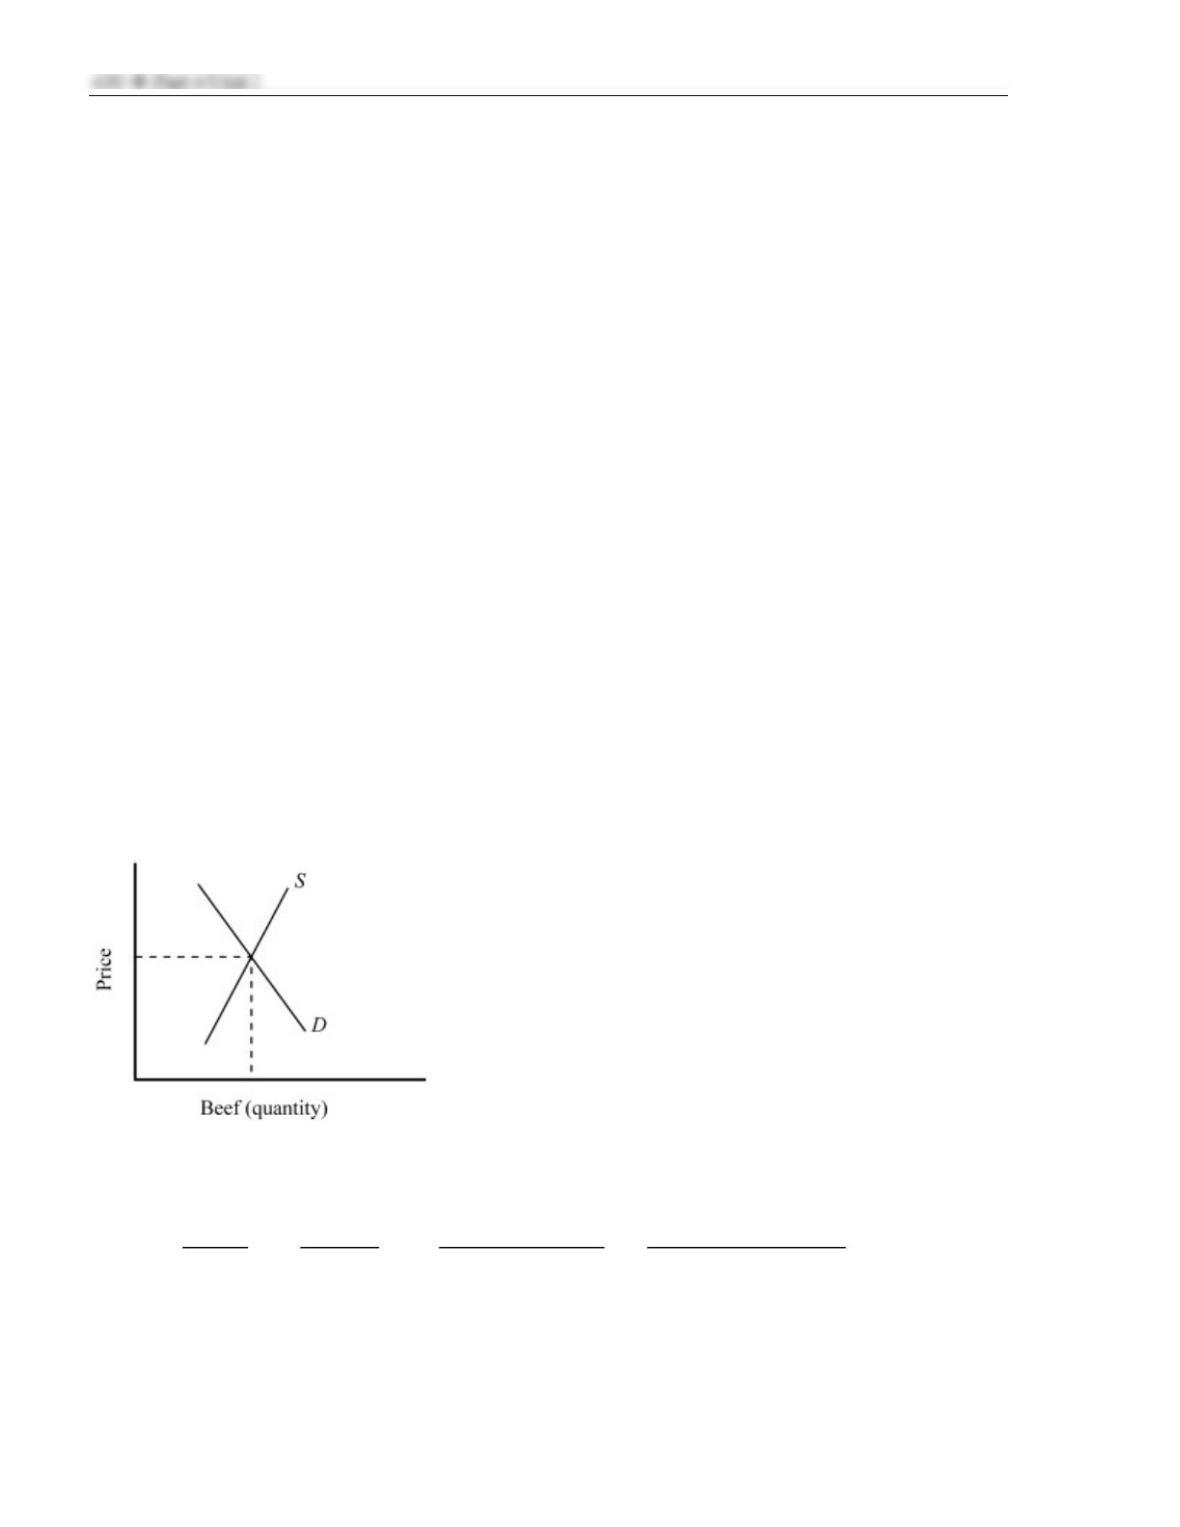
Figure 3
13. The graph in Figure 3 shows conditions in the market for beef. A reduction in the price of the
grain used to feed cattle and an increase in the price of catsup (a complement for beef) will
result in which of the following?
Supply Demand Equilibrium Price Equilibrium Quantity
(A) increase increase increase increase
(B) increase decrease indeterminate increase
(C) increase decrease increase indeterminate
(D) increase decrease decrease indeterminate
(E) decrease increase increase indeterminate
Part 4/Unit I 431
Figure 4
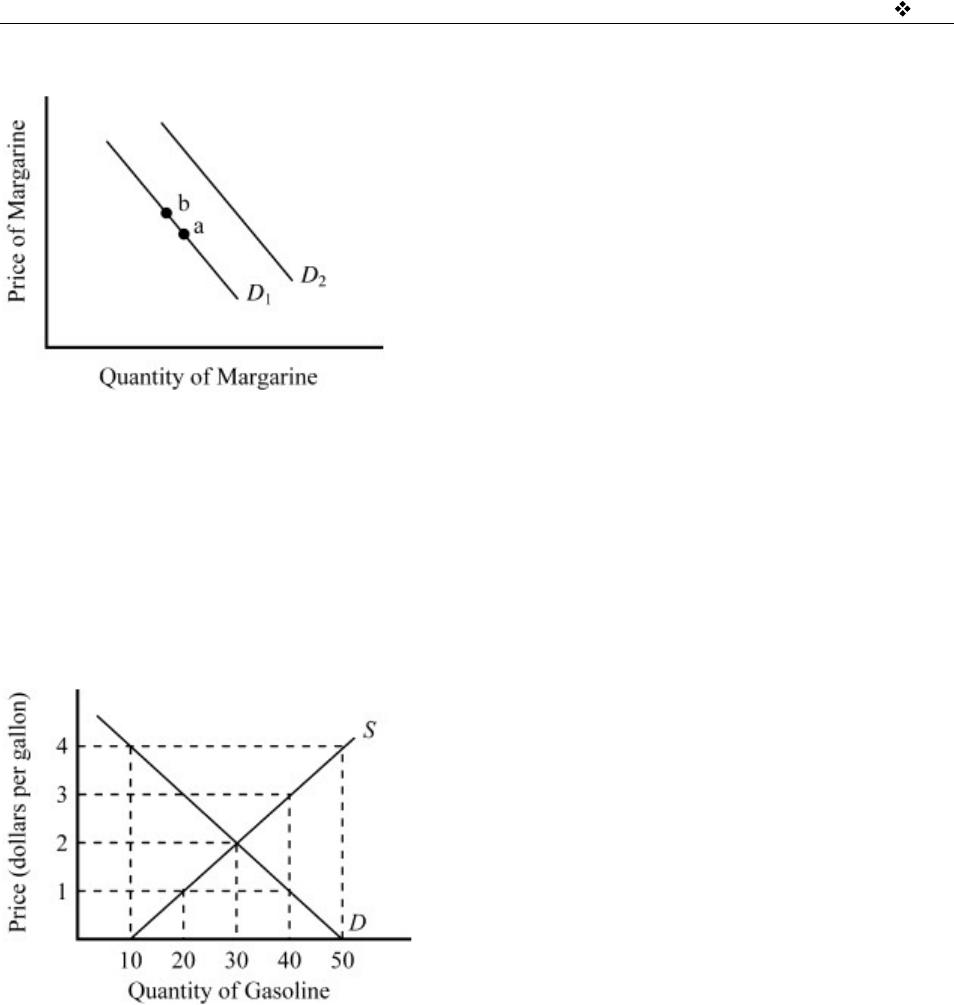
14. The graph in Figure 4 shows the initial demand for margarine at D1. An increase in the price of
butter (which is a substitute for margarine) would tend to cause which of the following
changes in the market for margarine?
(A) a shift in the demand curve from D1 to D2
(B) a shift in the demand curve from D2 to D1
(C) a movement along demand curve D1 from a to b
(D) a movement along demand curve D1 from b to a
(E) a shift in the curve coupled with a movement along the new curve
Figure 5
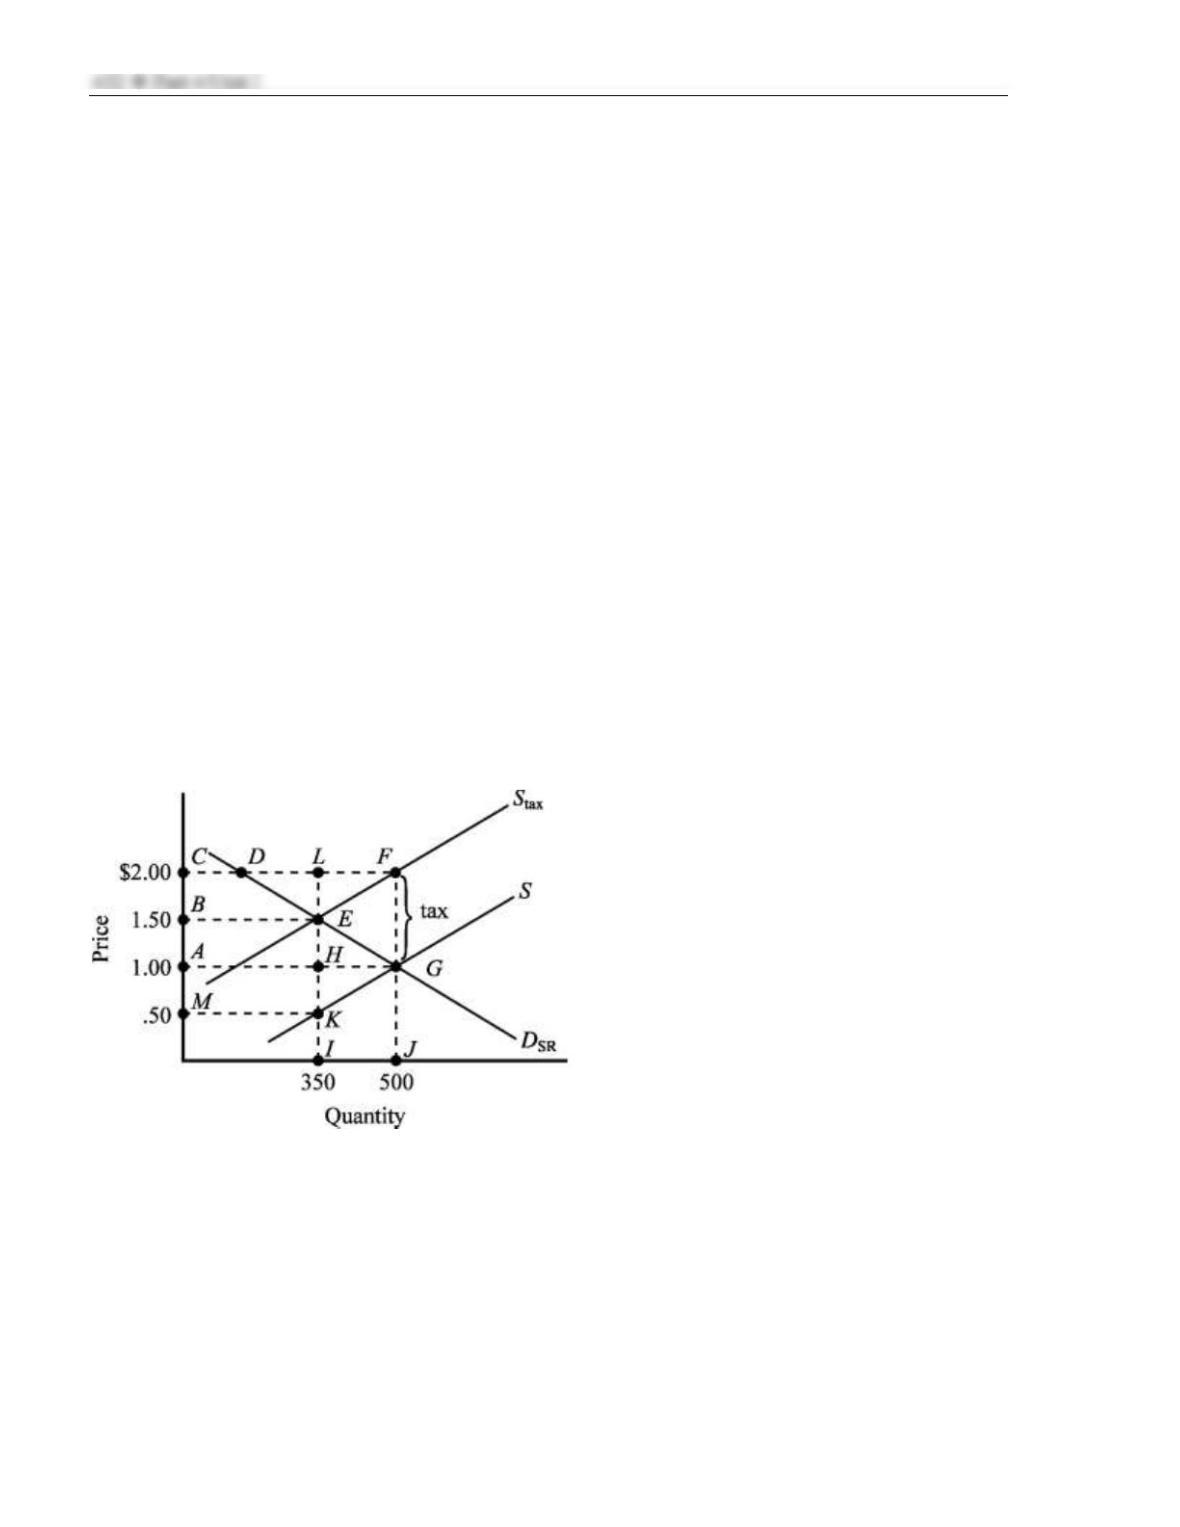
15. Given the demand (D) and supply (S) for gasoline in Figure 5, if the price of gasoline were $1
per gallon,
(A) a shortage of 40 gallons would exist.
(B) a shortage of 30 gallons would exist.
(C) a shortage of 20 gallons would exist.
(D) a surplus of 30 gallons would exist.
(E) a surplus of 20 gallons would exist.
16. As a result of the events of September 11, 2001, passengers became more reluctant to fly and
there was a substantial increase in air travel security. How did the increased fear of flying and
the higher cost of providing air travel security affect the market for air travel?
(A) Demand increased and supply decreased, causing the price of air travel to rise.
(B) Demand decreased and supply increased, causing a reduction in the price of air travel.
(C) Demand decrease and supply decreased, causing the price of air travel to fall.
(D) Demand increased, supply decreased, and therefore the net impact on the price of air
travel was uncertain.
(E) Demand decreased, supply decreased, and therefore the net impact on the price of air
travel was uncertain.
17. A technological advance that reduces the cost of producing DVD players would
(A) increase the supply of DVD players and increase the total revenue of DVD producers if
the demand for DVD players is inelastic.
(B) increase the supply of DVD players and decrease the total revenue of DVD producers if
the demand for DVD players is inelastic.
(C) decrease the supply of DVD players and increase the total revenue of DVD producers if
the demand for DVD players is elastic.
(D) decrease the supply of DVD players and decrease the total revenue of DVD producers if
the demand for DVD players is elastic.
(E) decrease the demand for DVD players and decrease the total revenue of DVD producers
whether the demand for DVD players is elastic or inelastic.
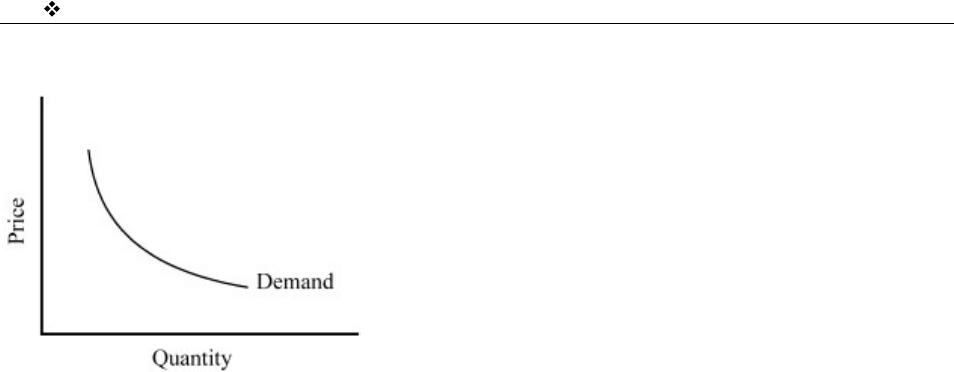
Use Figure 6 illustrating the impact of an excise tax to answer the following questions.
Figure 6
18. The amount of the excise tax is
(A) $.50.
(B) $1.00.
(C) $1.50.
(D) $1.75.
(E) $2.00.

19. The amount of the actual tax burden paid by consumers and producers is
(A) $1.00 for consumers and $.50 for producers.
(B) $1.00 for consumers and $1.00 for producers.
(C) $.25 for consumers and $.75 for producers.
(D) $.75 for consumers and $.25 for producers.
(E) $.50 for consumers and $.50 for producers.
20. The deadweight loss of the tax illustrated is given by the area
(A) ABEH.
(B) DFE.
(C) EKG.
(D) EFG.
(E) BEKM.
21. The revenue generated by the tax illustrated is given by the area
(A) ACLH.
(B) BEKM.
(C) ACFG.
(D) MCLK.
(E) EKG.
22. The fact that a gallon of bottled water commands a higher market price than a gallon of
gasoline indicates that
(A) bottled water is an inferior good and gasoline is a normal good.
(B) the marginal utility of bottled water is greater than the marginal utility of a gallon of
gasoline.
(C ) the average utility of a gallon of bottled water is greater than the average utility of a
gallon of gasoline.
(D) the total utility of bottled water exceeds the total utility of gasoline.
(E) gasoline is an inferior good and bottled water is a normal good.
23. If the demand for a product increases as the result of a decline in income, it can be concluded
that the
(A) product is an inferior good.
(B) product is a superior good.
(C) demand for the product is inelastic.
(D) price elasticity of demand for the product equals unity.
(E) demand for the product is elastic.
24. All things equal, the price elasticity of supply
(A) will be greater in the short run than the long run.
(B) will be greater in the long run than the short run.
(C) is the same for the short run and the long run.
(D) approaches zero in the long run.
(E) is perfectly inelastic in the long run.
434 Part 4/Unit I
Figure 7
25. The graph in Figure 7 above depicts a demand curve with a price elasticity that is
(A) perfectly elastic, implying that consumers will purchase as much as can be supplied at
the market price.
(B) relatively inelastic, implying that a percent increase in price results in a smaller percent
reduction in sales.
(C) relatively elastic, implying that a percentage increase in price results in a larger
percentage reduction in sales.
(D) unitary, implying that a percent change in price leads to an equal percent change in
quantity demanded.
(E) perfectly inelastic, implying that the same amount will be purchased regardless of the
price of the good.
26. (I) Private markets will tend to produce too little of a good that generates external costs from
the standpoint of economic efficiency.
(II) The market supply curve for a good that generates external costs will understate the true
social opportunity cost of production.
(III) Private markets will tend to produce too much of a good that generates external benefits
from the standpoint of economic efficiency.
(A) (I) is true; (II) is false; (III) is true.
(B) (I) is false; (II) is true; (III) is false.
(C) (I) is false; II is false; (III) is true.
(D) (I), (II), and (III) are true.
(E) (I), (II), and (III) are false.
27. What are the two distinguishing characteristics of a public good?
(A) non-rivalry in consumption and non-excludability
(B) indivisibility in production and excludability of nonpaying customers
(C) provision by government and funding through taxation
(D) mass production and comparative advantage
(E) public good exceeds public cost
Part 4/Unit I 435
Figure 8
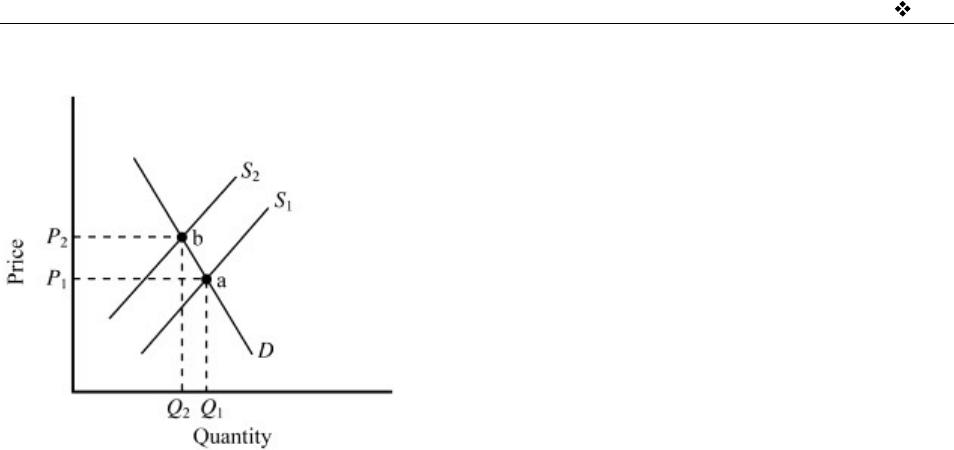
28. Figure 8 illustrates the market for a product that generates an externality. S1 is the private
market supply curve, while S2 is the supply curve including the externality. Which of the
following is true?
(A) Point a illustrates the competitive private market outcome while point b illustrates the
outcome consistent with economic efficiency for a negative externality.
(B) Point a illustrates the competitive private market outcome while point b illustrates the
outcome consistent with economic efficiency for a positive externality.
(C) Point b illustrates the competitive private market outcome while point a illustrates the
outcome consistent with economic efficiency for a negative externality.
(D) The competitive private market outcome is consistent with the conditions for economic
efficiency.
(E) The good will tend to be undersupplied relative to the conditions for economic
efficiency.
29. When the consumption of a good generates an external benefit, then
(A) the private benefit consumers receive from the good will be higher than the true social
benefit.
(B) too much of the good will tend to be produced from the viewpoint of economic
efficiency.
(C) the community generally suffers an exactly offsetting external cost from the production
of the good.
(D) the market demand curve will understate the total benefits derived from consumption of
the good and as a result too little of it will be produced and consumed.
(E) the market demand curve will overstate the total benefits derived from consumption of
the good and as a result too much of it will be produced and consumed.
30. Which of the following is the best example of a public good?
(A) long-distance telephone service
(B) national defense
(C) an amusement park
(D) the electric service of a public utility
(E) taking this test
436 Part 4/Unit I
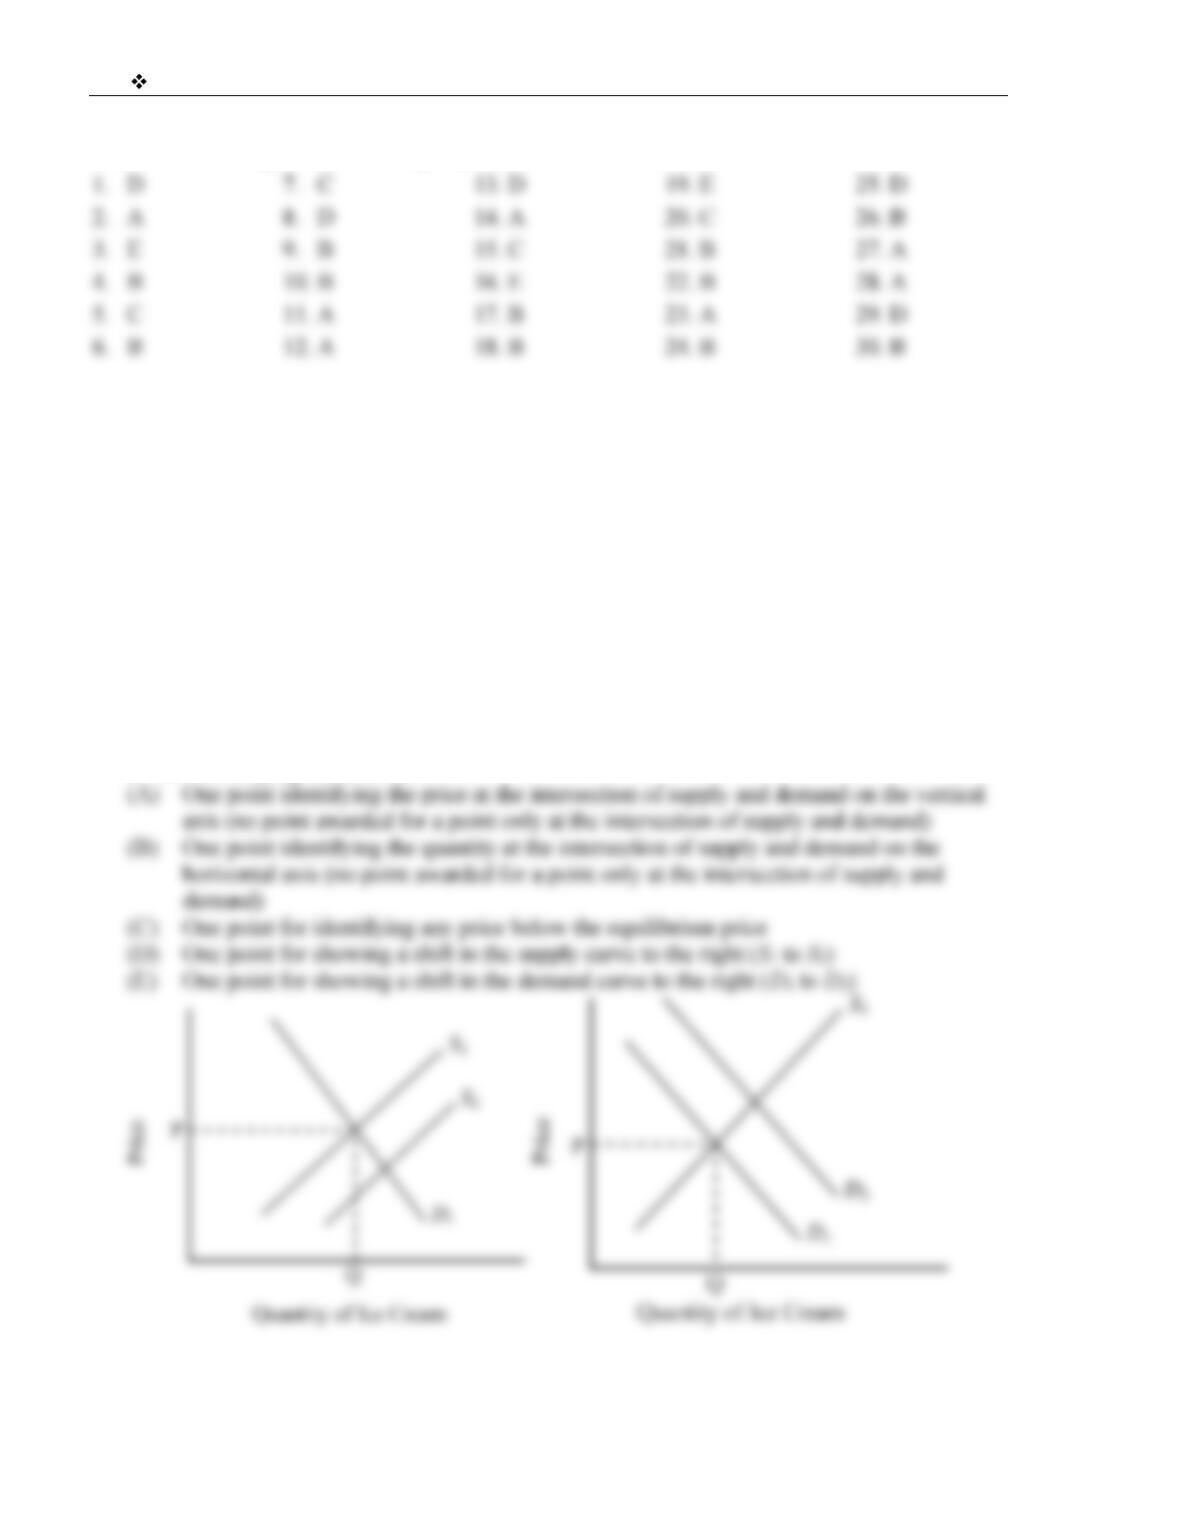
Answers to Multiple-Choice Sample Questions for Macro Unit I
Sample Free-Response Question for Macro Unit I
1. Using a correctly labeled graph of the supply of and the demand for ice cream demonstrate
each of the following:
(A) the equilibrium price of ice cream.
(B) the equilibrium quantity of ice cream.
(C) the imposition of an effective price ceiling on ice cream by the government.
(D) the effect of a decrease in the cost of producing cream (an ingredient in ice cream).
(E) the effect of a decrease in the price of cookies (a complimentary good for ice cream).
Answers to Free-Response Sample Question for Macro Unit I
This question would be graded using an 8 point rubric.
1. One point for a correctly labeled supply and demand graph with price on the vertical axis and
quantity on the horizontal axis. One point for an upward-sloping supply curve. One point for a
downward-sloping demand curve