Teaching Unit III: The third unit of instruction entails the
content areas of Nature and Functions of Product Markets, as detailed in the AP* Economics
Course Description1 (Content Area II, C-D)
I. Plan NOTE: Chapters and pages in (parenthesis) denote reference for the split text in Mi-
cro Economics
Teaching Materials
Instructors Manual Text readings
Cost and the Supply of Goods
Chapter 21 (8)
Chapter 21 (8) , Cost and Supply of
Goods
Key instructional objectives: Students do the following
Objectives related to production and output
2. define the concept of firm.
4. define and interpret production functions.
6. define the law of diminishing returns and how it is depicted by the total product and mar-
ginal product curves.
7. explain the relationship between production and cost.
Objectives related to costs
1. define and differentiate between explicit and implicit costs.
3. understand and distinguish between short run and long run cost curves.
5. define and explain economies and diseconomies of scale and constant returns to scale.
6. define and calculate the least cost combination of inputs to employ for an existing firm
Computational & graphing skills: Students must complete these tasks
1. Graph total, marginal and average outputs
2. Show point of diminishing returns on graph of production function
1
4. Graph costs: average total, average variable, average fix, and marginal
6. Graph and explain short-run and long-run average costs curves.
8. Show how a short-run supply curve is derived from marginal costs curves.
10. Interpret relationships between and among cost curves and interpret graphical relationships
(NOTE: For all calculations, a calculator is not permitted during the AP* Economics Examina-
tions)
Formative Signals: The following content and skill areas have been identified as areas of weak-
ness for students based upon past objective and free response examinations.
Objective Formative Signals: Based upon
the released objective AP* Micro Economics
examinations, less than 50% of the students
have been able to correctly answer questions
to following
Free response Formative Signals: Past stu-
dents have found these to be problematic areas
can combine data from product and re-
source market to compute cost
understand characteristics of econo-
mies of scale
cost given output and total cost
cepts and how they are related t one
another and how they can explain the
“U” shape curvatures
346 Part 3/Unit III
II. Teach
Recommended sequence of instruction: Teach production and costs concepts in this sequence
Chapter 21 (8, Micro)
Costs and the Supply of Goods
1. THE ORGANIZATION OF THE BUSINESS FIRM, P. 417 (P. 149)
Explain the differences among the different forms of organization
2. THE ECONOMIC ROLE OF COSTS, P. 420 (P. 152)
roduction and profit.
3. SHORT-RUN AND LONG-RUN TIME PERIODS, P. 422 (P. 154)
Explain distinctions between short-run and long-run periods in terms of production
4. CATEGORIES OF COSTS, P. 423 (P. 155)
Explain distinctions among costs and how to calculate different costs.
Explain the relationships among the cost curves
5. OUTPUT AND COST IN THE SHORT-RUN, P. 424 (P. 156)
-run.
Total product
6. OUTPUT AND COSTS IN THE LONG-RUN, P. 428 (P. 160)
-run average cost curve.
7. WHAT FACTORS CAUSE COST CURVES TO SHIFT? P. 433 (P. 165)
8. THE ECONOMIC WAY OF THINKING ABOUT COSTS, P. 434 (P. 166)
Explain factors causing changes in cost of the firm.
Change in the cost of fixed factors of production (affects only TC, ATC, FC, and AFC)
Key conceptual questions: Students demonstrate their understanding of the material by answer-
ing the following key conceptual questions
1. What are the different forms of business structures? What differentiates these different
structures from one another?
2. How does the short-run differ from the long-run?
3. What are the relationships among AFC, ATC, AVC and MC?
4. What distinguishes short-run from the long-run?
5. What differentiates short-run cost from long-run cost?
6. Why does marginal product first rise and then decline as more variable inputs are added to
the production process.
7. What is the law of diminishing returns and what does it imply about production and costs
in the short-run?
8. How does the law of diminishing returns account for an eventually increasing marginal
cost curve for a firm in the short-run?
9. What is the relationship between marginal product and marginal cost?
10. How are the marginal costs (MC) related to: (a) the average total cost (ATC); the average
variable cost (AVC) and; average fixed cost (AFC)?
11. Why are economic profits a better basis for decision making than accounting profits?
III. Assess: Suggestions for determining what and how much students have learned.
Past Objective AP* Test: Based upon released objective examinations, the students have been
required to demonstrate the following content related to this unit of instruction.
Tasks related to short-run production such as
recognize diminishing returns from a production function
compute marginal product, given new novel information
understand and explain relationship between marginal productivity and average
productivity
Tasks related to short-run costs such as
determine cost concepts, from reading a given graph
read cost curves and determine what cost concept is applicable
compute ATC, given information of MC, and TFC
calculate marginal cost, given data of output and total cost
calculate average total cost , given output and total cost
Recognizes impact on cost/output and MC given changes in technology
defines and understands marginal cost
Tasks related to long run production such as
understand economies of scale and what happens when input is changed
recognize long-run constant costs, increasing costs, and decreasing costs
Part 3/Unit III 349
understands definition of economies of scale
understand relationships between cost concepts (ATC and M understand characteristics
and conditions of economies of scale
Past Free Response AP* Questions: Based upon released free response questions, the students
have been required to demonstrate the following content related to this unit of instruction.
1998, explain relationships between AP and MP; describes relationship between cost and
production; identifies law of diminishing marginal returns
2005B, given an unmarked graph, identify ATC, AVC, and MC; deduce the presence of
average fixed cost explains effects of specialization and then diminishing returns as it re-
lates to decreases and increases in the marginal cost.
Sample Multiple-Choice Questions for Micro Unit III
1. The sum of the explicit and implicit costs incurred in the production process is called
(A) fixed cost.
(B) variable cost.
(C) sunk cost.
(D) marginal cost.
(E) total cost.
2. For most firms, the major difference between accounting profit and economic profit is that
(A) explicit and implicit costs are included in the accounting profit while only explicit costs
are included in economic profit.
(B) accounting profit omits the salaries of managers, and therefore it is generally greater than
economic profit.
(C) accounting profit is based on opportunity cost, whereas economic profit is based on mar-
ket transactions.
(D) accounting profit does not consider the opportunity cost of the firm s equity capital and
therefore generally overstates profit.
(E) accounting profit does not consider the opportunity cost of the firm s equity capital and
therefore generally understates profit.
3. The short run is a time period such that
(A) the existing firms in the market do not have sufficient time to change the amounts of any
of the inputs that they employ.
(B) the existing firms in the market do not have sufficient time to either increase or decrease
their current rate of output.
(C) the existing firms in the market do not have sufficient time to increase the size of their
existing plant or build a new factory.
(D) the existing firms in the market have sufficient time to increase or decrease the size of
their existing plant or build a new factory.
(E) new firms may build plants and enter the industry.
4. Which of the following factors of production is NOT variable in the long run?
(A) the size of the firm s plant
(B) property taxes on the assets of the firm
(C) highly trained labor
(D) capital equipment
(E) All factors are variable in the long run.
5. Use the table below to answer the following question.
Units of Total Fixed Total Variable
Output Cost (dollars) Cost (dollars)
1 1,000 1,200
2 1,000 2,400
3 1,000 3,600
4 1,000 5,000
5 1,000 6,600
What is the average total cost at an output level of four units?
(A) $1,200
(B) $1,400
(C) $1,500
(D) $2,000
(E) $6,000
6. Use the table below to answer the following question.
Units of Output
Variable Cost
(dollars)
Total Cost
(dollars)
Marginal
Cost
(dollars)
0
0
40
0
1
30
70
30
2
50
90
20
3
60
100
10
4
75
120
20
5
105
150
30
6
150
200
50
Part 3/Unit III 351
Average total cost is at a minimum when the output level is
(A) 2 units.
(B) 3 units.
(C) 4 units.
(D) 5 units.
(E) 6 units.
7. Use the table below to answer the following question.
Units of Output Total Fixed Cost (dollars) Total Variable Cost (dollars)
1 150 25
2 150 50
3 150 90
4 150 110
What is the marginal cost of producing the third unit of output?
(A) zero
(B) $20.00
(C) $40.00
(D) $50.00
(E) $80.00
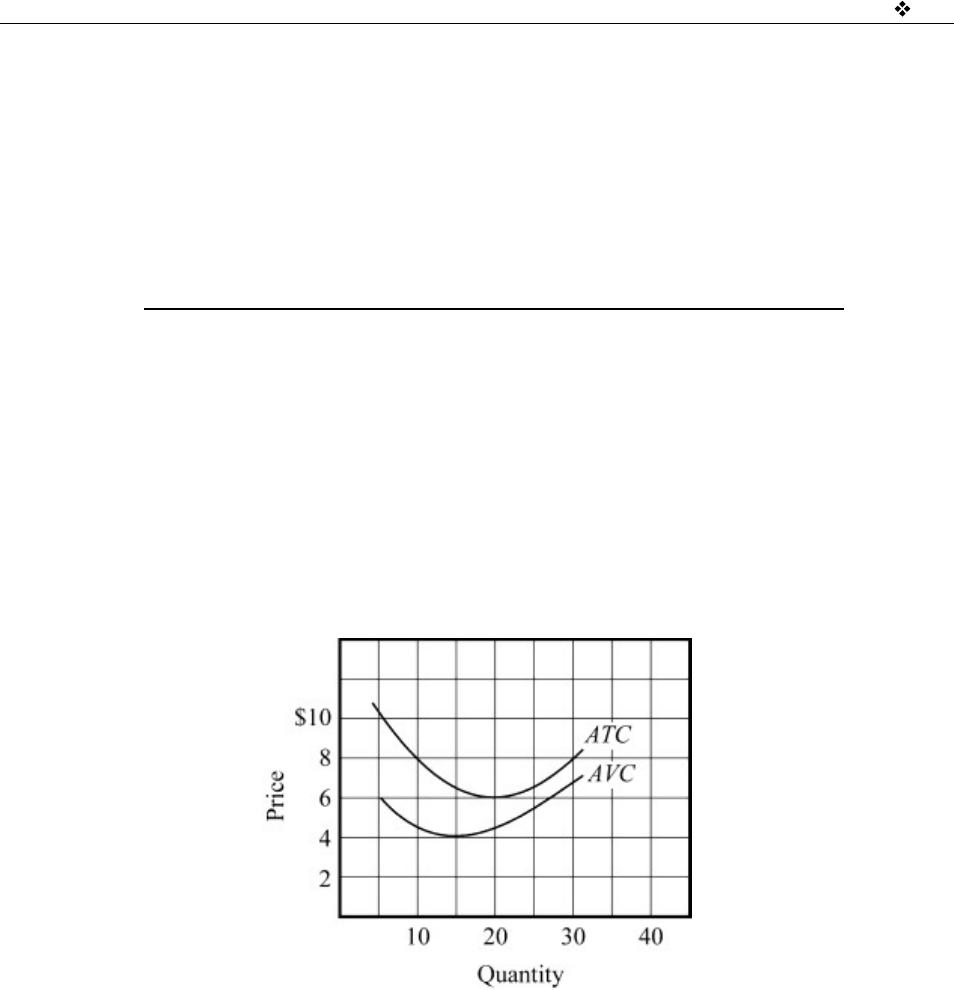
Figure 1
8. The average variable cost (AVC) and average total cost (ATC) for a firm are indicated above in
Figure 1. If the marginal cost curve were constructed, at what output would it cross the AVC
curve and the ATC curve respectively?
(A) 10 and 20
(B) 15 and 20
(C) 20 and 15
(D) 20 and 10
(E) That cannot be determined without adding the AFC curve to the graph.
352 Part 3/Unit III
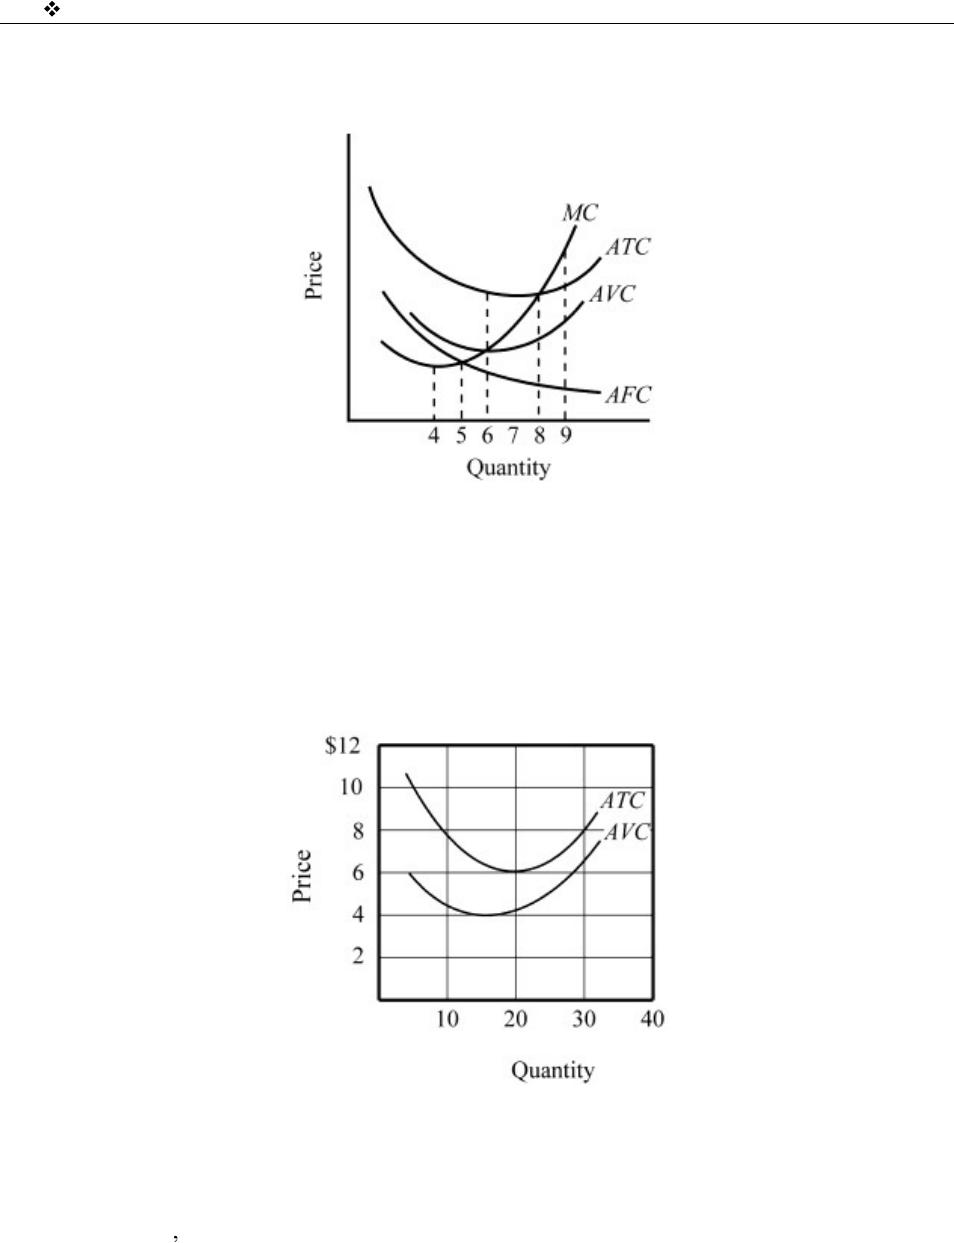
Use this graph when answering the next question.
Figure 2
9. Which output minimizes per-unit cost?
(A) 4
(B) 5
(C) 6
(D) 8
(E) 9
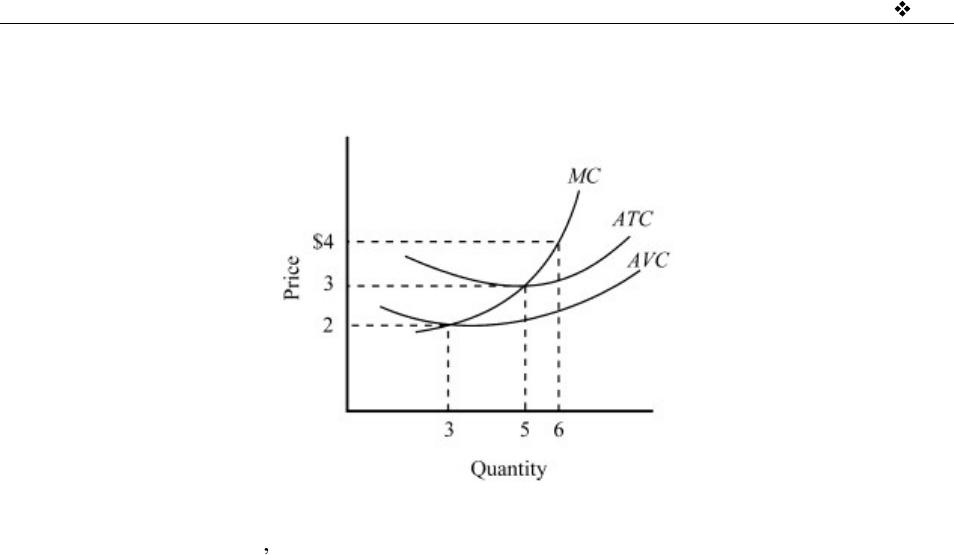
Use this graph when answering the next question.
Figure 3
10. Which of the following is true for a firm with the costs illustrated in Figure 3 above?
(A) Marginal costs exceed average total cost when output is 15.
(B) Marginal costs exceed average total cost when output is 20.
(C) Marginal costs exceed average total cost when output is 25.
(D) Marginal costs equal average total cost when output is 15.
(E) The firm s total fixed cost exceeds 40.
Part 3/Unit III 353
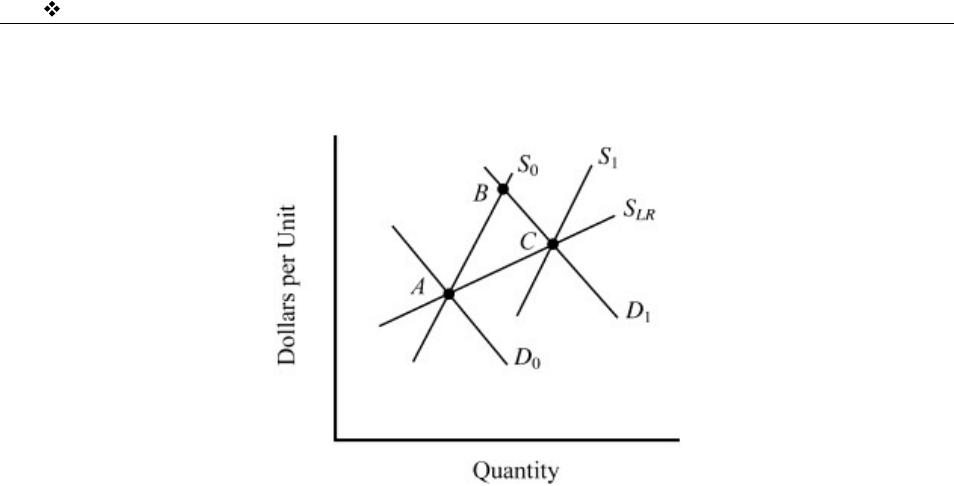
Use this graph when answering the next question.
Figure 4
11. The cost conditions for a profit-maximizing firm operating in a price-taker market are indi-
cated in Figure 4 above. If the market price was $3, what output should the firm produce and
what would be the firm s maximum profit?
(A) output, 3; maximum profit, $3 loss
(B) output, 3; maximum profit, $0
(C) output, 5; maximum profit, $0
(D) output, 5; maximum profit, $5
(E) output, 6; maximum profit, $6
354 Part 3/Unit III
Use this graph when answering the next question.
Figure 5
12. In Figure 5 above, the movement from points A to B to C can best be explained by which of
the following factors?
(A) a decrease in demand, followed by the entry of new firms and an expansion in supply in a
constant cost industry
(B) an increase in demand, followed by the entry of new firms and an expansion in supply in
an increasing cost industry
(C) a decrease in demand, followed by the exit of firms and a decline in supply in an increas-
ing cost industry
(D) an increase in demand, followed by the exit of firms and a decline in supply in a constant
cost industry
(E) an increase in demand, followed by the exit of firms and an expansion in supply in an in-
creasing cost industry
13. An upward-sloping, long-run supply curve is caused by which of the following?
(A) increasing managerial efficiency as a firm expands output
(B) increasing resource cost as a result of the expansion in total market output
(C) increasing competition among firms in the sale of the product
(D) decreasing productivity of workers as a result of increasing output
(E) decreasing average fixed cost as output expands
14. If factor prices rise as demand increases and firms expand output, the long-run market supply
curve will be upward sloping. In terms of economics, this describes a(n)
(A) oligopolistic industry.
(B) monopolistic industry.
(C) constant cost industry.
(D) increasing cost industry.
(E) decreasing cost industry.
15. Quantity Total Benefit Total Cost
0 0 0
1 100 25
2 145 50
3 175 75
4 195 100
5 210 125
6 220 150
The total benefit and total cost of consuming pizza is listed in the table above. Based on the
information in the table, what is the utility maximizing quantity of pizza for a rational con-
sumer to consume?
(A) 0
(B) 3
(C) 4
(D) 5
(E) 6
Answers to Multiple-Choice Sample Questions for Micro Unit III
Sample Free–Response Question for Micro Unit III
1. Using one correctly labeled graph, draw each of the following curves:
(A) average variable cost.
(B) average fixed cost.
(C) average total cost.
(D) marginal cost.
Answers to Free-Response Sample Question for Micro Unit III
This question would be graded using a 7 point rubric.
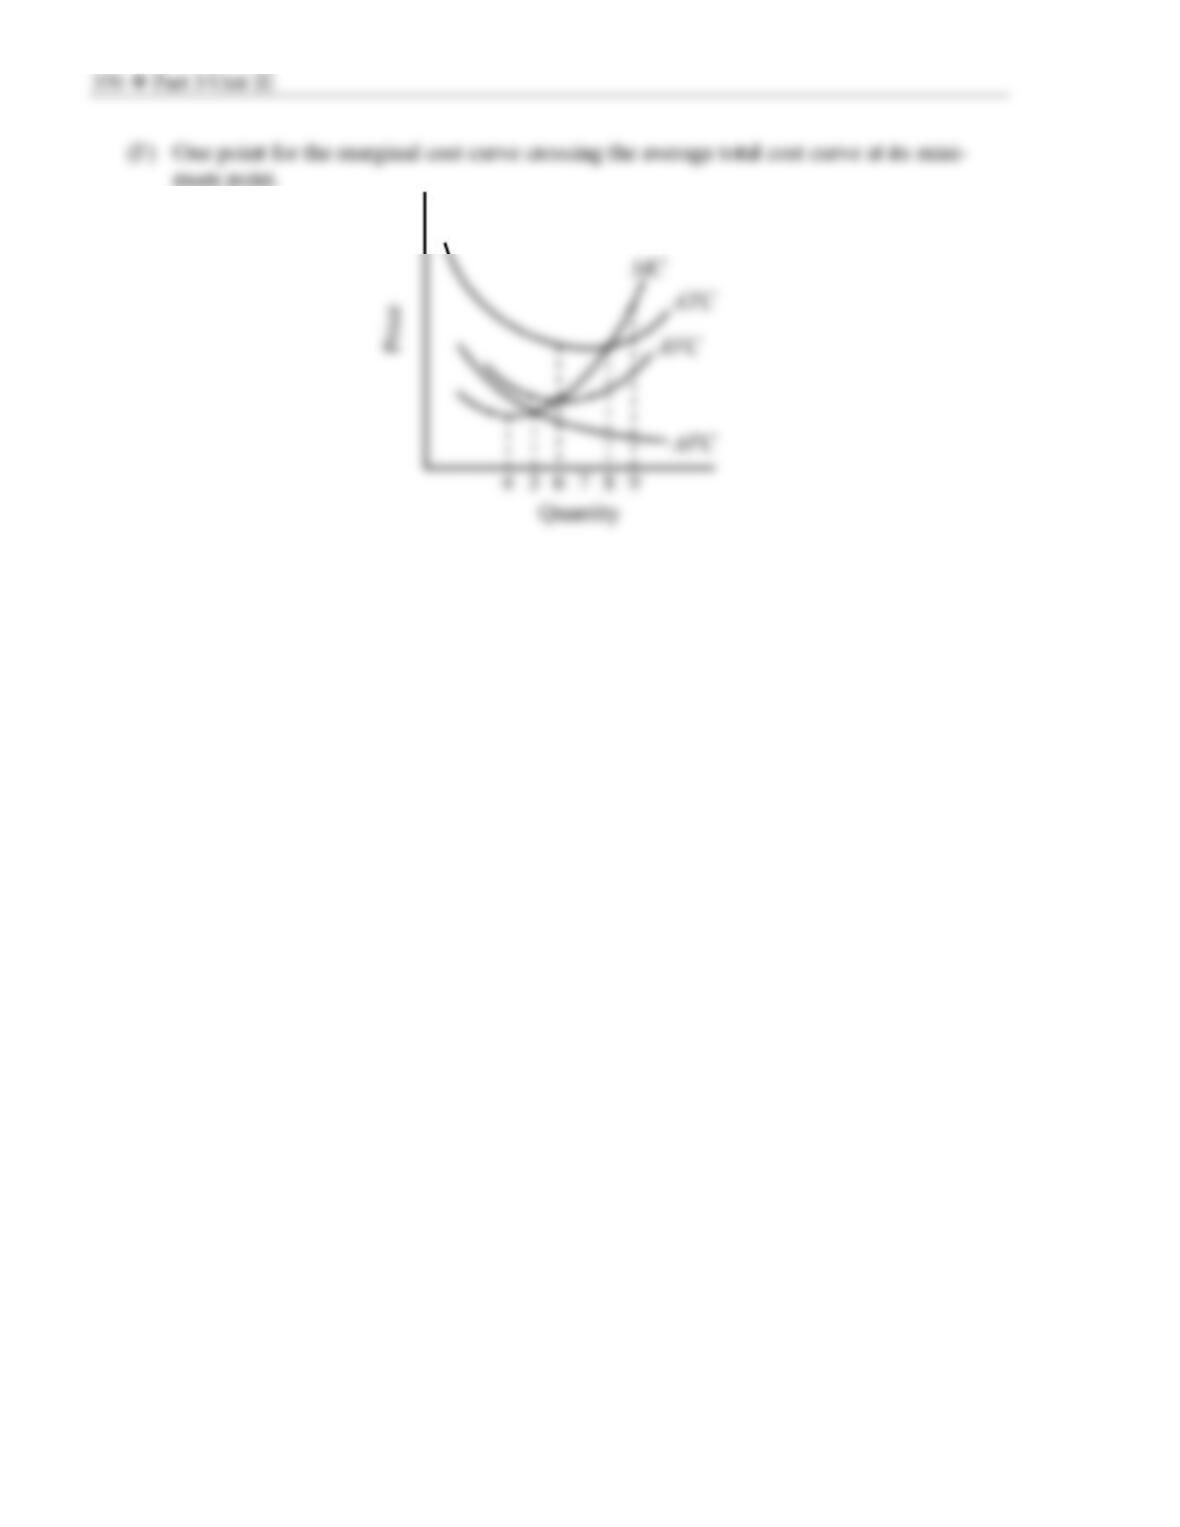
1. One point for a correctly labeled graph with cost or price on the vertical axis and quantity on
the horizontal axis.
(A) One point for a correctly drawn average variable cost curve.