Teaching Unit II : The Market The second unit of instruction entails the content areas of The
Nature and Functions of Product Markets as detailed in the AP* Economics Course Description1
(Content Area II, A-B) and includes topics of Market Failure and the Role of Government (Con-
tent Area IV, A-B)
I. Plan (NOTE: Chapters and pages in (parenthesis) denote reference for the slit text in Micro
Economics
Teaching Materials
Instructors Manual Text readings
Supply, Demand and the Market
Process,
Chapter 3
Chapter 3, Supply, Demand and the
Market Process
Supply and Demand: Applications
and Extensions,
Chapter 4
Chapter 4, Supply and Demand:
Applications and Extensions
The Economic Role of Government
Chapter 5
Chapter 5, Difficult Cases for the
Market and the Role of Government
Gaining from International Trade,
Chapter 18 (16)
Chapter, 18 (16), Gaining from In-
ternational Trade
Consumer Choice and Elasticity
Chapter 20 (7)
Chapter 20 (7), Consumer Choice
and Elasticity
Key instructional objectives: Students do the following
Objectives related to the law of demand
2. distinguish between change(s) in demand and change(s) in quantity demanded.
4. identify and explain the variables which cause a change in demand.
5. illustrate and explain the changes in quantity demanded given a price change.
Objectives related to the law of supply
1. define and illustrate supply through schedules and graphs.
3. explain the direct relationship between price and quantity supplied.
5. illustrate and explain the changes in quantity supplied given a price change.
1
326 Part 3/Unit II
Objectives related to the laws of supply and demand
1. explain the role of price in a market economy.
3. define and illustrate surpluses and shortages.
5. predict the changes in price and quantities given changes in demand and/or supply.
7. interpret market conditions given novel data.
Objectives related to elasticity
2. identify, and interpret the relationship between price elasticity of demand and the effect of a
price change on total revenue
4. list and explain the determinants of price elasticity of demand.
6. define and differentiate between normal and inferior goods.
7. calculate and explain the price elasticity of supply.
Objectives related to the applications to supply and demand
1. define and explain the effects of price ceilings and price supports.
3. illustrate and explain the effects of a given government policy.
5. identify and calculate tax revenues, deadweight loss.
Objectives related to taxation/subsidies
2. explain the burden of taxation given elasticity information.
3. identify who benefits from the imposition of a subsidy.
Objectives related to international supply and demand
1. identify and explain the international equilibrium price and quantity
3. derive an excess supply schedule/graph
4. analyze the effects of tariffs and import quotas on international markets and domestic markets
Objectives related to the government s role in the market economy
1. define and describe the effects of negative and positive externalities.
3. use supply and demand analysis to show effects of externalities and to solve externality prob-
4. define and give examples of public goods
6. identify and explain solutions to issues of public goods
Computational & graphing skills: Students must complete these tasks
2. Given novel changes in demand and /or supply, graph the changes and show the changes in
equilibrium price and quantities.
4. Graphically illustrate changes in demand and supply with those of changes in quantity de-
manded and quantity supplied.
5. Calculate shortages/surpluses from novel data
6. Graph and illustrate the tax burden given an elastic and inelastic demand.
8. Identify and calculate consumer and producer surplus
10. Interpret elasticity coefficients
12. Given various elasticities of demand and a change in supply, graph and explain the effects on
price and quantity
Formative Signals: The following content and skill areas have been identified as areas of weak-
ness for students based upon past objective and free response examinations.
Objective Formative Signals: Based upon
the released objective AP* Micro Economics
examinations, less than 50% of the students
have been able to correctly answer questions
to
following
Free response Formative Signals: Past stu-
dents have found these to be problematic areas
characteristics of positive externalities; op-
timal price and output
consequences of producing with negative
impose an effective (binding) price ceiling
and interpret graphs with ceilings/floors
understand difference between supply and
328 Part 3/Unit II
II. Teach
Recommended sequence of instruction: Teach market concepts in this sequence
Chapter 3
Supply, Demand, and the Market Process
1. CONSUMER CHOICE AND THE LAW OF DEMAND, P. 43
2. RESPONSIVENESS OF QUANTITY DEMANDED TO PRICE CHANGES, P. 46
3. CHANGES IN DEMAND VERSUS CHANGES IN QUANTITY DEMANDED, P. 47
(a) Distinguish between quantity demanded and demand and explain what determines
demand.
Law of demand
Changes in demand
5. PRODUCER CHOICE AND THE LAW OF SUPPLY, P. 51
6. RESPONSIVENESS OF QUANTITY SUPPLIED TO PRICE CHANGES, P. 55
7. CHANGES IN SUPPLY VERSUS CHANGES IN QUANTITY SUPPLIED, P. 56
Distinguish between quantity supplied and supply and explain what determines supply.
Law of supply
Changes in supply
7. HOW MARKET PRICES ARE DETERMINED; SUPPLY AND DEMAND INTERACT, P.
57
8. HOW MARKETS RESPOND TO CHANGES IN DEMAND AND SUPPLY, P. 61
Part 3/Unit II 329
Explain how demand and supply determine price and quantity in a market and explain the effects
of changes in demand and supply
Law of market forces
Chapter 4
Supply and Demand: Applications and Extensions
1. THE ECONOMICS OF PRICE CONTROLS, P. 70
2. BLACK MARKETS AND THE IMPORTANCE OF THE LEGAL STRUCTURE, P. 77
Explain how price ceilings create a shortage, and inefficiency
3. THE IMPACT OF A TAX P. 78
4. TAX RATES, TAX REVENUES AND THE LAFFER CURVE. P. 83
Describe the effects of sales taxes and excise taxes, determine who pays these taxes, and explain
5. THE IMPACT OF A SUBSIDY, P. 87
Describe the effects of a subsidy and determine the potential benefits to seller and buyers
Elasticity of demand
Chapter 5
Difficult Cases for the Market and The Role of Government
1. A CLOSER LOOK AT ECONOMIC EFFICIENCY, P. 93
Define efficiency in terms of marginal benefits equal marginal cost
2. POTENTIAL SHORTCOMINGS OF THE MARKET, P. 96
Explain why negative externalities lead to inefficient overproduction
Externalities (spillover cost)
Private cost vs. social cost
330 Part 3/Unit II
Explain why positive externalities lead to inefficient underproduction
Distinguish among private goods, public goods, and explain why the market may not provide
efficient allocation of resources to produce those goods/services.
Excludable goods
Chapter 18 (16)
Gaining from International Trade
1 . SUPPLY, DEMAND, AND INTERNATIONAL TRADE, P. 363 (P.305)
Explain the process of constructing an international supply and demand graph for a product.
2. THE ECONOMICS OF TRADE RESTRICTIONS, P. 365 (P. 307)
Graph and explain how tariffs and quotas diminish the domestic producer and consumer surplus
Chapter 20 (7)
Consumer Choice and Elasticity
1. FUNDAMENTALS OF CONSUMER CHOICE, P. 399 (P. 131)
2. MARGINAL UTILITY, CONSUMER CHOICE, AND THE DEMAND CURVE OF AN
INDIVIDUAL, P. 400. (P. 132)
Define utility
3. MARKET DEMAND REFLECTS THE DEMAND OF INDIVIDUAL CONSUMERS P. 404
(P. 136)
4. . ELASTICITY OF DEMAND P. 405 (P. 137)
Define, explain the factors that influence the price elasticity of demand and calculate the price
elasticity of demand.
: Price elasticity of demand
3. HOW DEMAND ELASTICITY AND PRICE CHANGES AFFECT TOTAL
EXPENDITURES (OR REVENUES) ON A PRODUCT, P. 411 (P. 143)
Relationship between elasticity and total revenues
4. INCOME ELASTICTY, PP. 412 (P. 144)
Define and explain the factors that influence cross elasticity of demand and income elasticity of
demand.
Cross elasticity of demand
5. PRICE ELASTICITY OF SUPPLY, P. 413 (P. 145)
elasticity of supply and calculate the price elasticity of supply.
Price elasticity of supply
Elastic vs. inelastic supply
Key conceptual questions: Students demonstrate their understanding of the material by answer-
ing the following key conceptual questions
.
1. What factors affect quantity demanded (Demand)?
2. What factors affect quantity supplied (Supply)?
3. Why is equilibrium important in a market economy?
4. What is the price elasticity of demand and what factors determine elasticity?
5. How is total revenue related to the price elasticity of demand?
6. What is income elasticity? What are normal goods? What are inferior goods?
7. What is the price elasticity of supply?
8. How do government price ceilings, price floors, taxation, and subsidies change equilibrium
price and quantity?
332 Part 3/Unit II
III. Assess: Suggestions for determining what and how much students have learned.
Past Objective AP* Test: Based upon released objective examinations, students have been re-
quired to demonstrate the following content related to this unit of instruction.
Tasks related to the changes in demand and supply such as:
identify examples of the law of demand (inverse relationship between price and quantity de-
manded)
recognize events or conditions that would cause a change in the demand for a product
Tasks related to reading and interpreting supply and demand graphs to find equilibrium
price and equilibrium quantities.
recognize what shifts in supply/demand will cause a decrease/increase in the equilibrium price
and quantities
know what causes a fall in the price of a product (shifts in both supply and demand)
recognize novel combinations causing changes in supply and demand that cause an increase
in the price of a good with a decrease in equilibrium quantities
Part 3/Unit II 333
Tasks related to elasticity of demand; income elasticity and elasticity of supply
understand meaning of income elasticity (normal vs. inferior goods)
understand price ceilings and floors and what happens to quantity demanded and quantity sup-
plied in each case
Tasks related to results of price ceilings and floors, given novel graphs of supply and de-
mand
interpret impact of price ceilings and floors, given a novel graph
recognize a price ceiling imposed on supply and demand model
Tasks related to the imposition of a tax or subsidy on a good or service.
Tasks related to consumer and producer surplus.
Tasks related to recognizing positive and negative externalities and possible societal/govern-
ment solutions for externality issues
understand how firms produce in an unregulated market with negative externalities
334 Part 3/Unit II
identify positive externalities and government attempts to correct
know arguments/strategies to reduce externalities by government through taxation
Past Free Response AP* Questions: Based upon released free response questions, the students
have been required to demonstrate the following content related to this unit of instruction.
1989, shows and explains an effective (binding) price ceiling
1990, explain the effects on price and output given a change in demand in competitive in-
dustry
Part 3/Unit II 335
Sample Multiple-Choice Questions for Micro Unit II
1. Which of the following is true in competitive markets?
(A) Price reflects the marginal value consumers place on the last unit purchased.
(B) Price reflects the average value consumers derive from the consumption of all units of the
good.
(C) Price reflects the total value consumers derive from the consumption of all units of the
good.
(D) The total area under the demand curve, but above the price, indicates the surplus produc-
ers derive from the production and sale of the good.
(E) The total area above the supply curve, but below the price, indicates the surplus consum-
ers derive from the consumption of the good.
2. In a supply and demand graph, the triangular area that represents the difference between the
market price consumers pay and the height of the demand curve is called
(A) consumer surplus.
(B) producer surplus.
(C) total surplus.
(D) triangular arbitrage.
(E) deadweight loss.
336 Part 3/Unit II
Use this graph when answering the next question.
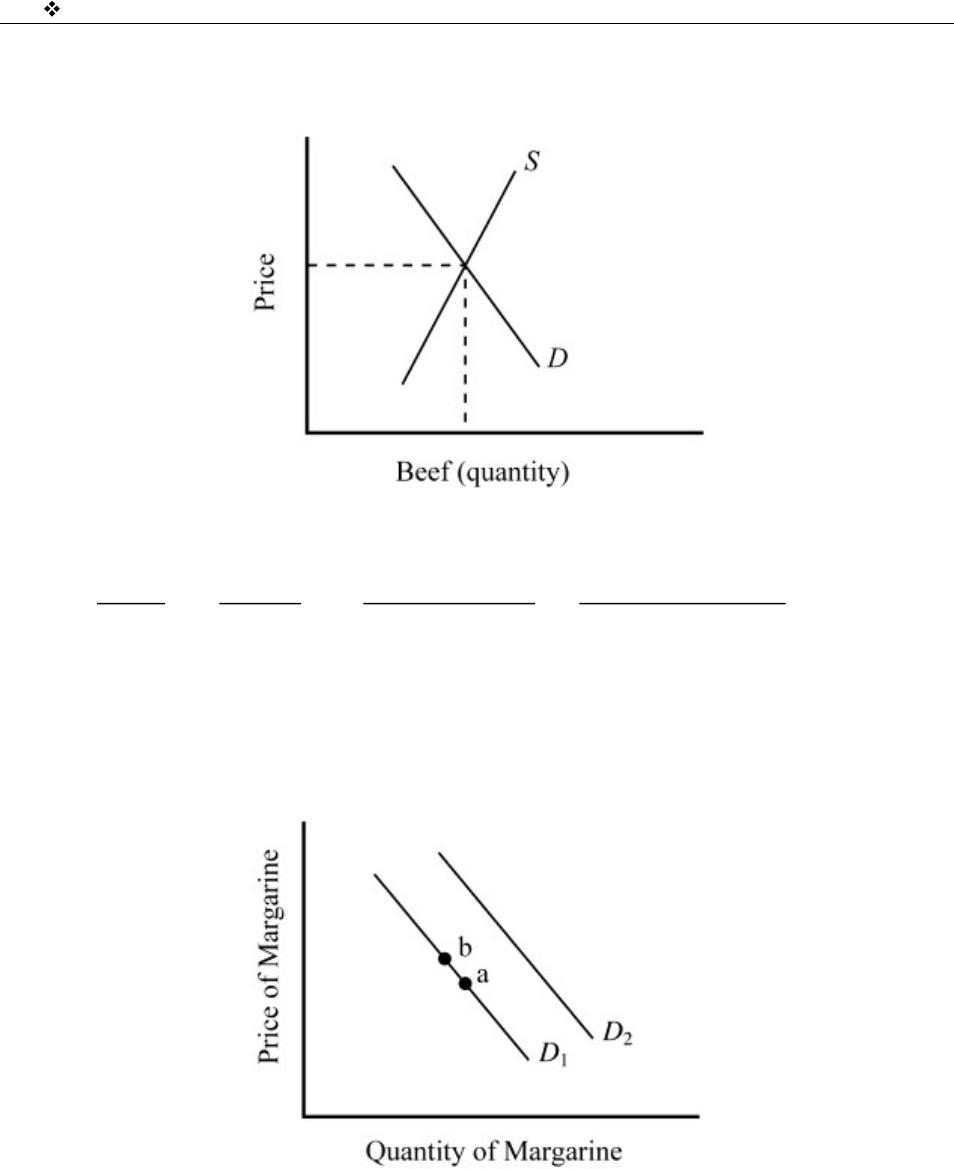
Figure 1
3. The graph in Figure 1 shows conditions in the market for beef. A reduction in the price of the
grain used to feed cattle and an increase in the price of catsup (a complement for beef) will re-
sult in which of the following?
Supply Demand Equilibrium Price Equilibrium Quantity
(A) increase increase increase increase
(B) increase decrease indeterminate increase
(C) increase decrease increase indeterminate
(D) increase decrease decrease indeterminate
(E) decrease increase increase indeterminate
Use this graph when answering the next question.
Figure 2
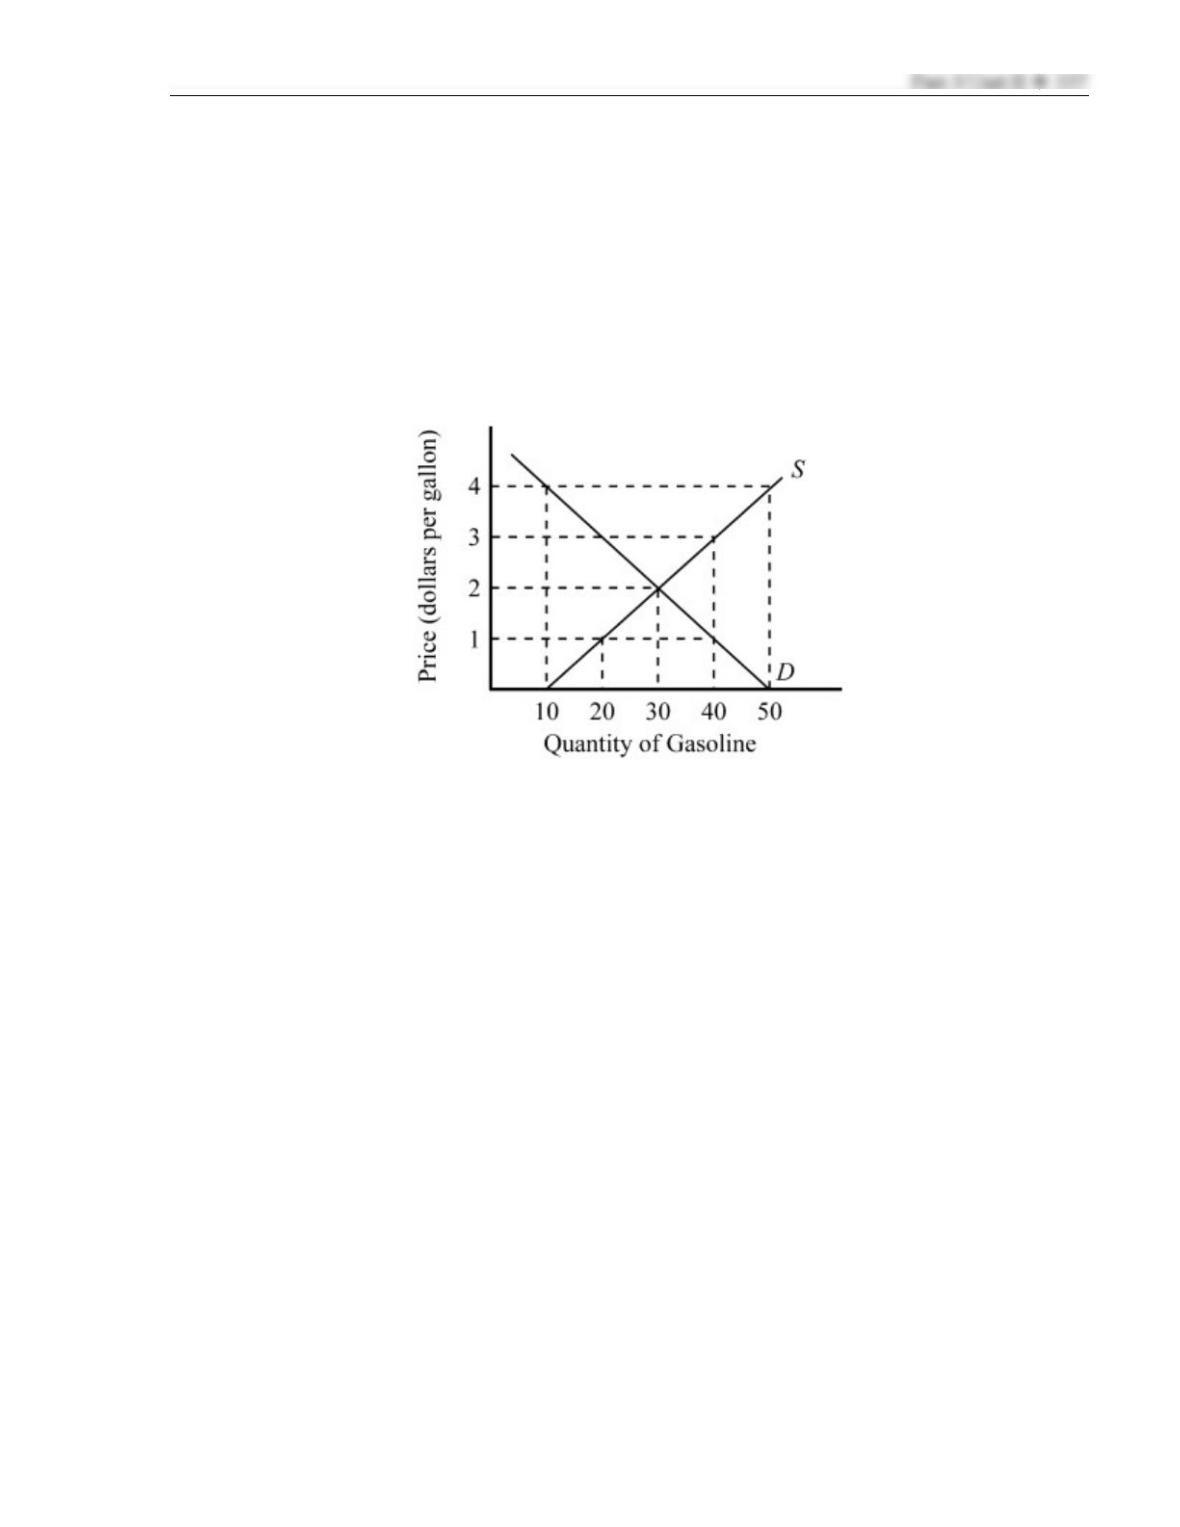
4. The graph in Figure 2 shows the initial demand for margarine at D1. An increase in the price of
butter (which is a substitute for margarine) would tend to cause which of the following
changes in the market for margarine?
(A) a shift in the demand curve from D1 to D2
(B) a shift in the demand curve from D2 to D1
(C) a movement along demand curve D1 from a to b
(D) a movement along demand curve D1 from b to a
(E) a shift in the curve coupled with a movement along the new curve
Use this graph when answering the next question.
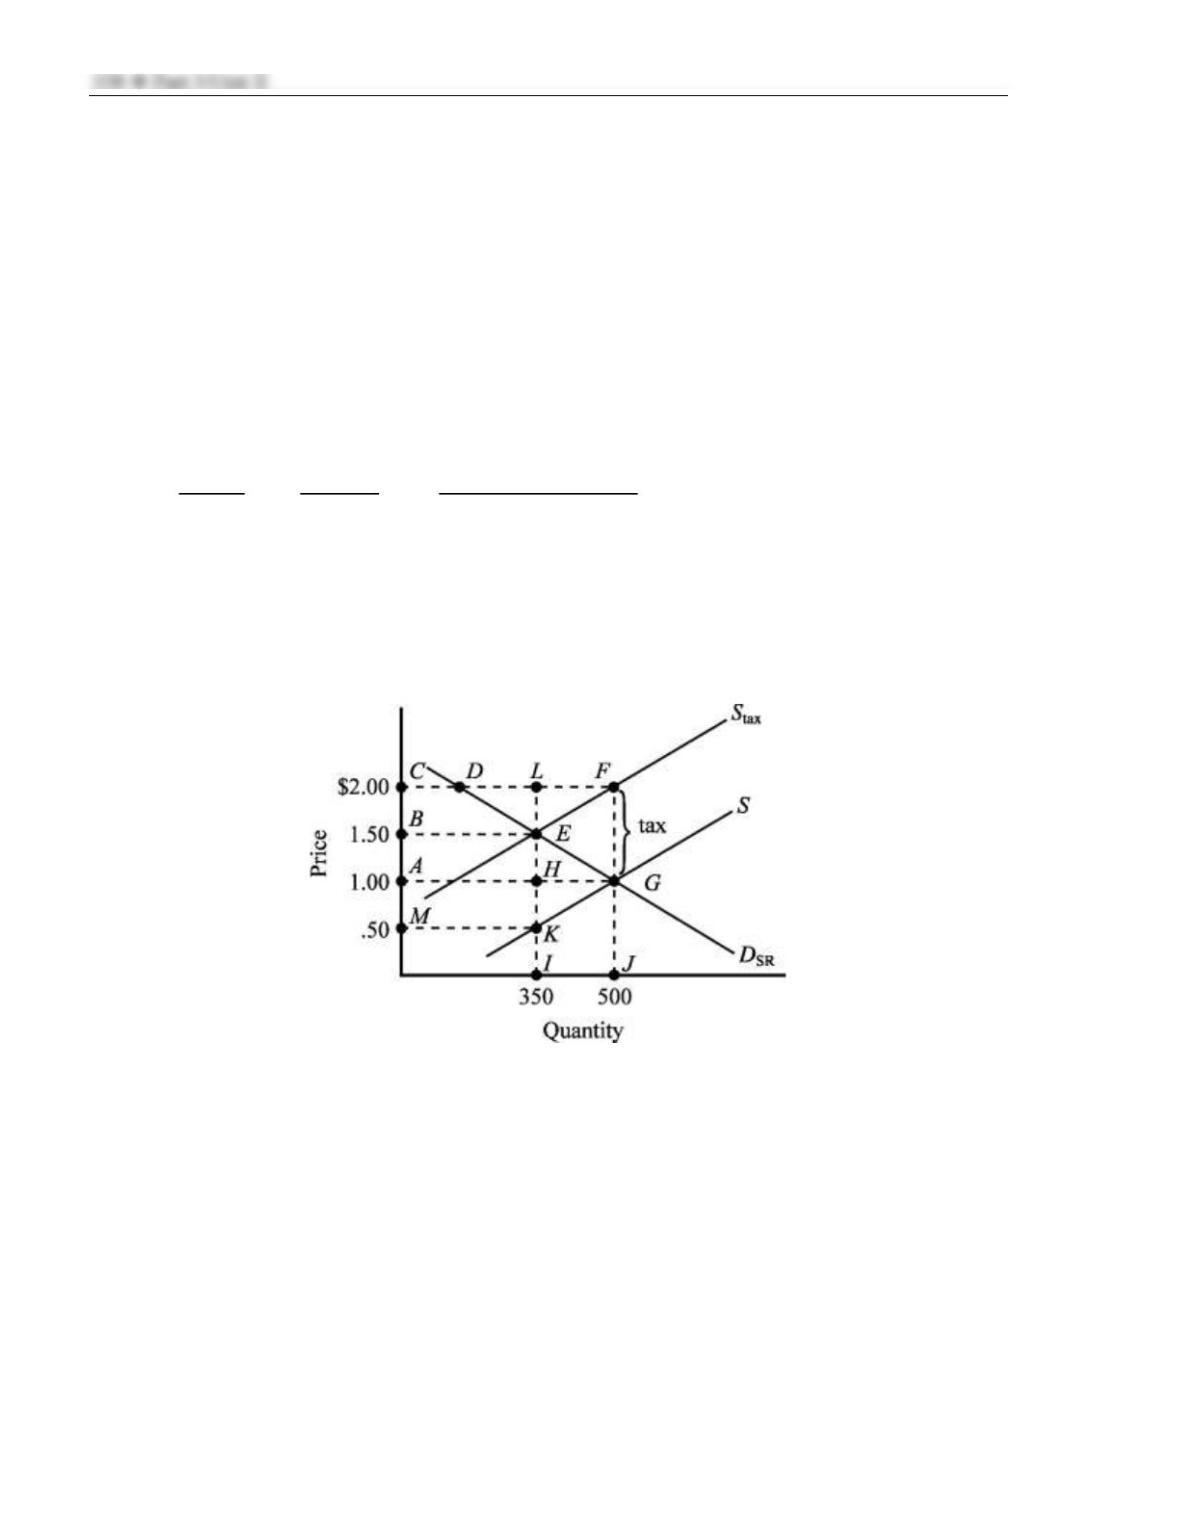
Figure 3
5. Given the demand (D) and supply (S) for gasoline in Figure 3, if the price of gasoline were $1
per gallon,
(A) a shortage of 40 gallons would exist.
(B) a shortage of 30 gallons would exist.
(C) a shortage of 20 gallons would exist.
(D) a surplus of 30 gallons would exist.
(E) a surplus of 20 gallons would exist.
6. As a result of the events of September 11, 2001, passengers became more reluctant to fly and
there was a substantial increase in air travel security. How did the increased fear of flying and
the higher cost of providing air travel security affect the market for air travel?
(A) Demand increased and supply decreased, causing the price of air travel to rise.
(B) Demand decreased and supply increased, causing a reduction in the price of air travel.
(C) Demand decreased and supply decreased, causing the price of air travel to fall.
(D) Demand increased, supply decreased, and therefore the net impact on the price of air
travel was uncertain.
(E) Demand decreased, supply decreased, and therefore the net impact on the price of air
travel was uncertain.
7. Which of the following occurs to demand, supply, and total revenues if a technological ad-
vance reduces the cost of producing DVD players that possesses an inelastic demand?
Supply Demand Equilibrium Quantity
(A) increase no change increase
(B) increase increase increase
(C) no change increase decrease
(D) decrease decrease decrease
(E) increase increase no change
Use Figure 4, illustrating the impact of an excise tax, to answer the following questions.
Figure 4
8. The amount of the excise tax is,
(A) $.50.
(B) $1.00.
(C) $1.50.
(D) $1.75.
(E) $2.00.

9. The amount of the actual tax burden paid by consumers and producers is
(A) $1.00 for consumers and $.50 for producers.
(B) $1.00 for consumers and $1.00 for producers.
(C) $.25 for consumers and $.75 for producers.
(D) $.75 for consumers and $.25 for producers
(E) $.50 for consumers and $.50 for producers.
10. The deadweight loss of the tax illustrated is given by the area
(A) ABEH.
(B) DFE.
(C) EKG.
(D) EFG.
(E) BEKM.
11. The revenue generated by the tax illustrated is given by the area
(A) ACLH.
(B) BEKM.
(C) ACFG.
(D) MCLK.
(E) EKG.
12. The fact that a gallon of bottled water commands a higher market price than a gallon of gaso-
line indicates that
(A) bottled water is an inferior good and gasoline is a normal good.
(B) the marginal utility of bottled water is greater than the marginal utility of a gallon of gas-
oline.
(C) the average utility of a gallon of bottled water is greater than the average utility of a gal-
lon of gasoline.
(D) the total utility of bottled water exceeds the total utility of gasoline.
(E) gasoline is an inferior good and bottled water is a normal good.
13. If the demand for a product increases as the result of a decline in income, it can be concluded
that the
(A) product is an inferior good.
(B) product is a superior good.
(C) demand for the product is inelastic.
(D) price elasticity of demand for the product equals unity.
(E) demand for the product is elastic.
14. All things equal, the price elasticity of supply
(A) will be greater in the short run than the long run.
(B) will be greater in the long run than the short run.
(C) is the same for the short run and the long run.
(D) approaches zero in the long run.
(E) is perfectly inelastic in the long run.
15. The graph in Figure 5 above depicts a demand curve with a price elasticity that is
(A) perfectly elastic, implying that consumers will purchase as much as can be supplied at the
market price.
(B) relatively inelastic, implying that a percent increase in price results in a smaller percent
reduction in sales.
(C) relatively elastic, implying that a percentage increase in price results in a larger percent-
age reduction in sales.
(D) unitary, implying that a percent change in price leads to an equal percent change in quan-
tity demanded.
(E) perfectly inelastic, implying that the same amount will be purchased regardless of the
price of the good.
16. (I) Private markets will tend to produce too little of a good that generates external costs from
the standpoint of economic efficiency.
(II) The market supply curve for a good that generates external costs will understate the true
social opportunity cost of production.
(III) Private markets will tend to produce too much of a good that generates external benefits
from the standpoint of economic efficiency.
(A) (I) is true; (II) is false; (III) is true.
(B) (I) is false; (II) is true; (III) is false.
(C) (I) is false; (II) is false; (III) is true.
(D) (I), (II), and (III) are true.
(E) (I), (II), and (III) are false.
17. What are the two distinguishing characteristics of a public good?
(A) non-rivalry in consumption and non-excludability
(B) indivisibility in production and excludability of nonpaying customers
(C) provision by government and funding through taxation
(D) mass production and comparative advantage
(E) public good exceeds public cost
Part 3/Unit II 341
Use this graph when answering the next question.
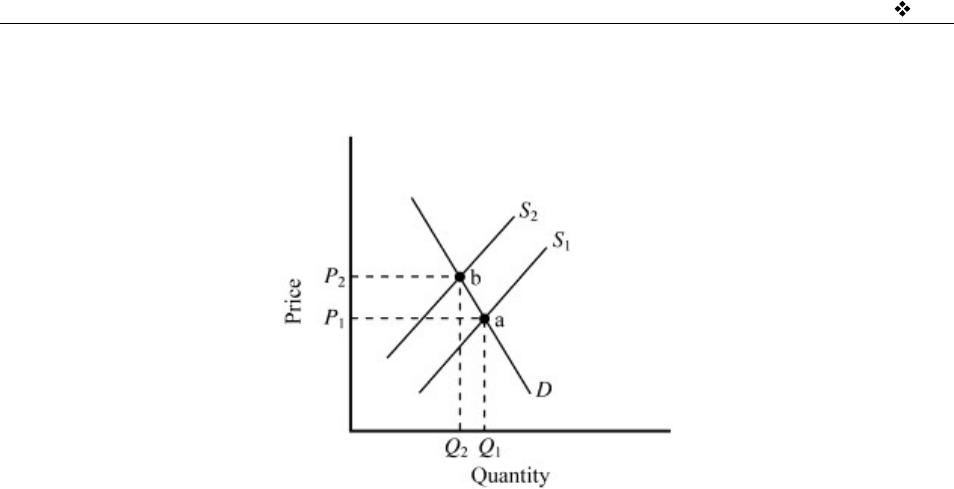
Figure 6
18. Figure 6 illustrates the market for a product that generates an externality. S1 is the private mar-
ket supply curve, while S2 is the supply curve including the externality. Which of the follow-
ing is true?
(A) Point a illustrates the competitive private market outcome while point b illustrates the
outcome consistent with economic efficiency for a negative externality.
(B) Point a illustrates the competitive private market outcome while point b illustrates the
outcome consistent with economic efficiency for a positive externality.
(C) Point b illustrates the competitive private market outcome while point a illustrates the
outcome consistent with economic efficiency for a negative externality.
(D) The competitive private market outcome is consistent with the conditions for economic
efficiency.
(E) The good will tend to be undersupplied relative to the conditions for economic efficiency.
19. When the consumption of a good generates an external benefit, then
(A) the private benefit consumers receive from the good will be higher than the true social
benefit.
(B) too much of the good will tend to be produced from the viewpoint of economic effi-
ciency.
(C) the community generally suffers an exactly offsetting external cost from the production
of the good.
(D) the market demand curve will understate the total benefits derived from consumption of
the good and as a result too little of it will be produced and consumed.
(E) the market demand curve will overstate the total benefits derived from consumption of
the good and as a result too much of it will be produced and consumed.
20. Which of the following is the best example of a public good?
(A) long-distance telephone service
(B) national defense
(C) an amusement park
(D) the electric service of a public utility
(E) taking this test
342 Part 3/Unit II
Answers to Multiple-Choice Sample Questions for Micro Unit II
Sample Free–Response Question for Micro Unit II
1. Using a correctly labeled graph of the supply of and the demand for ice cream, demonstrate
each of the following:
(A) the equilibrium price of ice cream.
(B) the equilibrium quantity of ice cream.
(C) the imposition of an effective price ceiling on ice cream by the government.
(D) the effect of a decrease in the cost of producing cream (an ingredient in ice cream).
(E) the effect of a decrease in the price of cookies (a complimentary good for ice cream).
Answers to Free-Response Sample Question for Micro Unit II
This question would be graded using an 8 point rubric.
1. One point for a correctly labeled supply and demand graph with price on the vertical axis and
quantity on the horizontal axis
One point for an upward-sloping supply curve