396 Part 3/ Microeconomics Examination
Advancement Placement Level Microeconomics
Examination
1. A production possibility curve might be shifted outward by each of the following EXCEPT
(A) an increase in immigration.
(B) a movement toward a more open approach to free trade.
(C) a decrease in unemployment.
(D) an increase in educational levels of the general population.
(E) All of the above would shift the PPC outward.
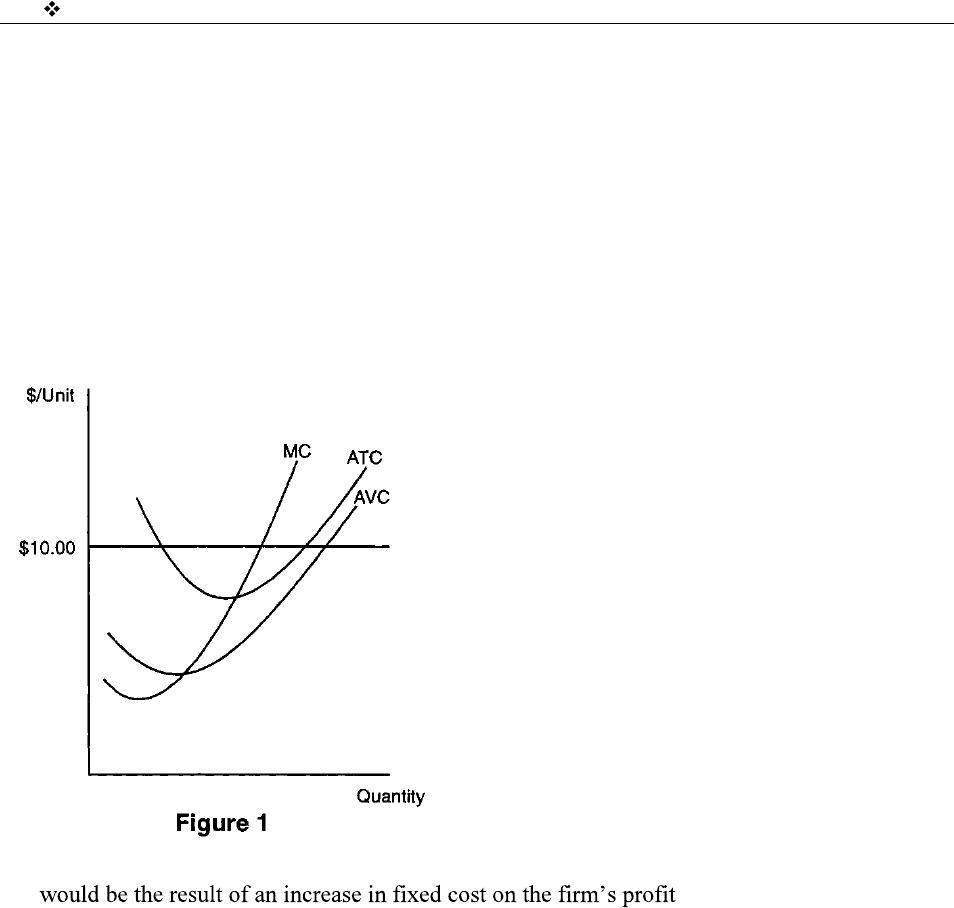
2. If the current price for the perfectly competitive firm represented in Figure 1 is $10.00, what
maximizing price, quantity,
and profits?
(A) price increase, quantity increase, and profit increase
(B) price increase, quantity decrease, and profit increase
(C) price constant, quantity constant, and profit decrease
(D) price decrease, quantity decrease, and profit decrease
(E) price decrease, quantity increase, and profit decrease
Part 3/Microeconomics Examination 397
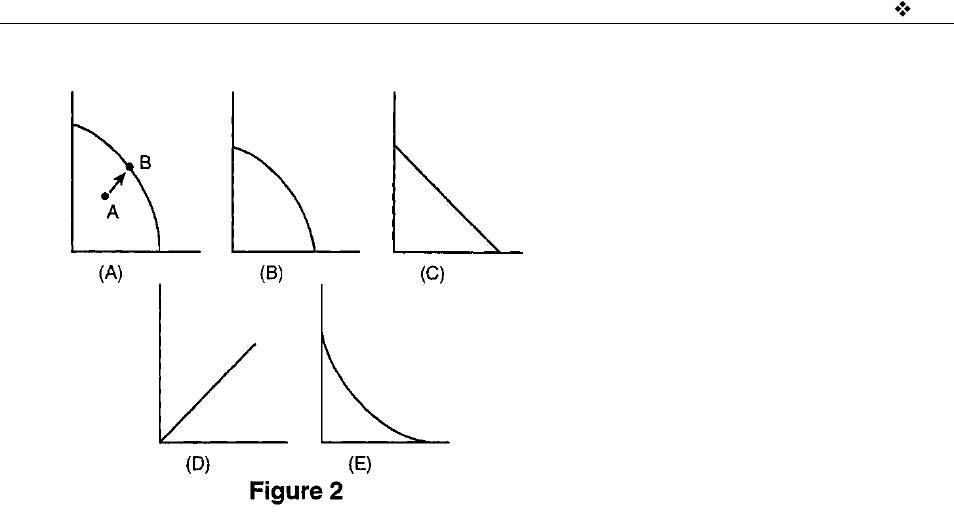
3. Which of the graphs shown in Figure 2 correctly demonstrates the concept of constant oppor-
tunity cost?
(A) A
(B) B
(C) C
(D) D
(E) E
398 Part 3/ Microeconomics Examination
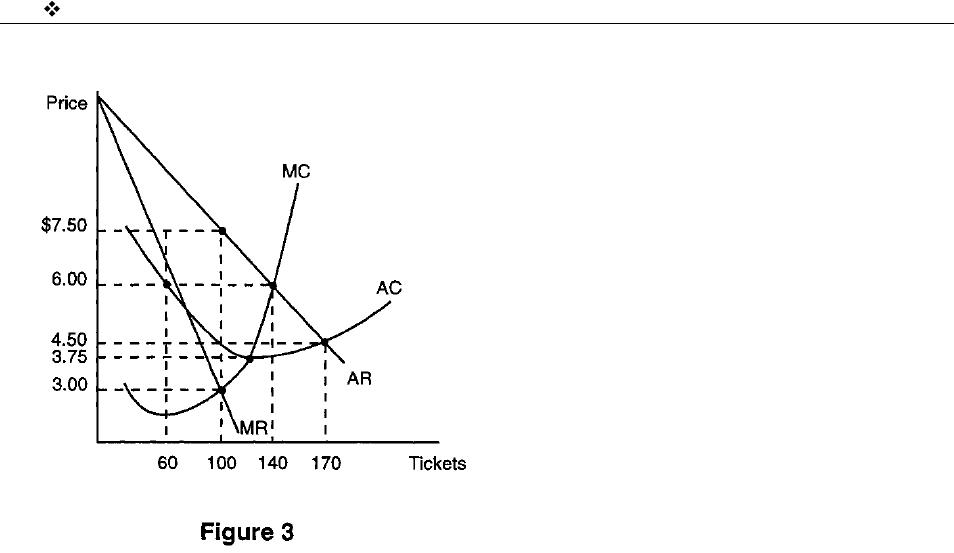
4. Chasey Company Inc. is the only producer in a small town. Cost and revenue information for
the Chasey Company are shown in Figure 3. Chasey Company would set the price of its prod-
uct at
(A) $7.50
(B) $6.00
(C) $4.50
(D) $3.75
(E) $3.00
5. In Figure 3, the Chasey Company would maximize profits by producing a quantity of
(A) 60
(B) 100
(C) 120
(D) 140
(E) 170
6. In Figure 3, the Chasey Company will make a profit of
(A) $750
(B) $450
(C) $300
(D) $150
(E) $150 less
Part 3/Microeconomics Examination 399
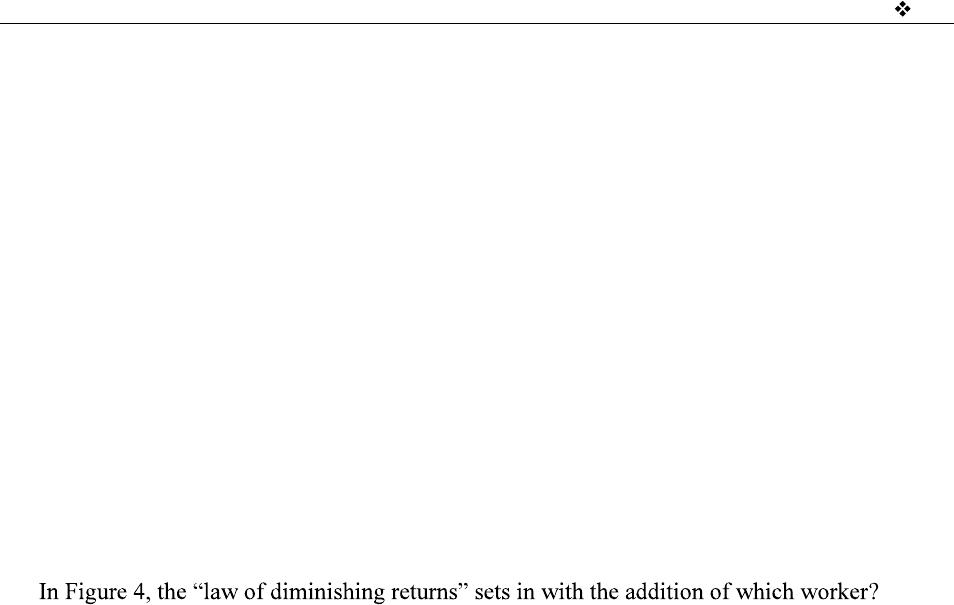
Figure 4
Number of Workers Output
0 0
1 5
2 11
3 19
4 25
5 29
6 31
7 31
8 30
7. Figure 4 represents production data for a perfectly competitive firm. Based on that data, the
marginal physical product of the fourth worker is
(A) 4
(B) 6
(C) 8
(D) 25
(E) 60
8.
(A) 1st
(B) 2nd
(C) 4th
(D) 7th
(E) 8th
9. Using the data in Figure 4, if workers are paid $35 and the product being produced sells for
$10, how many workers would the Chasey Company hire?
(A) 1
(B) 4
(C) 5
(D) 7
(E) 8
400 Part 3/ Microeconomics Examination
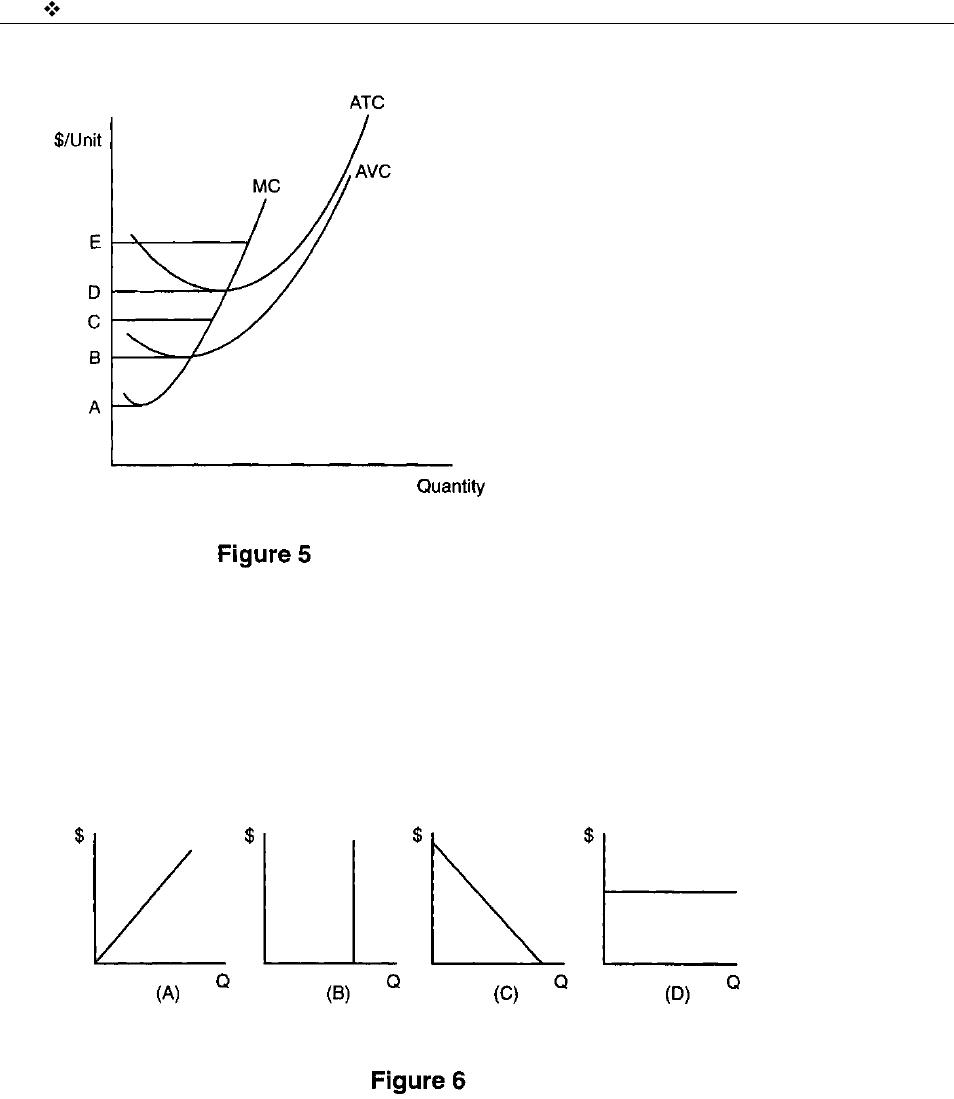
10. The profit maximizing price for a perfectly competitive firm like the one shown in Figure 5 in
the long run would be at point
(A) A.
(B) B.
(C) C.
(D) D.
(E) E.
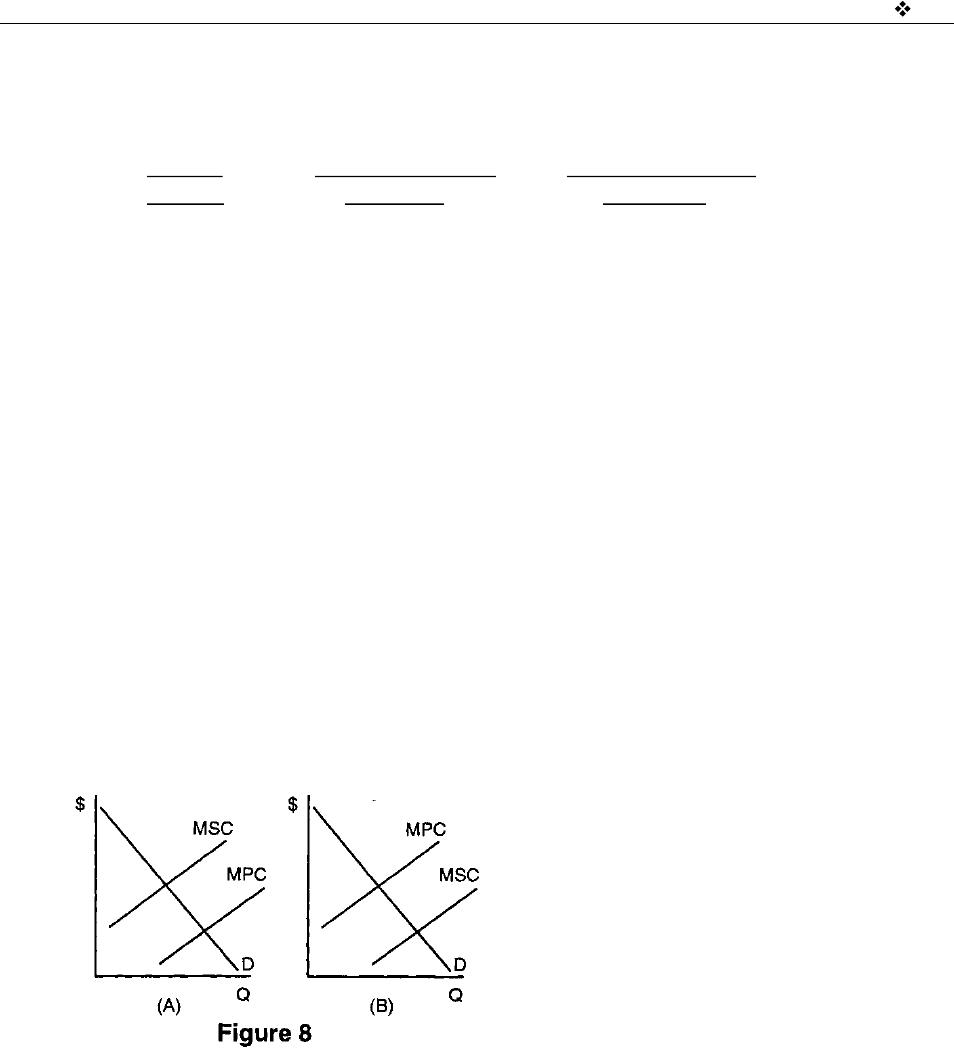
11. Which of the graphs in Figure 6 indicates that a firm can sell any or all of its output at the pre-
vailing market price?
(A) A
(B) B
(C) C
(D) D
(E) It is impossible to determine the correct answer to the question from the information
given.
Part 3/Microeconomics Examination 401
Figure 7
Assume that the following information is for Good A.
Price of Income of Good A Quantity demanded
Good A Consumer of Good A
$5.00 200 20
$4.00 175 40
$3.00 150 60
$2.00 125 90
1.00 100 100
12. In the $3.00 to $4.00 price range, we can accurately conclude that, based on the information in
Figure 7,
(A) demand is inelastic and total revenue increased.
(B) demand is inelastic and total revenue decreased.
(C) demand is elastic and total revenue increased.
(D) demand is elastic and total revenue decreased.
(E) demand is unit elastic and total revenue remained constant.
13. Based on the information in Figure 7, it can be correctly concluded that good A is
(A) a normal good.
(B) an inferior good.
(C) a Giffen good.
(D) a good with a positive externality.
(E) a good with a negative externality.
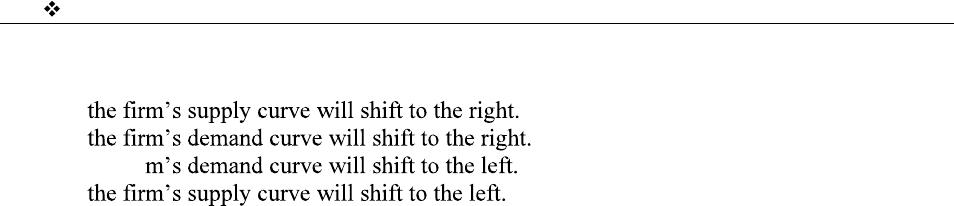
14. Given that MSC is marginal social cost and MPC is marginal private cost, based on the two
graphs in Figure 8, it can be correctly concluded that
(A) both graphs demonstrate the existence of externalities.
(B) both graphs demonstrate the existence of negative externalities.
(C) both graphs demonstrate the existence of positive externalities.
(D) graph A demonstrates inefficiency through underproduction.
(E) graph B demonstrates inefficiency through overproduction.
402 Part 3/ Microeconomics Examination
15. If a natural disaster occurs that adversely affects production and shipping,
(A)
(B)
(C) the fir
(D)
(E) Neither curve will shift, but instead movement will be along each curve.
16. If supply and demand both increase, we can correctly conclude that
I. equilibrium price will rise.
II. equilibrium price is indeterminate.
III. equilibrium quantity will rise.
IV. equilibrium quantity is indeterminate.
(A) I only
(B) I and II only
(C) II and IV only
(D) II and III only
(E) IV only
17. Market-based economies allocate resources in which of the following ways?
I. Established customs and traditions decide which goods and services will be produced.
II. Voluntary exchange determines which goods and services get produced.
III. Government determined prices help producers allocate scarce resources.
(A) I only
(B) II only
(C) III only
(D) I and II only
(E) II and III only
18. If an increase in the price of one good increases the demand for another good, then these two
goods are
(A) regular goods.
(B) substitute goods.
(C) public goods.
(D) complementary goods.
(E) independent goods.
19. When graphed, the distance between average variable cost and average total cost is
(A) equal to marginal cost at all levels of output.
(B) equal to total fixed cost at all levels of output.
(C) equal to average fixed cost at all levels of output.
(D) equal to zero at all levels of output.
(E) the same at all levels of output.
20. Game theory and price leadership are explanations for the profit-maximizing behavior of a
firm under which of the following market structures?
(A) pure monopoly
(B) oligopoly
(C) monopolistic competition
(D) perfect competition
(E) all of the above market structures
Part 3/Microeconomics Examination 403
21. If your insurance company informed you that your insurance premium had been increased,
what effect would this have on your business?
Average Variable Cost Average Fixed Cost Marginal Cost
(A) no change no change no change
(B) no change increase no change
(C) increase increase no change
(D) increase increase increase
(E) no change increase increase
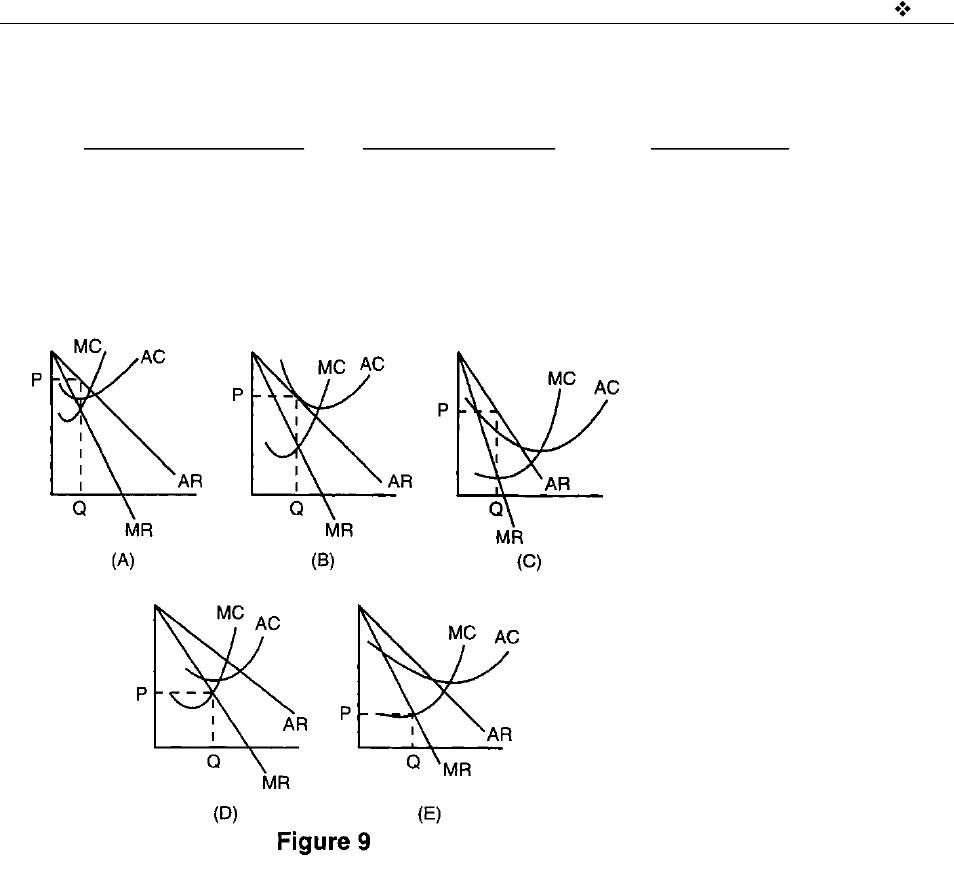
22. Which graph in Figure 9 shows the long-run profit maximizing position for a monopolistic
competitor?
(A) A
(B) B
(C) C
(D) D
(E) E
23. Which of the following embodies most of the principles of a pure public good?
(A) taking the Advanced Placement economics examination
(B) street lights
(C) a new car
(D) a new economics book
(E) all of the above
404 Part 3/ Microeconomics Examination
24. Which of the following is a progressive tax?
(A) Every taxpayer pays $10.00.
(B) Every taxpayer pays 10% of his/her income.
(C) Higher income taxpayers pay a higher percentage of their income in tax.
(D) Higher income taxpayers pay a lower percentage of their income in tax.
(E) None of the above correctly describes a progressive tax.
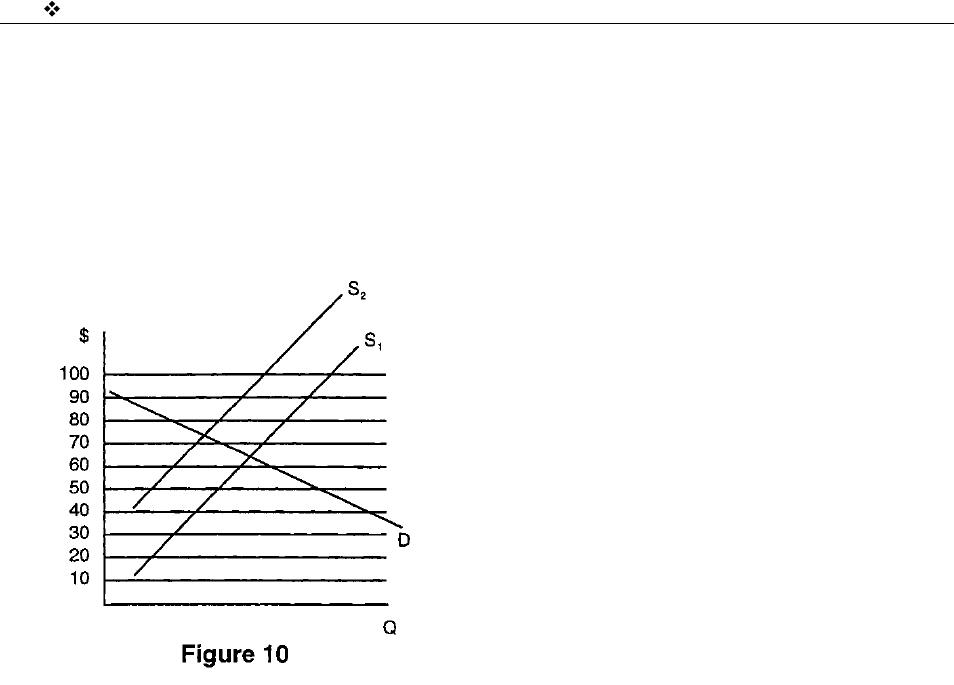
25. Based on Figure 10, if S1 represents supply before the imposition of an excise tax and S2 rep-
resents supply after the tax is imposed, how much is the tax?
(A) 10
(B) 14
(C) 30
(D) 64
(E) 78
26. The burden (or incidence) of the tax in Figure 10 would be borne
(A) by producers entirely.
(B) by consumers entirely.
(C) equally by producers and consumers.
(D) more by producers than consumers.
(E) more by consumer than producers.
27. The model of consumer behavior can explain the downward slope of a demand curve with
each of the following EXCEPT
(A) substitution effect.
(B) complement effect.
(C) income effect.
(D) diminishing marginal utility.
(E) All of the above are used to explain consumer behavior.
Part 3/Microeconomics Examination 405
28. Which of the following combinations would definitely raise the equilibrium price of a good?
(A) higher cost of the raw materials and an increase in the popularity of the product
(B) higher cost of the raw materials and a reduction in the popularity of the product
(C) lower cost of the raw materials and an increase in popularity of the product
(D) lower cost of the raw materials and a reduction in the popularity of the product
(E) higher cost of the raw materials and a reduction in the price of a substitute good
29. If one firm in a perfectly competitive industry experiences a technological breakthrough that
uantity, and profit?
Price Quantity Profit
(A) decrease decrease decrease
(B) decrease increase increase
(C) no change decrease increase
(D) no change increase increase
(E) increase increase increase
30. In which of the following combinations would a $10 increase in per unit cost result in the larg-
est decrease in the equilibrium quantity?
(A) inelastic demand, inelastic supply
(B) inelastic demand, elastic supply
(C) elastic demand, elastic supply
(D) elastic demand, inelastic supply
(E) None of these choices would influence the equilibrium quantity.
31. In the factor market, which of the following would happen if the workers became more pro-
ductive and at the same time the price of the product fell?
(A) The value of the marginal product of labor would increase.
(B) The value of the marginal product of labor would decrease.
(C) The value of the marginal product of labor would be indeterminate.
(D) The demand for labor would shift to the right.
(E) The demand for labor would shift to the left.
32. Which of the following would shift the demand for a good to the right?
(A) a decrease in the cost of production
(B) a decrease in the price of the good
(C) an increase in the price of the good
(D) the introduction into the market of many similar products
(E) the removal from the market of many similar products
33. Which of the following would shift the supply of a good to the left?
(A) an increase in the cost of production
(B) a decrease in the cost of production
(C) an increase in the price
(D) a decrease in the price
(E) a decrease in demand
406 Part 3/ Microeconomics Examination
34. Which of the following would lead to a reduction in consumer surplus?
(A) imposition of an effective price floor
(B) imposition of an effective price ceiling
(C) an increase in supply
(D) an increase in demand
(E) All of the above would contribute to a reduction in consumer surplus.
35.
mel corn, increases in price by 10 percent. Which of the following correctly describes the ef-
(A) Only marginal cost will increase.
(B) Only marginal cost and average total cost will increase.
(C) Marginal cost, average variable cost, and average total cost will increase.
(D) Marginal cost, average total cost, and average fixed cost will increase.
(E) Marginal cost, average variable cost, average total cost, and average fixed cost will in-
crease.
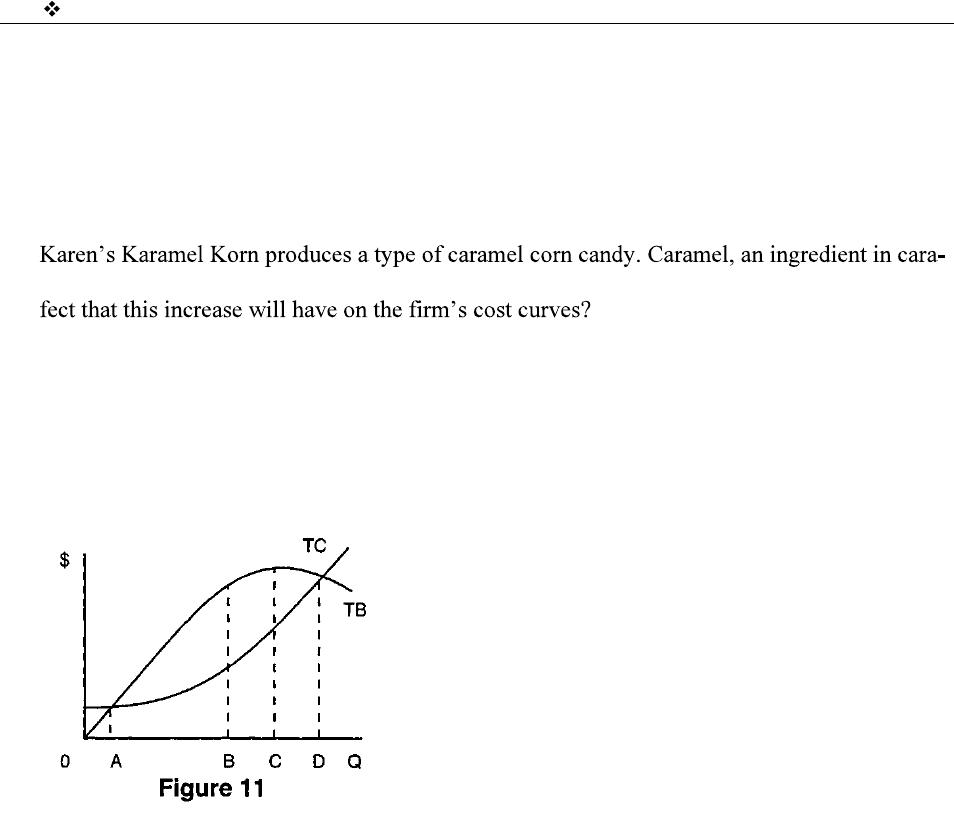
36. Government provides many goods and services to the public because those goods and services
are not provided by free markets. Some economists believe bureaucrats who manage the pro-
grams have no interest in maximizing net benefits, but instead maximize the size of a program
constrained only by the need to have total benefits greater than, or equal to, total cost. Fig-
ure 11 shows total benefits and cost curves for a program. What point is the efficient point,
and what point will the bureaucrat choose?
(A) 0A, 0B
(B) 0A, 0C
(C) 0B, 0D
(D) 0D, 0C
(E) 0D, 0A

Part 3/Microeconomics Examination 407
Units of Labor
1 2 3 4 5 6
6 346 490 600 692 775 846
5 316 448 548 632 705 775
4 282 400 480 564 632 692
Units of 3 245 346 423 490 548 600
Capital 2 200 282 346 400 448 490
1 141 200 245 282 316 346
37. The table above indicates the units of output associated with the use of various combinations
of labor and capital. This production process is characterized by
(A) decreasing returns to scale.
(B) constant returns to scale.
(C) increasing returns to scale.
(D) increasing returns to labor.
(E) constant returns to labor.
38. A firm uses workers and seed to grow lettuce. Its output rises from 100 tons to 200 tons when
the number of workers increases from 25 to 75. Its production process shows
(A) decreasing returns to scale.
(B) diminishing returns to labor.
(C) increasing returns to scale.
(D) increasing returns to labor.
(E) increasing long-run average cost.
39. Setting an effective price floor would
(A) increase consumer surplus and increase producer surplus.
(B) increase consumer surplus and decrease producer surplus.
(C) decrease consumer surplus and decrease producer surplus.
(D) decrease consumer surplus and increase producer surplus.
(E) leave both consumer and producer surplus unaffected.
40. Economists tend to see ticket scalping as
(A) a way for a few to profit while producing nothing of value.
(B) an inequitable interference in the orderly process of ticket distribution.
(C) a way of increasing the efficiency of ticket distribution.
(D) an unproductive activity that should be made illegal everywhere.
(E) a way of decreasing the efficiency of ticket distribution.
408 Part 3/ Microeconomics Examination
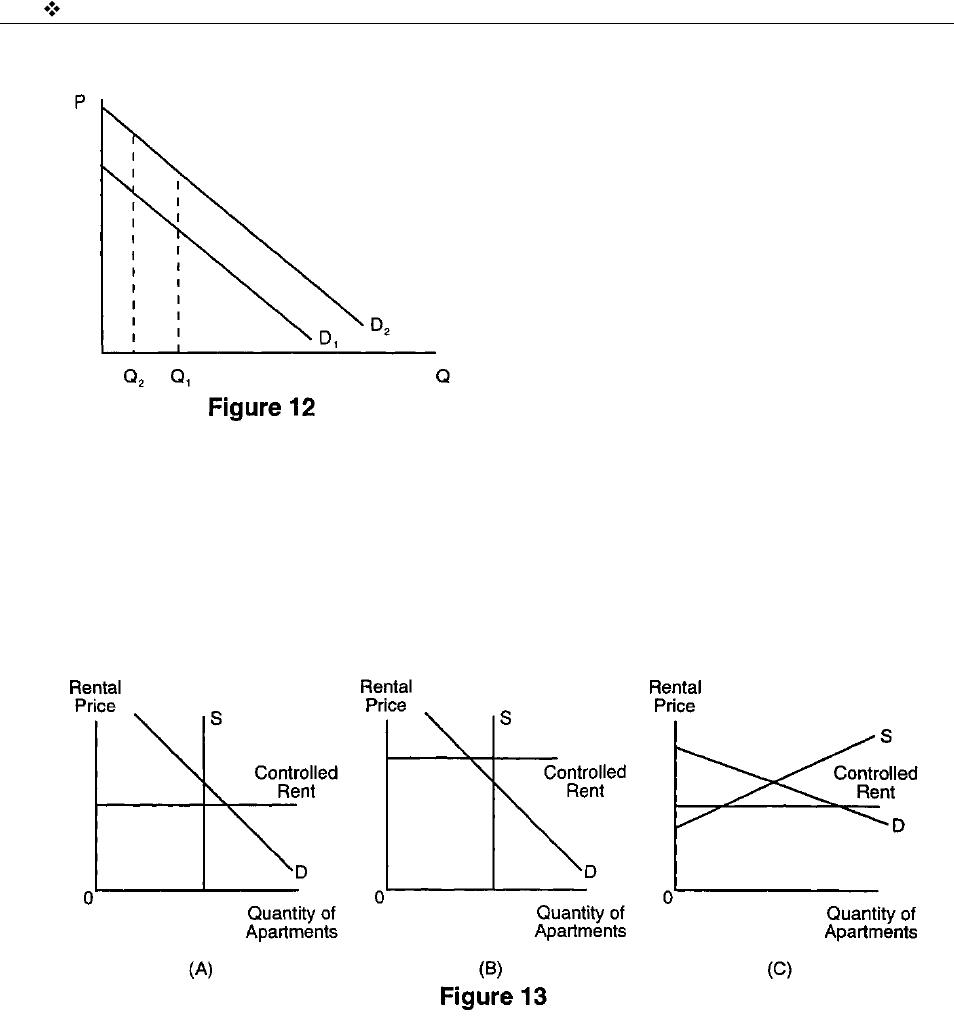
41. Refer to Figure 12. Given the information represented by the graph we can say that
(A) D1 is more price sensitive over the given output range than D2.
(B) both demand curves have the same price elasticities over the given output range.
(C) D2 is more price sensitive over the given output range than D1.
(D) elasticities cannot be determined over the given output range without supply information.
(E) elasticities cannot be determined over the given output range without price information
being given.
42. In Figure 13, which panel(s) best represent(s) a binding rent control in the immediate time pe-
riod?
(A) A
(B) B
(C) C
(D) B and C
(E) All of the panels
Part 3/Microeconomics Examination 409
43. There are two generally recognized measures of economic efficiency; one measures efficiency
from a production perspective and the other measures efficiency from an allocation perspec-
tive. Which of the following correctly states these two measures of efficiency, and in the or-
der mentioned in the question?
(A) P = minimum ATC, and P = AR
(B) P = minimum ATC, and P = MC
(C) P = MC, and MC = MR
(D) P = MC, and P = AR
(E) MC = MR, and MRP = VMP
44. The profit-maximizing level of production in the product market, and the profit-maximizing
level of employing resources in the factor market are represented by which of the following
combinations?
(A) MC = MR and MRP = MRC
(B) MRP = MRC and MC = MR
(C) P = MC and P = MR
(D) P = MR and P = MC
(E) P = minimum ATC and P = MC
Figure 14
Quantity Average Average Marginal
of output variable cost total cost cost
0
1 50 250 50
2 45 145 40
3 41.7 108.4 35
4 40 90 35
5 40 80 40
6 40.8 74.1 45
7 42.1 70.7 50
8 44.3 69.3 60
45. Refer to Figure 14. The average fixed cost of producing 4 units of output is
(A) 50.
(B) 40.
(C) 50.
(D) 90.
(E) 200.
46. Refer to Figure 14. If the product price is $47.00, to maximize profits this firm will produce
(A) zero; the firm will lose money by producing any level of output.
(B) zero in the short run, but 6 in the long run.
(C) zero in the long run, but 6 in the short run .
(D) 1 in the short run, but 7 in the long run.
(E) 7 in the long run, but 1 in the short run.
410 Part 3/ Microeconomics Examination
47. Refer to Figure 14. If fixed costs increase by 100, what will happen to each of the following?
Average Average Marginal
Variable Cost Total Cost Cost
(A) increase increase increase
(B) increase increase no change
(C) no change increase increase
(D) no change increase no change
(E) no change no change increase
48. A price discriminating monopolist would differ from a non-price discriminating monopolist in
which of the following ways?
Profit Consumer surplus
(A) higher with price discrimination higher with price discrimination
(B) higher with price discrimination lower with price discrimination
(C) lower with price discrimination lower with price discrimination
(D) lower with price discrimination higher with price discrimination
(E) the same with both the same with both
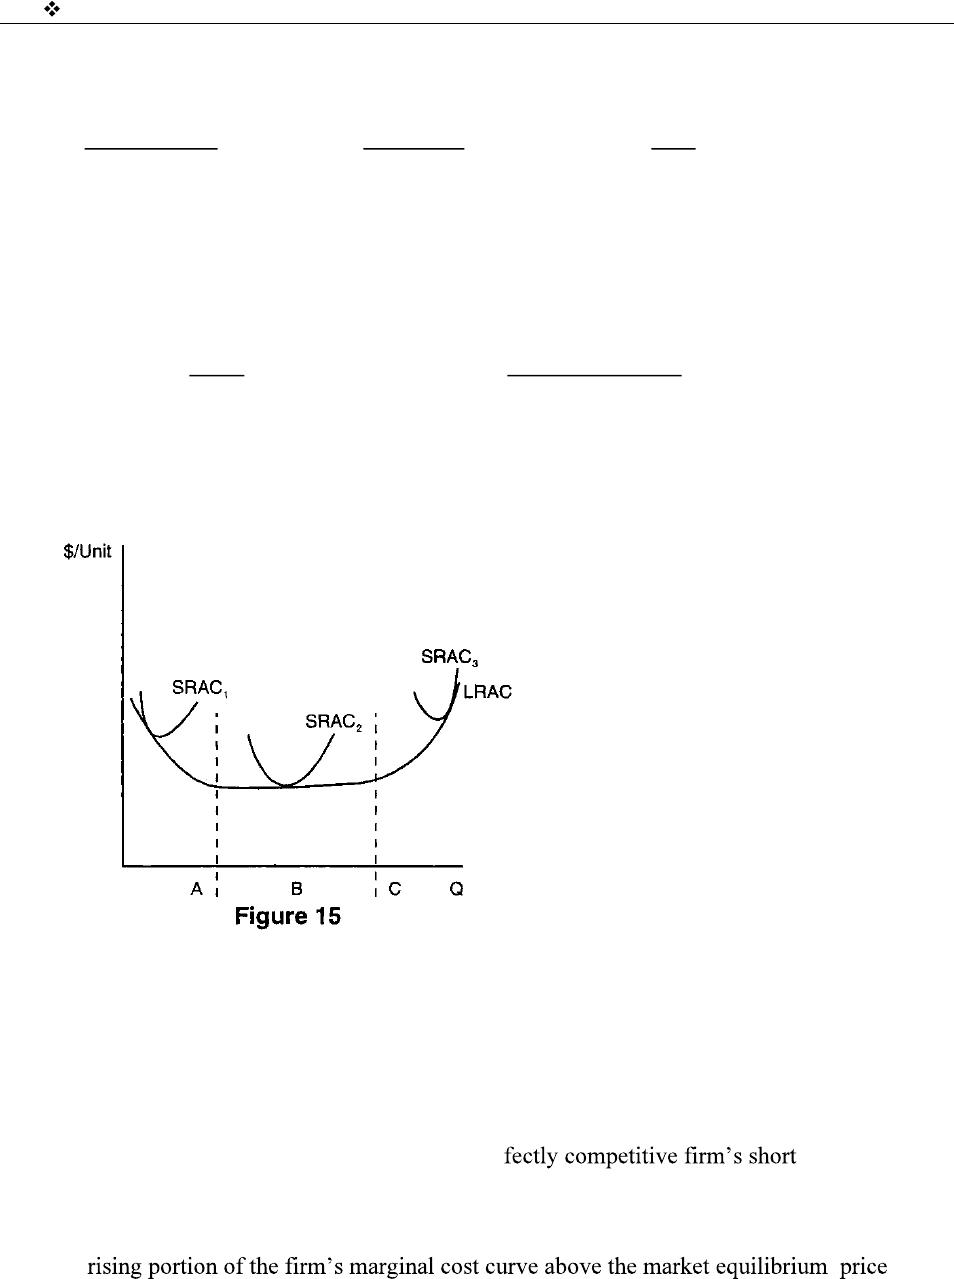
49. Figure 15 shows short-run and long-run average total cost curves. Section A, B, and C respec-
tively demonstrate
(A) economies of scale, diseconomies of scale, constant returns to scale.
(B) economies of scale, constant returns to scale, diseconomies of scale.
(C) diseconomies of scale, constant returns to scale, economies of scale.
(D) diseconomies of scale, economies of scale, constant returns to scale.
(E) constant returns to scale, economies of scale, diseconomies of scale.
50. Which of the following correctly describes a per -run supply
curve?
(A) marginal cost curve
(B) rising portion of the average total cost curve
(C)
(D) rising portion of the marginal cost curve above average variable cost
(E) rising portion of the marginal cost curve above average total cost
Part 3/Microeconomics Examination 411
51. Under conditions of imperfect competition, which of the following is true for a profit-maxim-
izing firm?
(A) price > marginal revenue
(B) marginal revenue > average revenue
(C) average revenue > price
(D) average revenue < price
(E) average revenue = marginal revenue
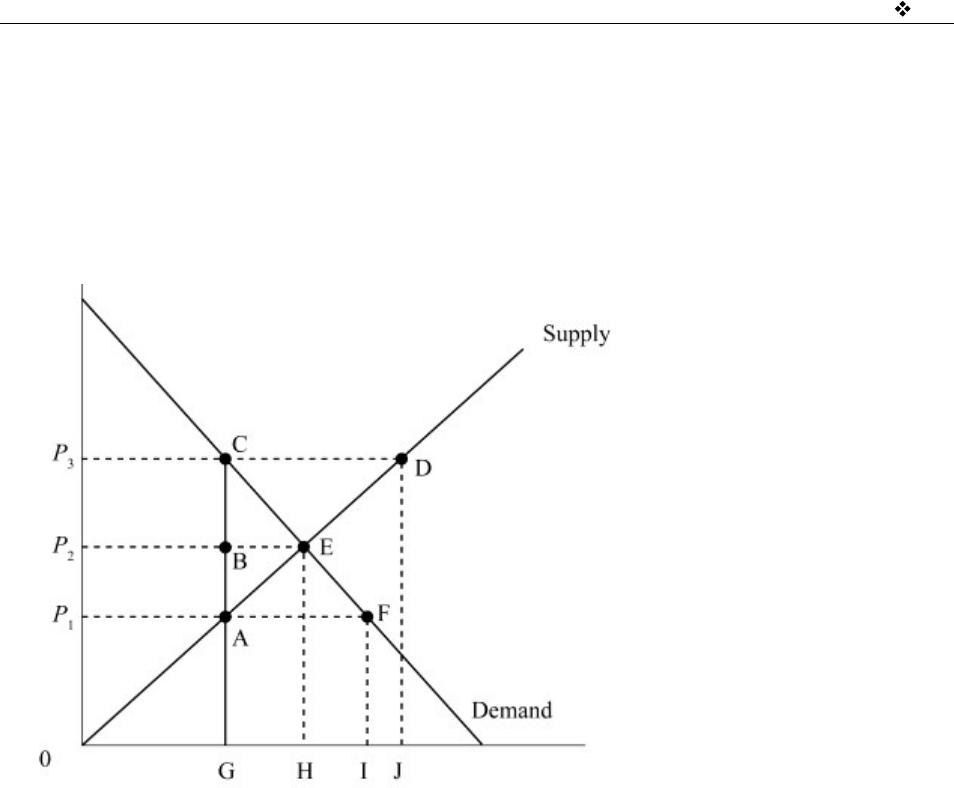
Figure 16
52. Based on the information in Figure 16, the effect of setting a price ceiling at P1 would be
(A) an actual price of P1, and an efficiency loss of A,C,E.
(B) an actual price of P1, and an efficiency gain of A,C,E.
(C) an actual price of P3, and an efficiency loss of A,C,E.
(D) an actual price of P3, and an efficiency gain of A,C,E.
(E) an actual price of P2, because a ceiling price is non-binding if set below equilibrium.
53. Based on the information in Figure 16, the total surplus resulting from the market equilibrium
price would be shown by the area
(A) O, E, K.
(B) O, P2, E.
(C) P2, K, E.
(D) A, C, E.
(E) P1, P3, C, A.
412 Part 3/ Microeconomics Examination
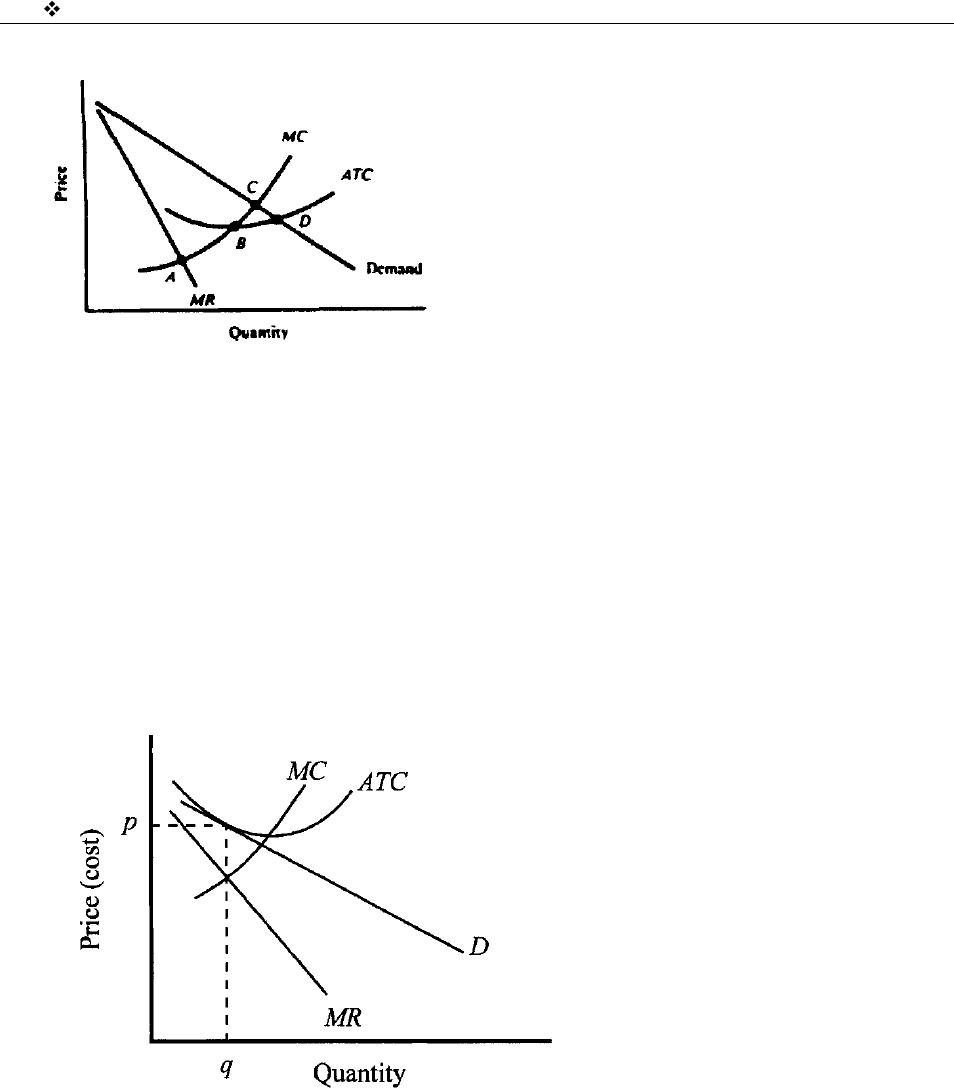
Figure 17
54. Figure 17 indicates the cost and demand conditions of a pure monopoly. Which of the follow-
ing is true?
(A) From the viewpoint of economic efficiency, the output implied by point A is best, but a
profit-maximizing monopolist will choose the output associated with D.
(B) From the viewpoint of economic efficiency, the output implied by point C is best, but a
profit-maximizing monopolist will choose the output associated with A.
(C) From the viewpoint of economic efficiency, the output implied by point C is best, but a
profit-maximizing monopolist will choose the output associated with B.
D) From the viewpoint of economic efficiency, the output implied by point D is best, but a
profit-maximizing monopolist will choose the output associated with A.
(E) From the viewpoint of economic efficiency, the output implied by point B is best, but a
profit-maximizing monopolist will choose the output associated with A.
Figure 18
55. Given the long-run cost and demand conditions shown in Figure 18, it can be accurately con-
cluded that this figure is for
(A) a monopoly firm making long-run economic profits.
(B) a perfectly competitive long-run equilibrium.
(C) a market in which we will see some firms exit the industry.
(D) a market in which we will see no new entry or exit of firms.
(E) a market in which we will see some firms enter the industry.
Part 3/Microeconomics Examination 413
56. A natural monopoly is a market where
(A) a single firm has control over a vital natural resource.
(B) a single firm has control over the market because of a patent.
(C) many smaller firms can produce the entire market output at the same per-unit cost as
could one large firm.
(D) a single large firm can produce the entire market output at a lower per-unit cost than a
group of smaller firms.
(E) many smaller firms can produce the entire market output at a lower per-unit cost than
could one large firm.
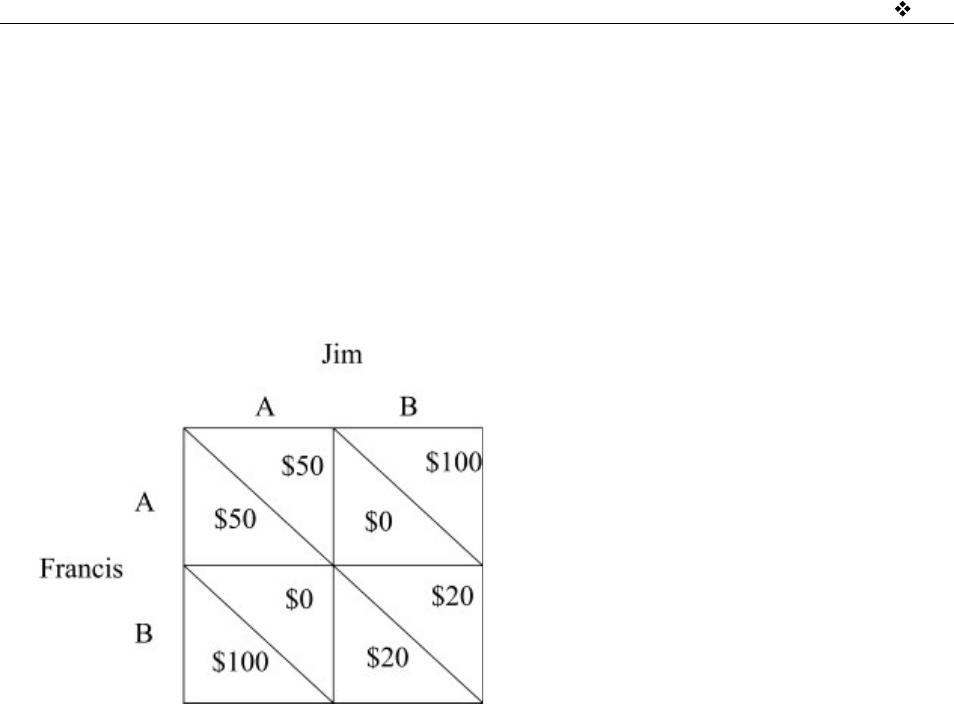
Figure 19
57. Based on the information in Figure 19,
(A) Jim and Francis both have a dominant strategy.
(B) Jim has a dominant strategy and Francis has a non-dominant strategy.
(C) Francis has a dominant strategy and Jim has a non-dominant strategy.
(D) Jim and Francis both have a non-dominant strategy.
(E) Jim has a single price strategy and Francis has a price discriminating strategy.
58. Based on the information in Figure 19, in the absence of collusion which of the following will
result?
(A) Jim and Francis will each make $50 by pursuing strategy A.
(B) Jim and Francis will each make $50 by pursuing strategy B.
(C) Jim and Francis will each make $20 by pursuing strategy A.
(D) Jim and Francis will each make $20 by pursuing strategy B.
(E) Neither Jim nor Francis will be able to make a profit unless they collude.
59. Which of the following is FALSE for a monopolistic competitor in long-run equilibrium?
(A) Like a monopolist, they maximize profits at MC=MR.
(B) Like a perfect competitor, they break even.
(C) Like a perfect competitor, they maximize profits at MC=MR.
(D) Like a perfect competitor, they achieve allocative efficiency.
(E) Like a monopolist, their MR curve lies below their AR curve when graphed.

414 Part 3/ Microeconomics Examination
60. Product differentiation, relatively high barriers to entry, and interdependent pricing decisions
are characteristics of which of the following market structures?
(A) single price monopoly
(B) price discriminating monopoly
(C) oligopoly
(D) monopolistic competition
(E) perfect competition
Part 3/Microeconomics Examination 415
Advancement Placement Level
Microeconomics Examination
Answers
1. C
21. B
41. C