
Chapter 9
The IS Curve
◼ Chapter Outline, Overview, and Teaching Tips
Chapter Outline
Planned Expenditure
The Components of Expenditure
Consumption Expenditure
Goods Market Equilibrium
Solving for Goods Market Equilibrium
Deriving the IS Curve
Understanding the IS Curve
Factors That Shift the IS Curve
Changes in Government Purchases
Application: The Vietnam War Buildup, 1964–1969
Changes in Taxes
Chapter Overview and Teaching Tips
This chapter introduces the basic concept of aggregate demand and develops one of the key building
blocks of the AD/AS model, the IS curve. The framework here is pretty conventional, first outlining the
components of planned expenditure—consumption expenditure, planned investment spending,
government purchases and net exports. Then the chapter goes into detail about goods market equilibrium,
when planned equals actual expenditure, and shows how this equilibrium generates the IS curve, the
relationship between the real interest rate and equilibrium output. Spending a fair amount of time in class

90 Mishkin • Macroeconomics: Policy and Practice, Second Edition
The chapter then goes on to provide a deeper understanding of the IS curve by giving the intuition behind
it, using a numerical example to explain it with mathematics and then showing the relationship between
the IS curve and the saving-investment diagram students were exposed to in Chapter 4. Then the chapter
One teaching device that I have found helps students develop their intuition is the use of summary tables
such as Table 9.1 in class. You can use the blackboard to write a list of changes in variables that shift the
◼ Answers to End of Chapter Review Questions and Problems
Answers to Review Questions
Planned Expenditure
1. Planned expenditure is the sum of four types of spending to purchase goods and services:
The Components of Expenditure
2. The consumption function states that consumer spending depends on disposable income, the real interest
rate, and other variables such as consumers’ optimism and wealth. The consumption function is written
as C =
C
+ mpc (Y – T) – cr. Y – T represents disposable income, and mpc is the marginal propensity
3. Planned investment spending consists of fixed investment, which is expenditures by business firms
on equipment and structures and by households on residential housing, and inventory investment,
4. Firms plan to invest in equipment, structures, and inventories when they expect to earn more from
these forms of physical capital than the interest cost of the funds used for their purchase. When the
real interest rate is very low, the cost of funds is very low, and many of the firm’s planned

Chapter 9 The IS Curve 91
5. An increase in financial frictions raise the real interest rate for investments, and so there are fewer
6. Net exports are inversely related to the real interest rate. When the real interest rate increases, ceteris
paribus, the expected return on domestic assets rises relative to foreign assets. People’s increased
Goods Market Equilibrium
7. Equilibrium in the goods market requires that total planned spending on goods and services equals
8. If unplanned inventory investment is positive, there is an excess supply of goods because aggregate
output exceeds planned expenditures. When this occurs, firms will cut production, and aggregate
Understanding the IS Curve
9. The IS curve shows the different combinations of the real interest rate and aggregate output for which
the goods market is in equilibrium with Y = C + I + G + NX. Because consumption, planned
investment, and net exports all are inversely related to the real interest rate, planned expenditures rise
Factors That Shift the IS Curve
10. The IS curve shifts when autonomous factors (factors that operate independently of the real interest
rate and aggregate output) cause changes in planned expenditures. When an autonomous factor
increases planned expenditures at each real interest rate, the IS curve shifts to the right because the
level of aggregate output required for goods market equilibrium rises. The IS curve shifts to the left

92 Mishkin • Macroeconomics: Policy and Practice, Second Edition
Answers to Problems
Planned Expenditure
1. Replacing the given estimates in Equation 1 yields: 16,420 = 12,210 + 1,680 + 2,970 + NX. Solving
The Components of Expenditure
2. In order to use Equation 2 to calculate consumption expenditure, we need an estimate of the marginal
propensity to consume (mpc). If an increase of $1,000 in disposable income leads to an increase of
3. In order to apply Equation 2, we need to calculate disposable income first. According to the data,
4. a. Dell’s inventory on December 31, 2013, is the market value of the 20,000 computers at its
warehouses. Therefore, Dell’s inventory equals 20,000 $500 = $10,000,000 on December 31,
2013.
b. Dell’s inventory spending is the change in the level of its inventory during the course of 2014.
Factors That Shift the IS Curve
5. a. A decrease in U.S. imports of Chinese goods will result in an increase in U.S. Net Exports
(assuming exports do not change), a component of planned expenditure. Assuming the goods
Chapter 9 The IS Curve 93
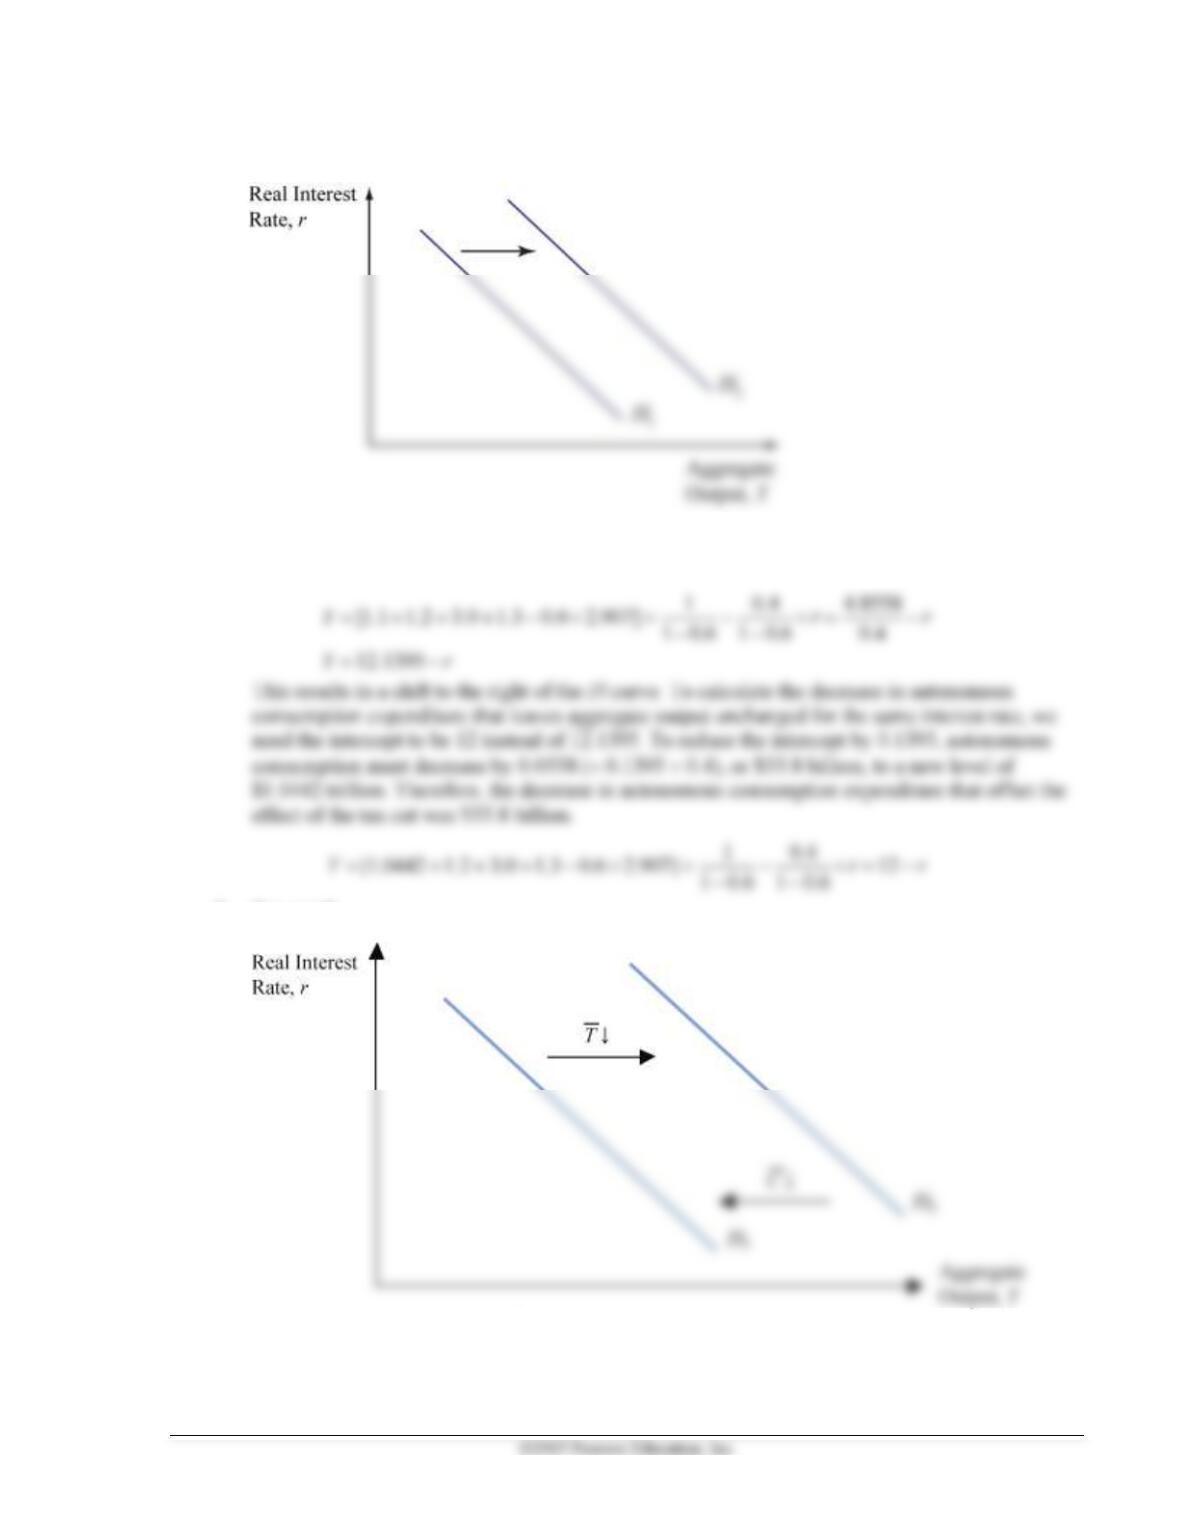
b. See graph:
6. a. Using the values of the parameters on page 239, a tax cut of $93 billion results in the following
expression for the IS curve:
b. See graph:
7. a. An increase in interest rates will decrease consumption expenditure, decrease planned investment
spending, and decrease net exports, as summarized by the terms c, d, and x in Equation 10. This
reduction in planned expenditure (assuming the goods market is in equilibrium) will result in a
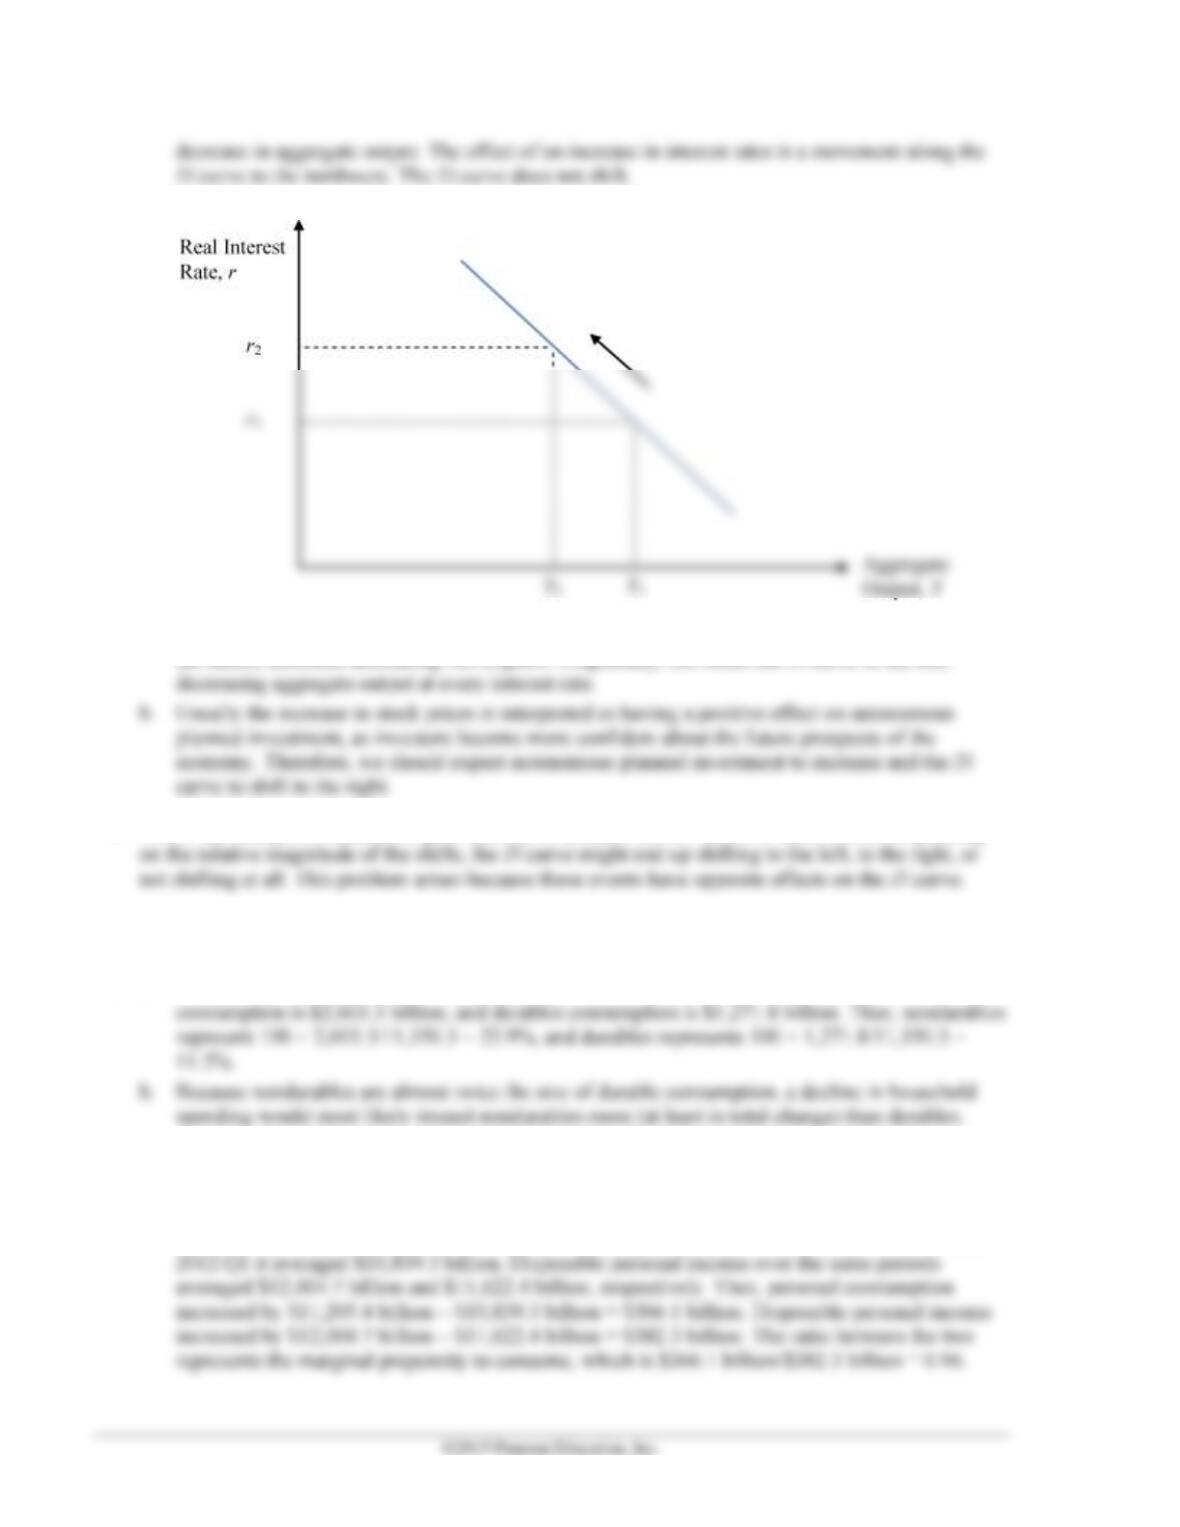
94 Mishkin • Macroeconomics: Policy and Practice, Second Edition
b. See graph.
8. a. A more expensive dollar will result in fewer U.S. exports and more U.S. imports (everything else
the same), therefore decreasing Net Exports. Graphically, this shifts the IS curve to the left,
9. This is an example in which it is quite difficult to measure the net effect of these events. Depending
◼ Answers to Data Analysis Problems
1. a. For 2013:Q1, total personal consumption expenditures are $11,350.3 billion, nondurable
2. a. For 2013:Q1, personal income minus disposable personal income = $13,601.3 billion –
$11,992.2 billion = $1,609.1 billion. This difference represents the amount of taxes households
pay.
b. For 2012:Q2 to 2013:Q1, personal consumption averaged $11,205.4 billion, and from 2011:Q2 to

Chapter 9 The IS Curve 95
3. a. From 2012:Q2 to 2013:Q1, the average change in investment was $18.75 (billion).
b. From 2012:Q1 to 2012:Q4, the average change in ri was –0.48.
private domestic investment falls by about $39 billion.
d. From 2008:Q3 to 2009:Q2, the average change in investment was –$155.83 (billion), and from
2008:Q2 to 2009:Q1, the average change in ri was 0.86. The coefficient on investment, d during
◼ Data Sources, Related Articles, and Discussion Questions
A. For Information About Application: The Vietnam War Buildup, 1964–1969
Data Source
“Edit Graph” and change the years to see the evolution of defense expenditure between 1960 and 1970.
Related Article
Discussion Question
During the period described in the application, unemployment and interest rates were at relatively low
levels for some time, while output increased. Would this mean that an increase in government spending is
the answer to reach low unemployment and economic growth at the same time?
Answer: Note that this is only a part of a more comprehensive analysis conducted over the next chapters.

96 Mishkin • Macroeconomics: Policy and Practice, Second Edition
B. For Information About Policy and Practice: The Fiscal Stimulus Package of
2009
Data Source
last available date.
Related Article
Shambaugh, Jay (Council of Economic Advisors), “Fiscal Stimulus Making an Impact Around the
Discussion Question
The Obama administration (as the previous Bush administration did) stated that the stimulus package
would increase employment and successfully pull the economy out of the recession. However,
unemployment remained high for some time even after the second stimulus package was approved.
Discuss whether this implies that stimulus packages are completely useless to affect aggregate output.
Answer: This is a quite controversial topic. Adherents to stimulus packages argue that, in the absence of