CHAPTER 9 | Unemployment and Inflation 211
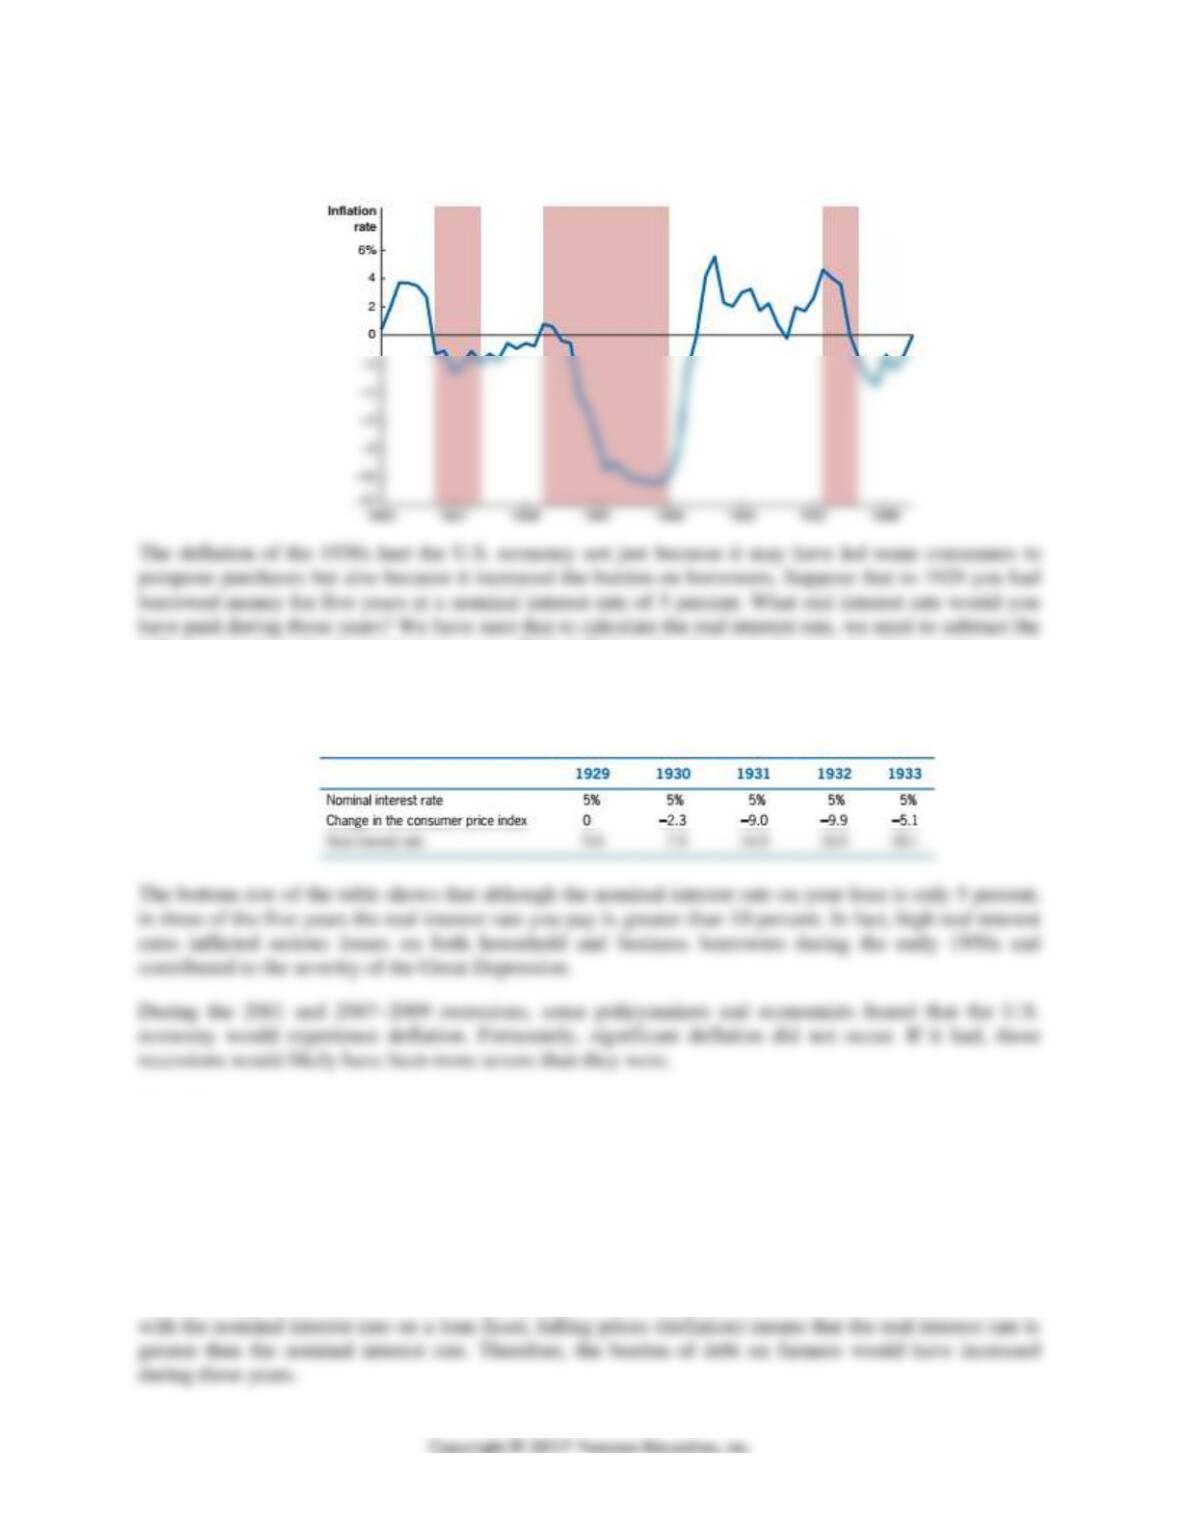
The following figure shows changes in the CPI in the United States during the years between 1925 and
1940. The beginning of the Great Depression in 1929 caused the country to experience severe deflation.
inflation rate from the nominal interest rate. With deflation, the change in the price level is negative, so to
calculate the real interest rate, we are in effect adding the change in the price level to the nominal interest
rate. The following table uses the actual deflation rate in each year to calculate the resulting real interest
rates on your loan:
Question
During the late nineteenth century in the United States, many farmers borrowed heavily to buy land.
During most of the period between 1870 and the mid-1890s, the United States experienced mild deflation:
The price level declined each year. Many farmers engaged in political protests during these years, and
deflation was often a subject of their protests. Explain why farmers would have felt burdened by
deflation.
Answer
When there is unanticipated deflation, the real interest rate on loans increases. This result holds because
212 CHAPTER 9 | Unemployment and Inflation
Extra Economics in Your Life:
How will the real interest rate affect the cost of your car loan?
Let’s assume that the old clunker you have been driving needs $500 in repairs in order to pass an annual
car inspection. You are considering buying a new car, and you contact car dealers and banks to determine
Question: Under which scenario—(a) or (b)—will you pay less, in real income, for your car loan?
Answer: Although the nominal interest rate is much lower under scenario (a), you should base your
Extra AN INSIDE LOOK News Article to Use in Class
CHAPTER 9 | Unemployment and Inflation 213
Solutions to End-of-Chapter Exercises
9.1
Measuring the Unemployment Rate, the Labor Force Participation Rate,
and the Employment-Population Ratio
Learning Objective: Define the unemployment rate, the labor force participation rate,
and the employment-population ratio and understand how they are computed.
Review Questions
1.1 The unemployment rate is calculated monthly from data gathered by the U.S. Bureau of the
and (3) actively looked for work at some time during the previous four weeks.
1.2 The official Bureau of Labor Statistics (BLS) measure of the unemployment rate understates the
true degree of unemployment to the extent that it does not count discouraged workers as
1.3 African Americans and Hispanics tend to have above-average unemployment rates, and whites
1.4 The labor force participation rate measures the percentage of the working-age population that is
in the labor force: (Labor Force/Working-Age Population) × 100. Since 1948, the labor force
participation rate has decreased for men and increased for women.
1.5 The employment-population ratio measures the percentage of the working-age population that is
1.6 The household survey is a sample of 60,000 households chosen to represent the U.S. population
and provides information on the employment status of everyone in the household 16 years of age
and older. The establishment survey is a sample of 300,000 business establishments and gathers
214 CHAPTER 9 | Unemployment and Inflation
Problems and Applications
1.7
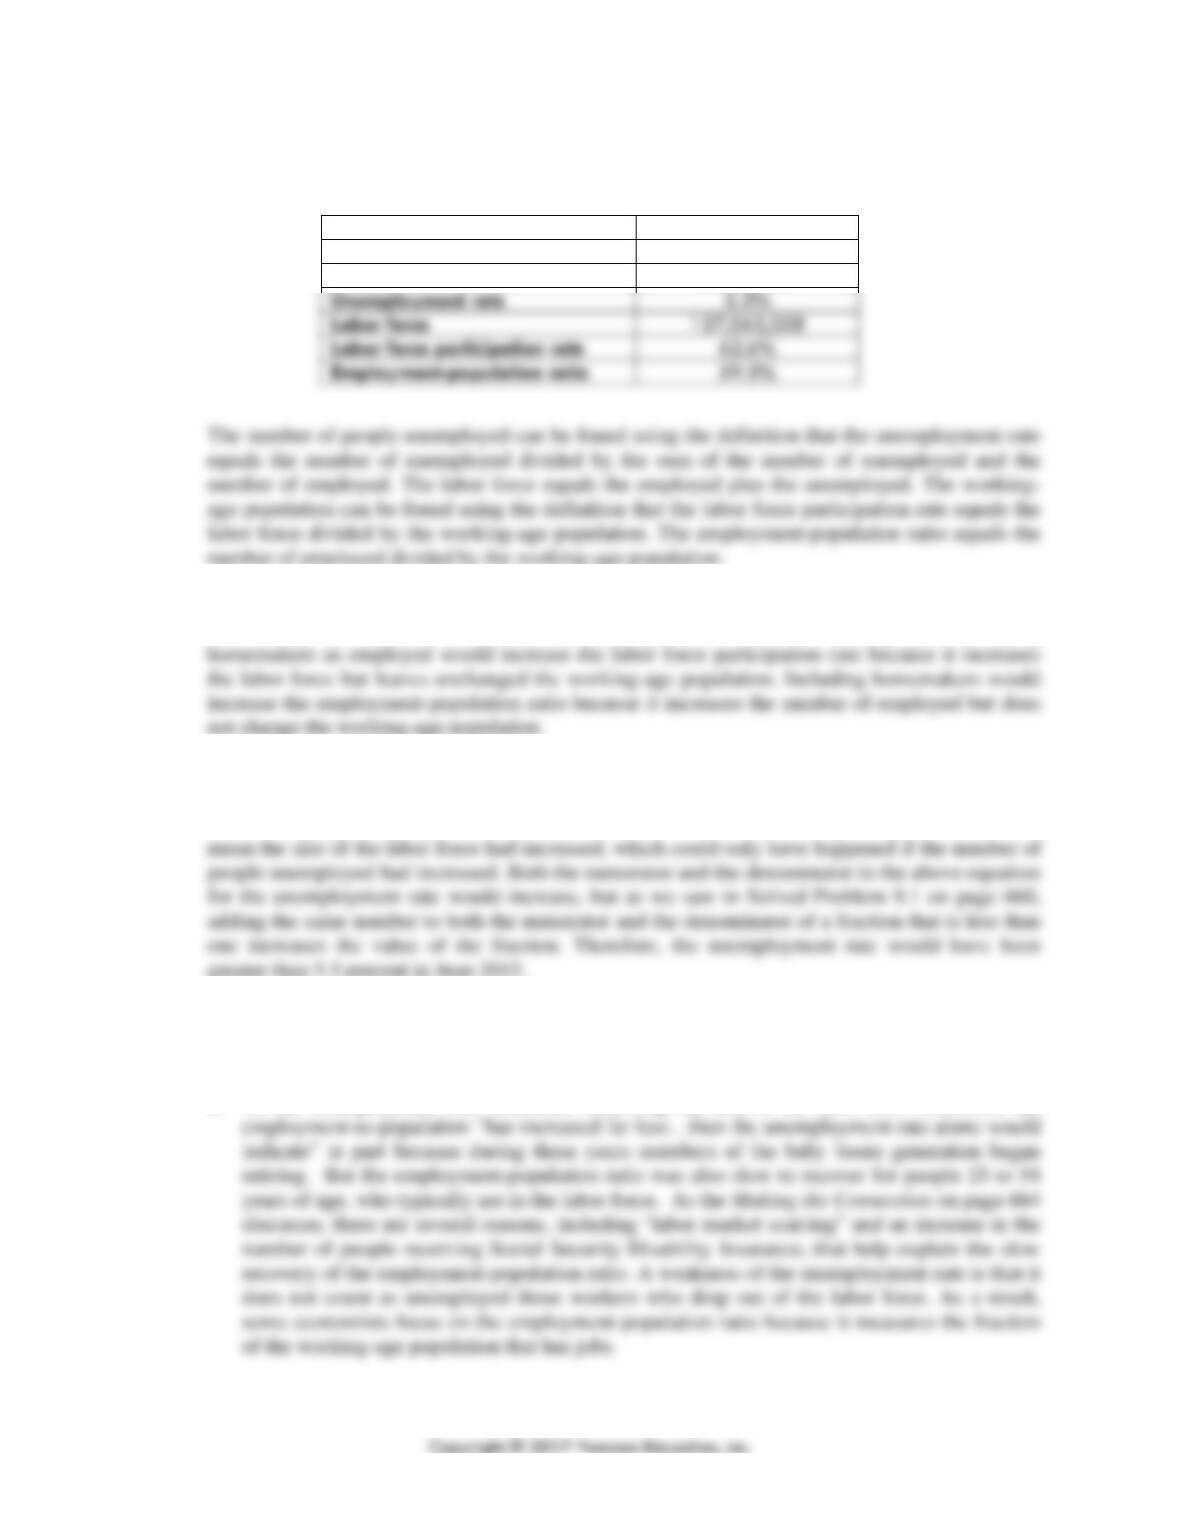
Working-age population
250,899,933
Employment
148,739,000
Unemployment
8,324,358
Unemployment rate
Labor force
157,063,358
Labor force participation rate
Employment-population ratio
1.8 Including homemakers as employed would decrease the unemployment rate because it increases
the size of the labor force but leaves unchanged the number of unemployed. Including
1.9 The formula for the unemployment rate is: (Number of unemployed/Labor force) × 100. The
labor force is equal to the sum of the employed and the unemployed. Holding constant the
number of people employed in June 2015, an increase in the labor force participation rate would
1.10 a. During an economic expansion we would expect that the number of jobs created to increase
as the economy expands, so the numerator of the employment-population ratio will increase
relative to the denominator, causing the ratio to increase.
b. As the unemployment rate decreased following the end of the 2007-2009 recession, the
CHAPTER 9 | Unemployment and Inflation 215
1.11 The employment-population rate increases when the increase in the number of employed workers is
greater than the increase in population. The number of people in the labor force–the numerator of
the labor force participation rate—increases as the number of employed workers increases, but also
1.12 a. These workers are not counted as unemployed in the BLS data because they are no longer
actively looking for work.
b. The BLS will count these graduates as part of the labor force even if they don’t have jobs, so
long as they are actively looking for work.
1.13 The unemployment rate can increase while employment increases if the number of discouraged
workers and other people not previously counted as unemploymed entering the labor force more
9.2
Types of Unemployment
Learning Objective: Identify the three types of unemployment.
Review Questions
2.1 The three types of unemployment are frictional unemployment, structural unemployment, and
cyclical unemployment. Frictional unemployment is short-term unemployment that arises from
the process of matching workers with jobs. Structural unemployment is unemployment that arises
2.2 Frictional unemployment arises from the process of matching workers with jobs. Because job
2.3 The natural rate of unemployment is the normal rate of unemployment, consisting of frictional
unemployment plus structural unemployment. The natural rate of unemployment is considered
the full-employment rate of unemployment.
216 CHAPTER 9 | Unemployment and Inflation
Problems and Applications
2.4 The decline in employment by the Ford Motor Company from 1980 to 2015 would primarily be
structural with some cyclical unemployment. Some of the decline in employment would be
cyclical because by 2015 the U.S. economy and the economies of other high-income countries
2.5 You should disagree. The economy would operate less efficiently if frictional unemployment
were eliminated. By devoting time to job search, workers end up with jobs they find satisfying
2.6 For someone frictionally unemployed, good advice would be to keep searching. The person has
the required skills, but matching worker skills to job openings takes time. For someone
2.7 a. Unemployment that results from job quits would be classified as frictional unemployment,
assuming that those how quit their jobs wish to remain in the labor force.
2.8 The workers referred to in the story are likely to be structurally unemployed because they lack the
skills required for the available jobs.
9.3
Explaining Unemployment
Learning Objective: Explain what factors determine the unemployment rate.
Review Questions
3.1 The payment of government unemployment insurance likely raises the unemployment rate.
Unemployment insurance payments lower the opportunity cost (the income lost by not working)
CHAPTER 9 | Unemployment and Inflation 217
3.2 The federal minimum-wage law and efficiency wages push the wage above the market wage,
causing some unemployment. In unionized industries, the wage is usually above what otherwise
3.3 A significant reason that the unemployment rate in the United States has been lower than the
unemployment rates in Canada and countries in Western Europe is the more generous
Problems and Applications
3.4 If the proposal were enacted, the unemployment rate in France would be higher because the law
3.5 Unemployment rises during a recession, so unemployment claims and unemployment insurance
3.6 a. and c. are likely to increase the unemployment rate. Lengthening the time workers are
eligible to receive unemployment insurance lowers the opportunity cost of a job search. An
3.7 Henry Ford was paying an efficiency wage, which can cut a firm’s cost by increasing the
productivity of workers, increasing the quality of workers willing to work for the firm, and
decreasing the turnover of workers.
3.8 a. Labor turnover refers to companies having to replace workers who quit their jobs.
b. One reason why Wal-Mart, IKEA and other firms increased the wages they pay to newly
9.4
Measuring Inflation
Learning Objective: Define the price level and the inflation rate and understand how
they are computed.
Review Questions
4.1 The GDP deflator is the broadest measure of the price level because it includes the prices of all
final goods and services included in GDP. The Consumer Price Index measures the prices of
218 CHAPTER 9 | Unemployment and Inflation
4.3 The potential biases include substitution bias, increase in quality bias, new product bias, and
outlet bias. The Bureau of Labor Statistics updates the market basket every two years to reduce
4.4 The Consumer Price Index is an average of the prices of final goods and services purchased by a
Problems and Applications
4.5 The statement misinterprets how economists use the CPI to calculate the inflation rate. The
inflation rate in 2014 is the percentage change in the CPI since 2013, not since the base year.
4.6 There is no contradiction because the inflation rate measures the percentage change in the price
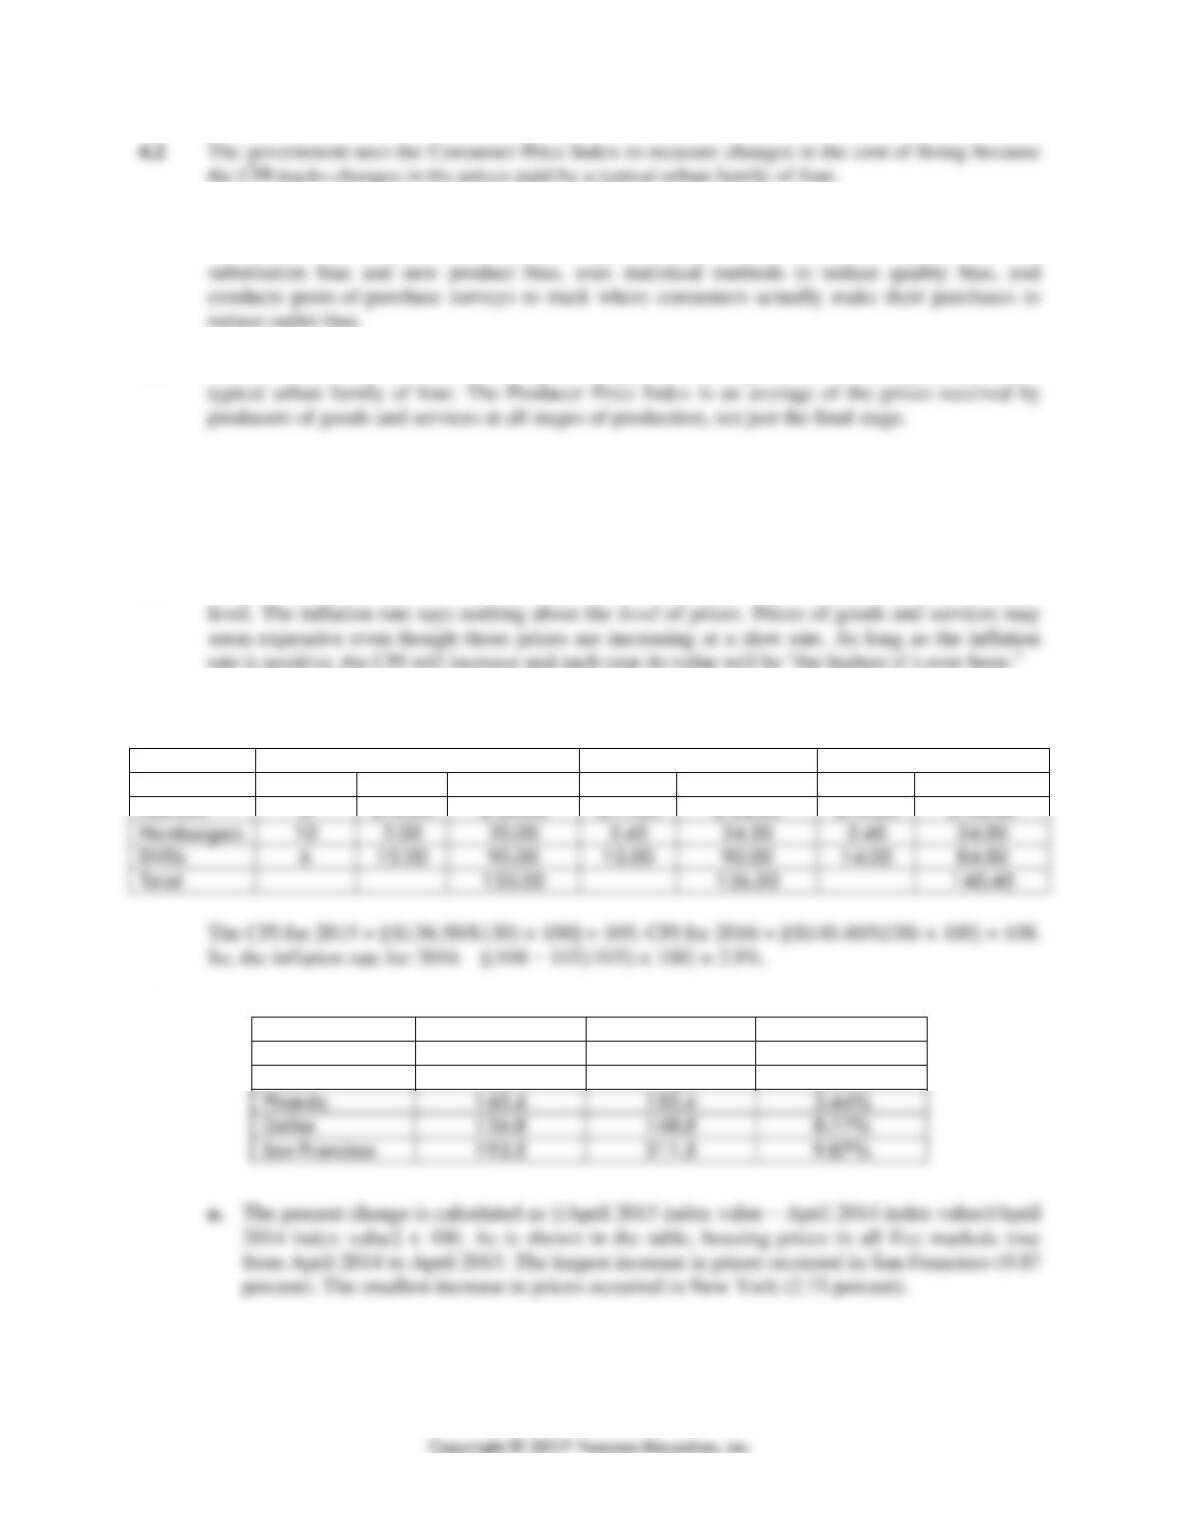
4.7
Base Year (1999)
2015
2016
Product
Quantity
Price
Expenditure
Price
Expenditures
Price
Expenditures
Haircuts
Hamburgers
DVDs
Total
4.8
City
April 2014
April 2015
Percent Change
New York
174.5
179.3
2.75%
Miami
183.2
198.5
8.35%
Phoenix
145.4
150.4
3.44%
Dallas
136.8
148.8
8.77%
San Francisco
192.5
211.5
9.87%
b. We cannot determine on the basis of these numbers which city had the most expensive homes
because the numbers are not dollar amounts but indexes that measure prices in each city in a
given month relative to what they were in that city in the base month.
CHAPTER 9 | Unemployment and Inflation 219
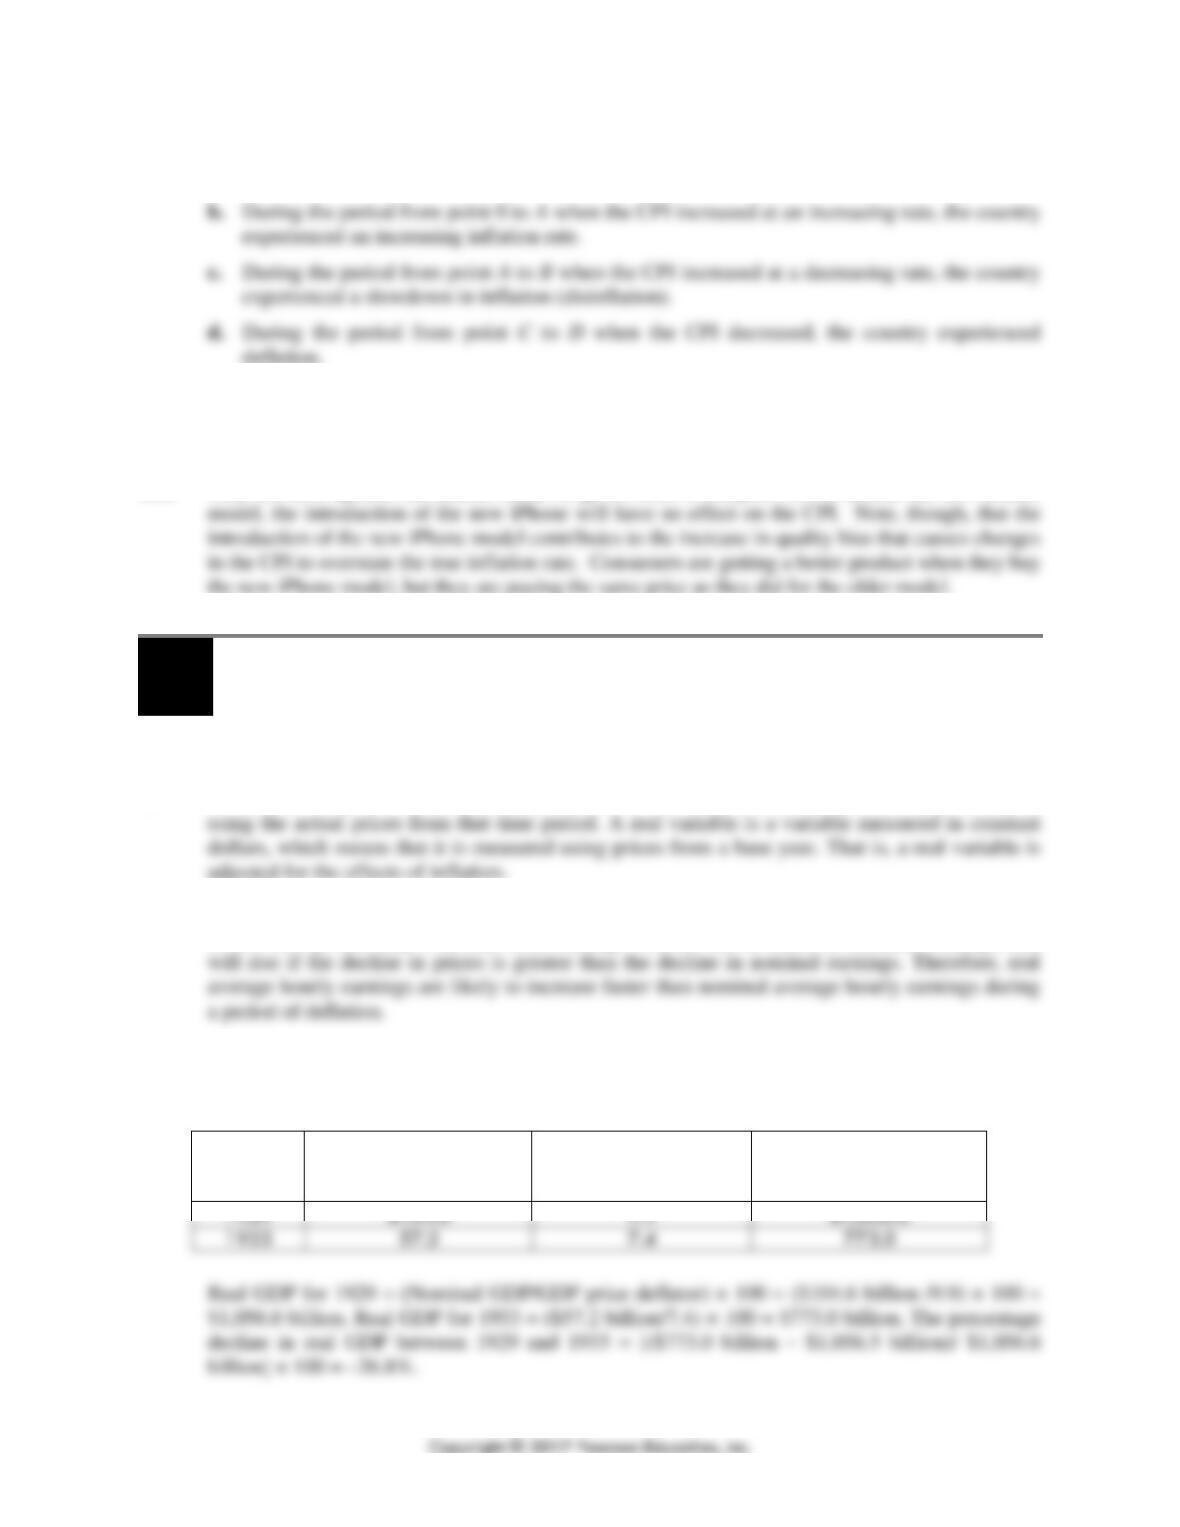
4.9 a. During the period from point B to C when the CPI did not change, the country experienced
zero inflation.
4.10 The BLS’s motivation in changing its methods of calculating the CPI was to more accurately
measure the rate of inflation. Before these revisions most economists believed that the CPI had
biases that caused it to overstate the rate of inflation by as much as one percentage point.
4.11 Until the BLS updates the market basket of goods used to compute CPI to include the new iPhone
the new iPhone model, but they are paying the same price as they did for the older model.
9.5
Using Price Indexes to Adjust for the Effects of Inflation
Learning Objective: Use price indexes to adjust for the effects of inflation.
Review Questions
5.1 A nominal variable is a variable measured in current dollars, which means that it is measured
5.2 As prices of goods and services decrease during a period of deflation nominal earnings are likely
to rise slowly, and may even fall. Real earnings will not fall as much as nominal earnings, and
Problems and Applications
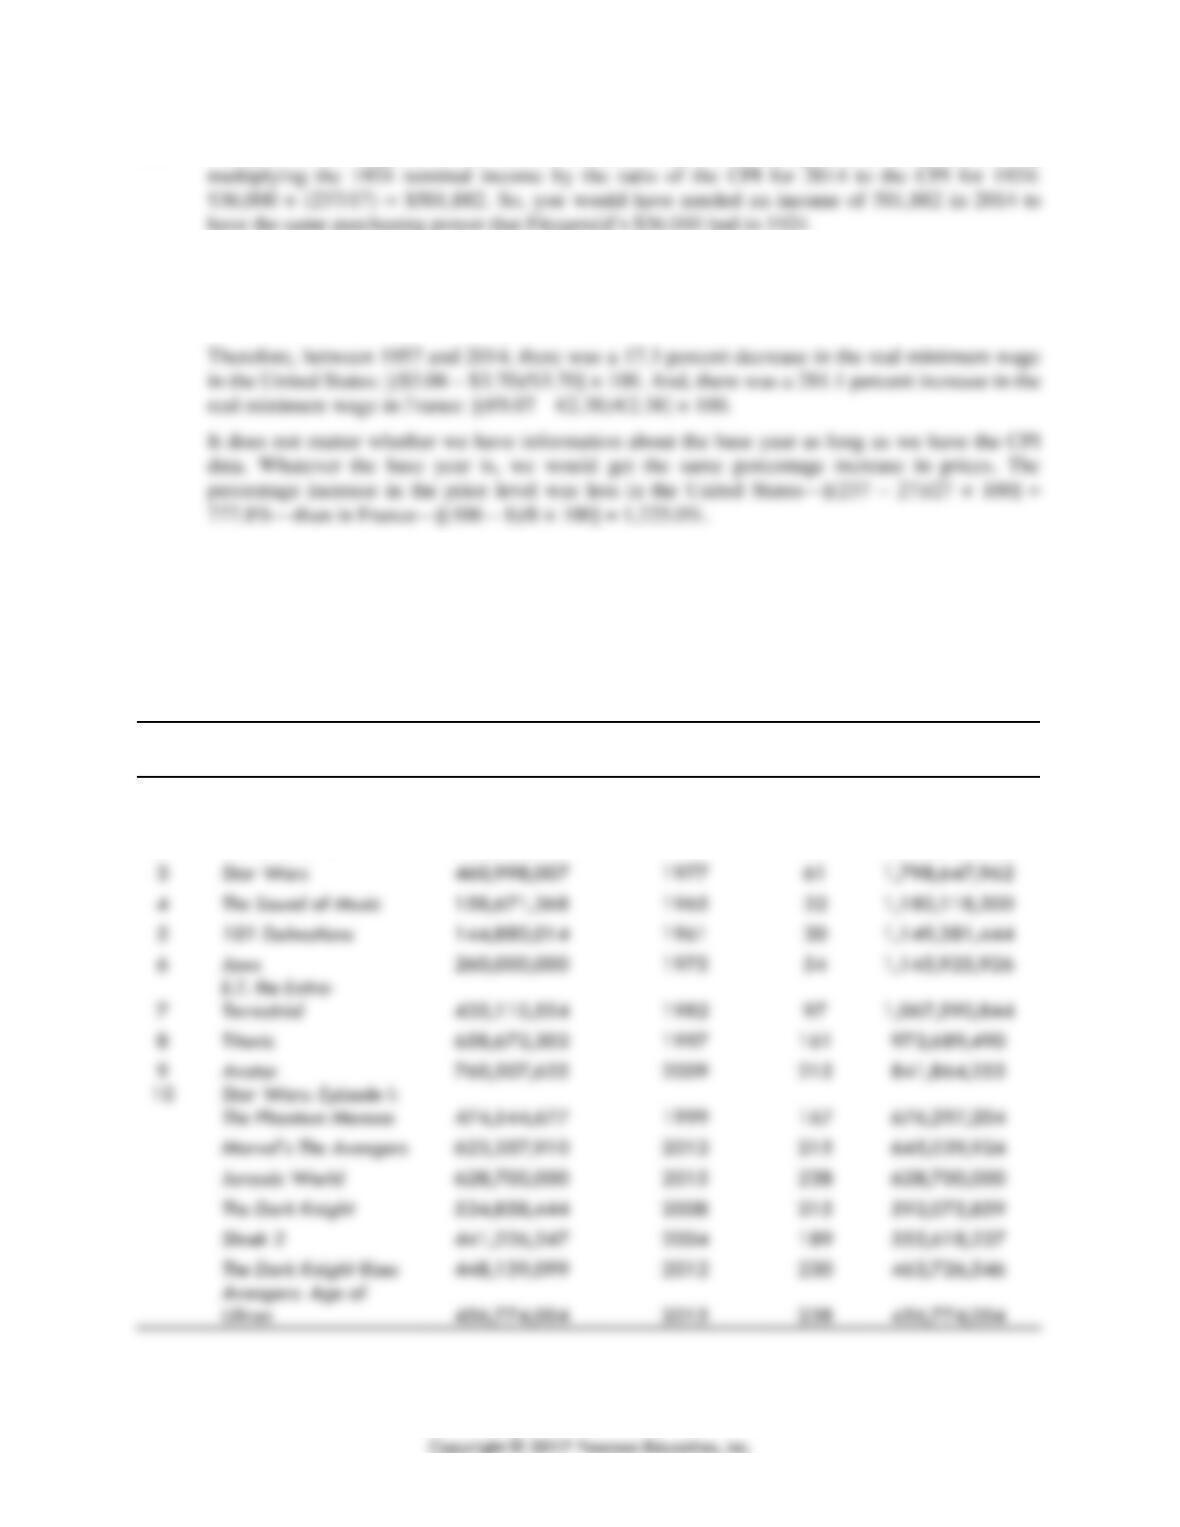
5.3
Year
Nominal GDP (billions
of dollars)
GDP Price Deflator
(2009 = 100)
Real GDP
(billions of 2009
dollars)
220 CHAPTER 9 | Unemployment and Inflation
5.4 We can convert Fitzgerald’s 1924 nominal income of $36,000 to an equivalent income in 2014 by
5.5 In the United States, the real minimum wage in 1957 was $3.70: [($1.00/27) × 100], and in 2014
it was $3.06: [($7.25/237)
100]. In France, the real minimum wage in 1957 was €2.38:
[(€0.19/8) × 100], and in 2014 it was €9.07: [(€9.61/106) × 100].
5.6 If three cups of coffee and a doughnut can be purchased in 2014 for $10 and for $2,000 in 2054,
the CPI would have to be 200 times greater in 2054 than in 2014 because 200 × $10 = $2,000.
Therefore, the CPI in 2054 would be 237 × 200 = 47,400.
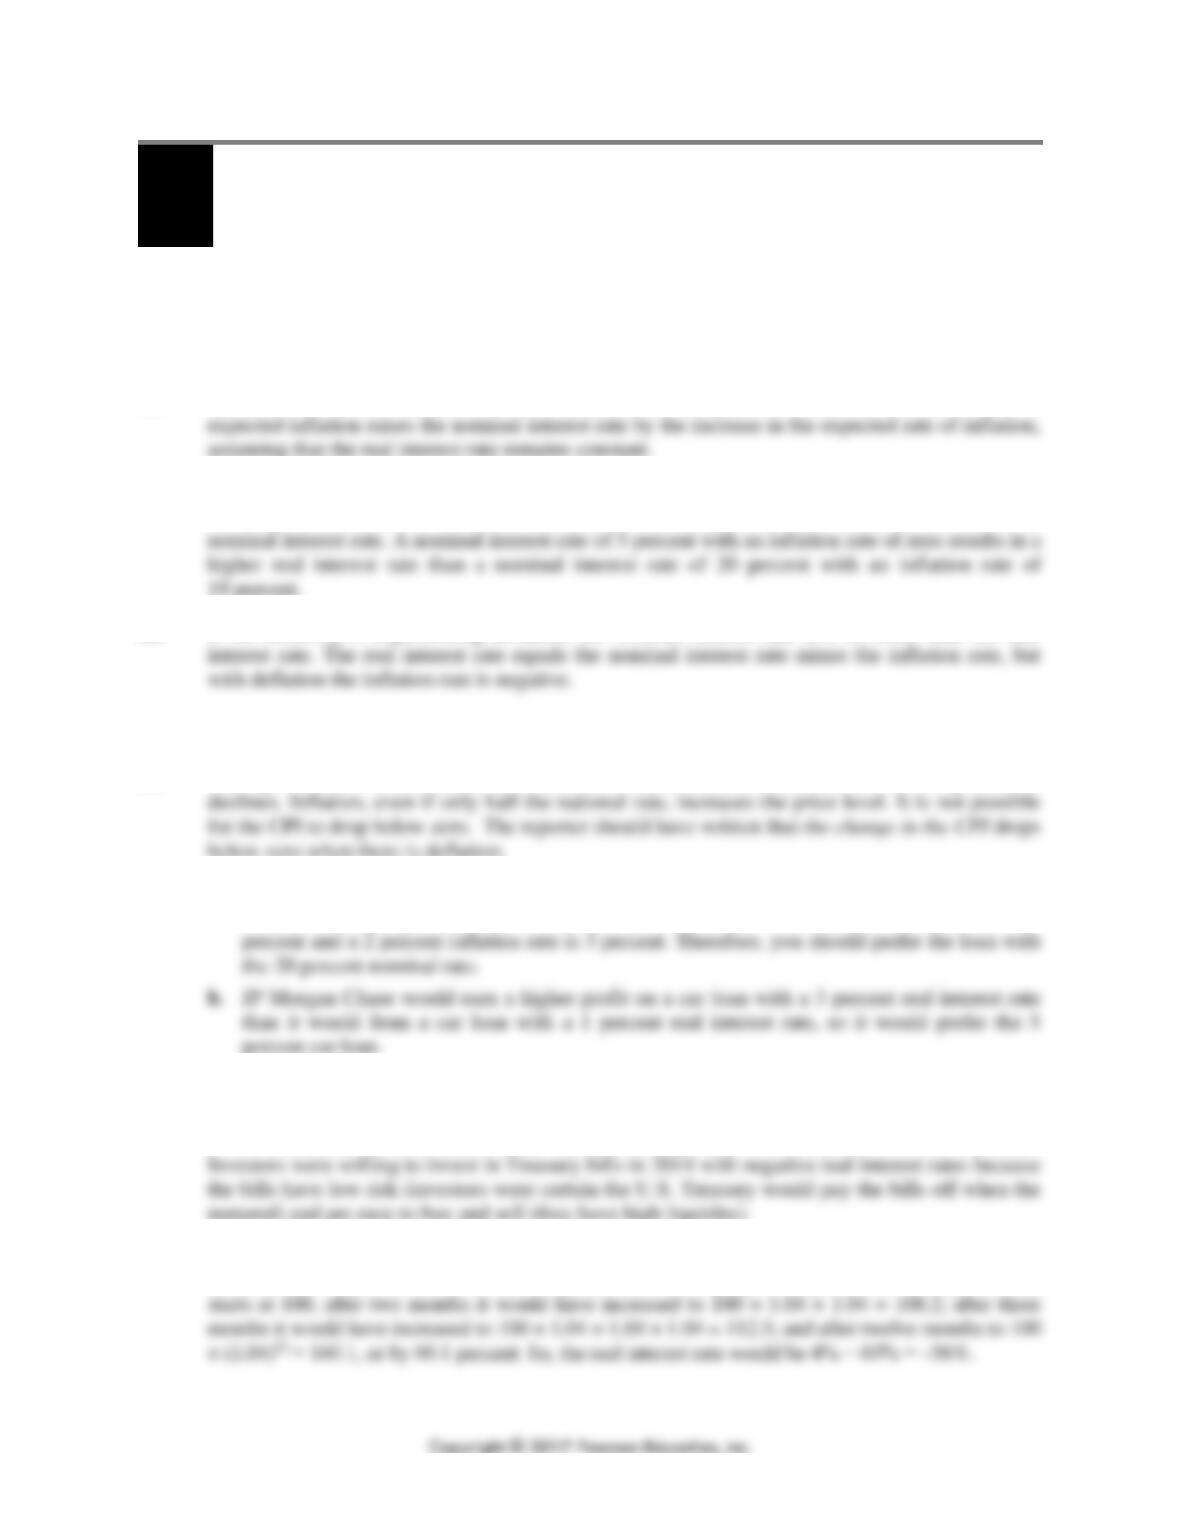
5.7 The real receipts in 2015 dollars for each film are listed in the last column below. The first
column shows the rankings of the top ten films based on their earnings in 2015 dollars.
Rank
Film
Total Box Office
Receipts
Year Released
CPI
Real Receipts
(2015 dollars)
1
Gone with the Wind
$198,676,459
1939
14
$3,377,499,803
2
Snow White and the
Seven Dwarfs
184,925,486
1937
14
3,143,733,262
3
Star Wars
460,998,007
1977
61
1,798,647,962
4
The Sound of Music
158,671,368
1965
32
1,180,118,300
5
144,880,014
1961
30
1,149,381,444
6
260,000,000
1975
54
1,145,925,926
7
E.T. the Extra-
435,110,554
1982
97
1,067,590,844
8
658,672,302
1997
9
760,507,625
2009
474,544,677
1999
623,357,910
2012
Jurassic World
The Dark Knight
534,858,444
2008
Shrek 2
441,226,247
2004
The Dark Knight Rises
448,139,099
2012
Avengers: Age of
Ultron
456,774,004
2015
CHAPTER 9 | Unemployment and Inflation 221
9.6
Nominal Interest Rates versus Real Interest Rates
Learning Objective: Distinguish between the nominal interest rate and the real interest
rate.
Review Questions
6.1 The nominal interest rate is the stated interest rate on a loan, while the real interest rate is the
nominal interest rate minus the inflation rate.
6.2 Because the nominal interest rate is the real interest rate plus the inflation rate, an increase in
6.3 It is impossible to know whether a particular nominal interest rate is “high” or “low” without
knowing the inflation rate. It is the real interest rate that matters to borrowers and lenders, not the
6.4 If the economy is experiencing deflation, the nominal interest rate will be lower than the real
Problems and Applications
6.5 The reporter does not understand the definition of deflation. Deflation occurs when the price level
6.6 a. The real interest rate on a loan with a nominal interest rate of 20 percent and a 19 percent
inflation rate is 1 percent. The real interest rate on a loan with a nominal interest rate of 5
6.7 The inflation rate from June 2014 to June 2015 as measured by the CPI was: [(237.8 −
237.3)/237.3] × 100 = 0.21 percent. With the nominal interest rate on the one-year Treasury bill
of 0.10 percent, the real interest rate equaled 0.10 percent – 0.21 percent = −0.11 percent.
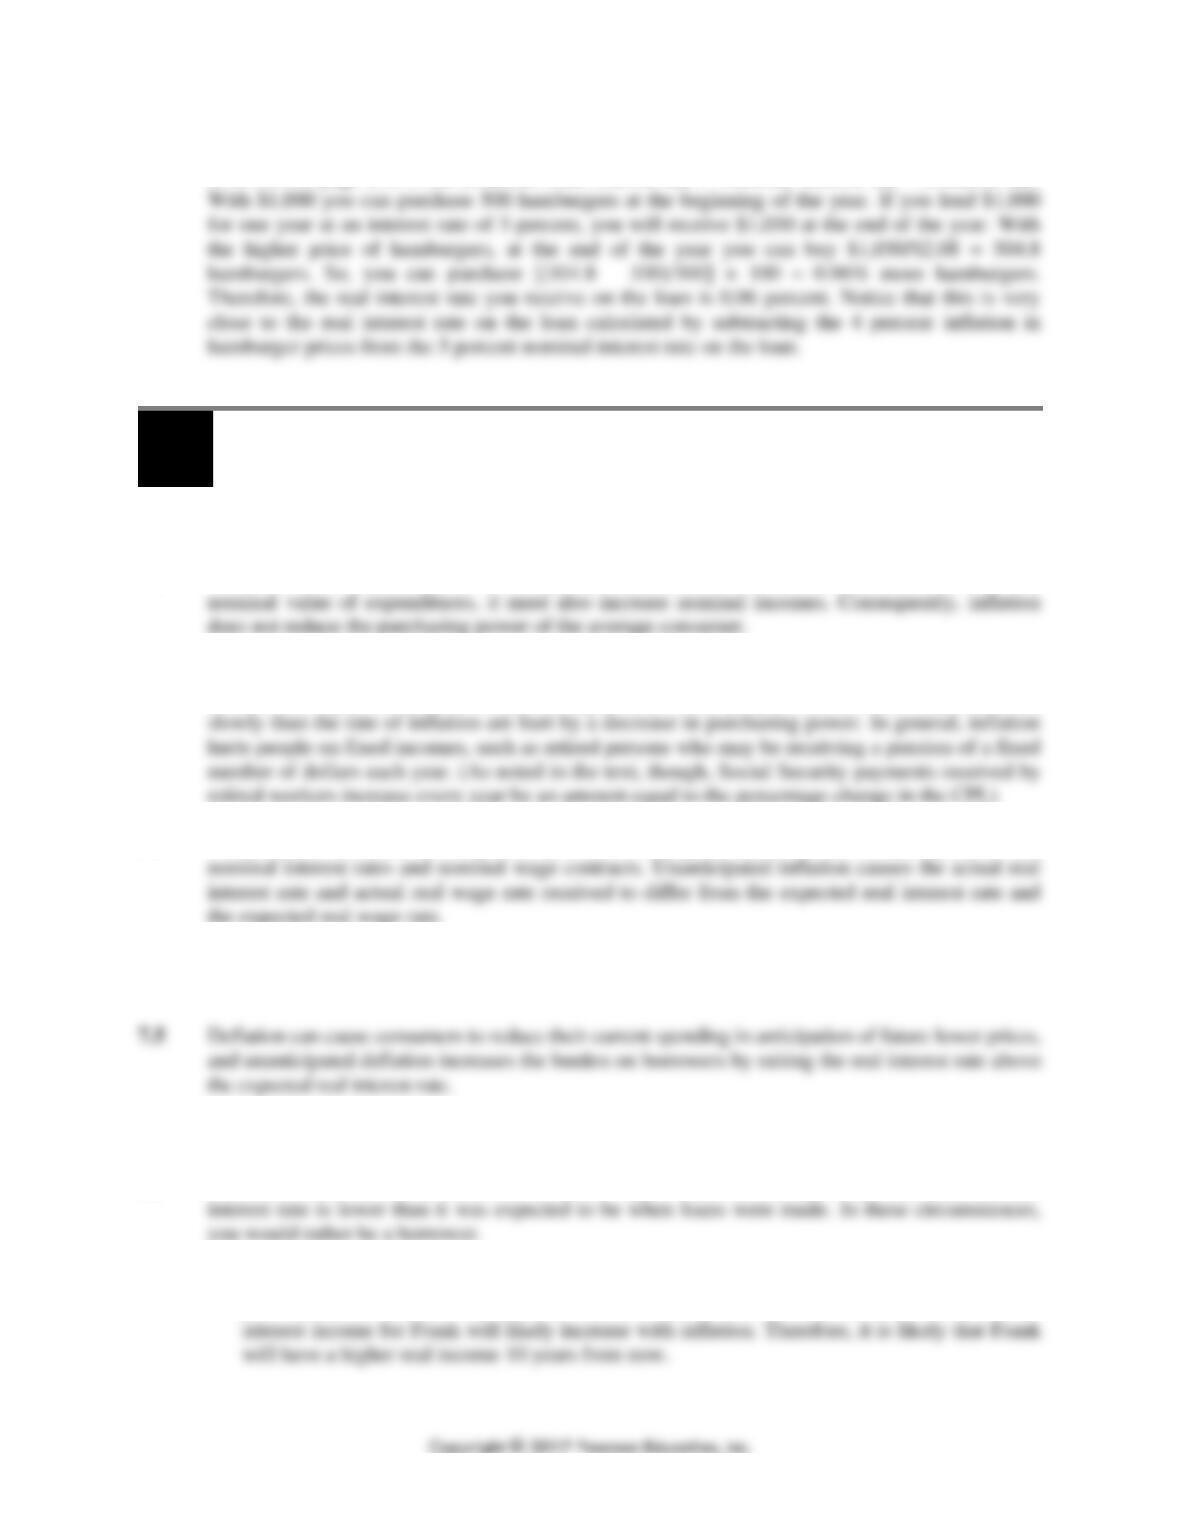
6.8 If the monthly inflation rate is 4 percent, the annual inflation rate is about 60 percent. To see this,
notice that at a 4 percent inflation rate, the price level is rising 4 percent per month. If the price level
222 CHAPTER 9 | Unemployment and Inflation
6.9 We can answer by using the method of calculating the real interest rate explained in the example
of DVDs on page 678 in the textbook: Real interest rate = Nominal interest rate – Inflation rate.
9.7
Does Inflation Impose Costs on the Economy?
Learning Objective: Discuss the problems that inflation causes.
Review Questions
7.1 We know from the circular flow of expenditures and income that when inflation increases the
7.2 Inflation affects the purchasing power of money. People with incomes that rise faster than the rate
of inflation enjoy an increase in purchasing power, while people with incomes that rise more
7.3 Unanticipated inflation is the greater problem. Anticipated inflation can be incorporated into
7.4 Menu costs are the costs to firms of changing prices. The Internet allows firms to change prices at
little cost so that it has reduced the size of menu costs.
Problems and Applications
7.6 When the inflation rate turns out to be much higher than most people expected, then the real
7.7 a. Real income is nominal income adjusted for increases in the price level. With inflation, the
real income for James will decrease because he receives a fixed income. However, the
CHAPTER 9 | Unemployment and Inflation 223
7.8 The real interest rate is the cost to Apple of borrowing funds from investors. Therefore, a low real
interest rate is good for Apple and bad for investors, much like a low price is usually good for
consumers, but bad for producers. Inflation was expected to be 2 percent, but turned out to be
7.9 Consumers would defer purchases if they expected deflation to continue so that they would pay
7.10 When there is unanticipated deflation, the real interest rate on loans increases. This result holds
because with the nominal interest rate on a loan fixed, falling prices (deflation) means that the
Real-Time Data Exercises
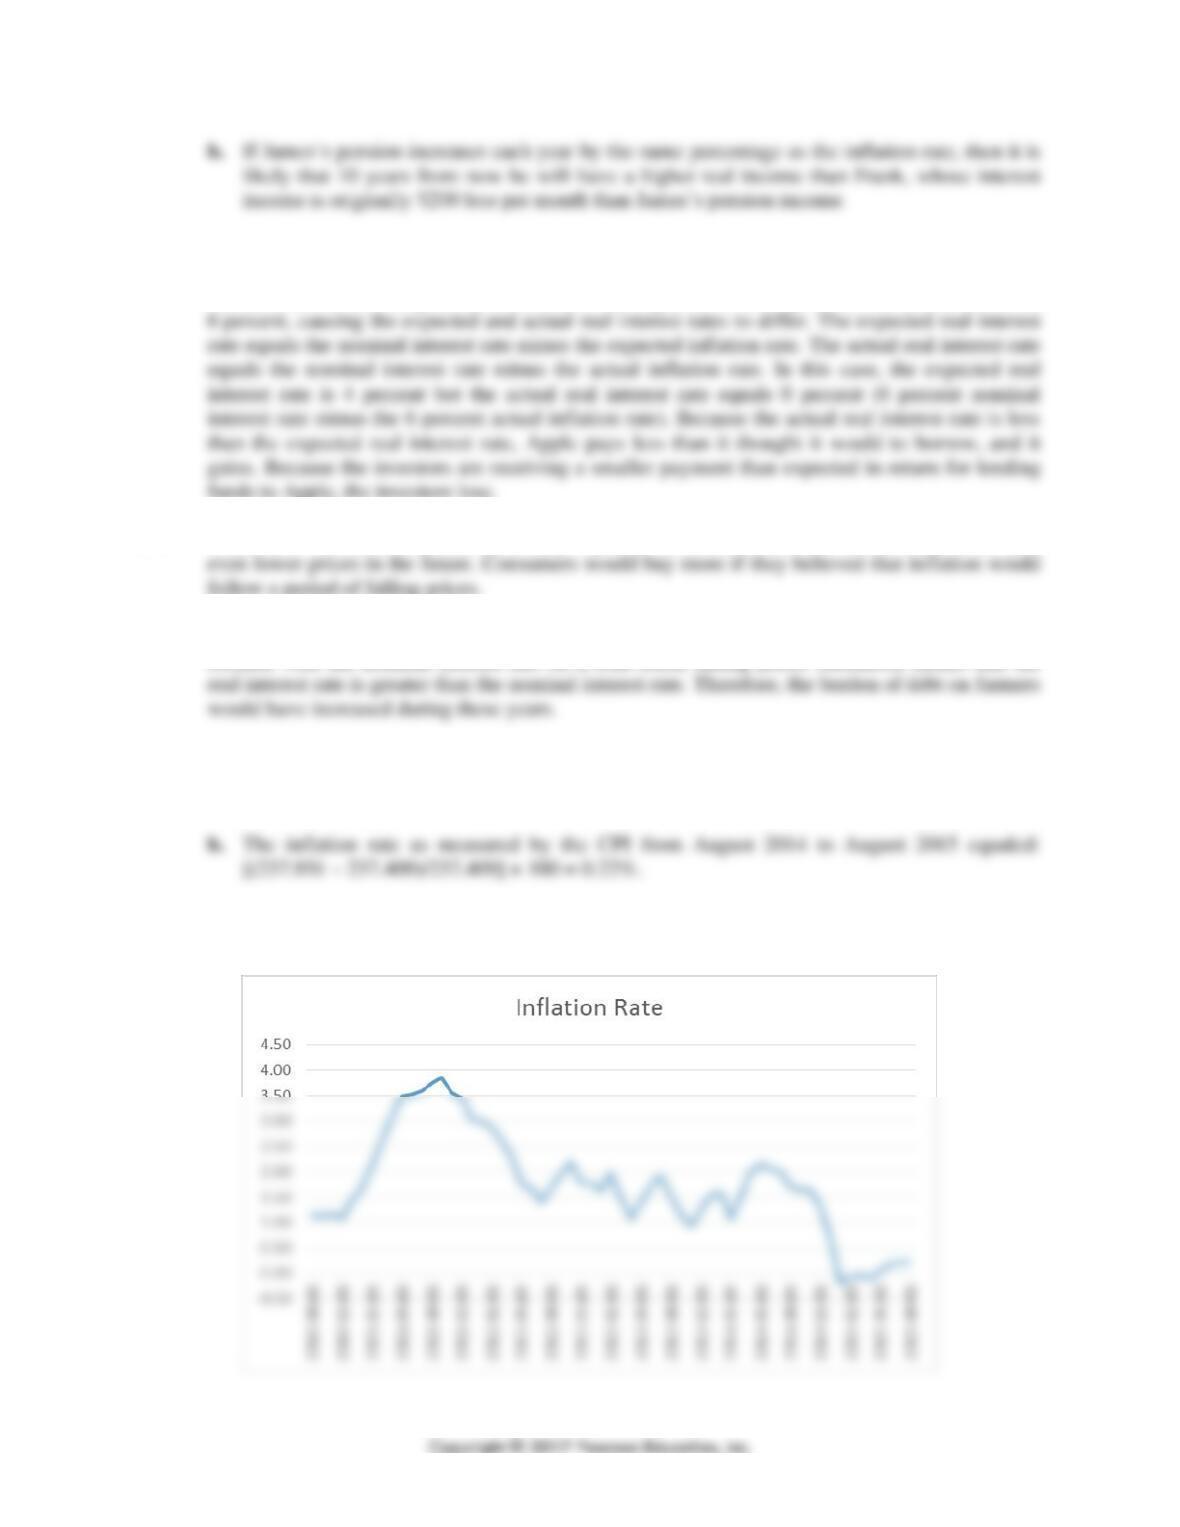
D9.1 a. The CPI for August 2014 was 237.409 and for August 2015 it was 237.931.
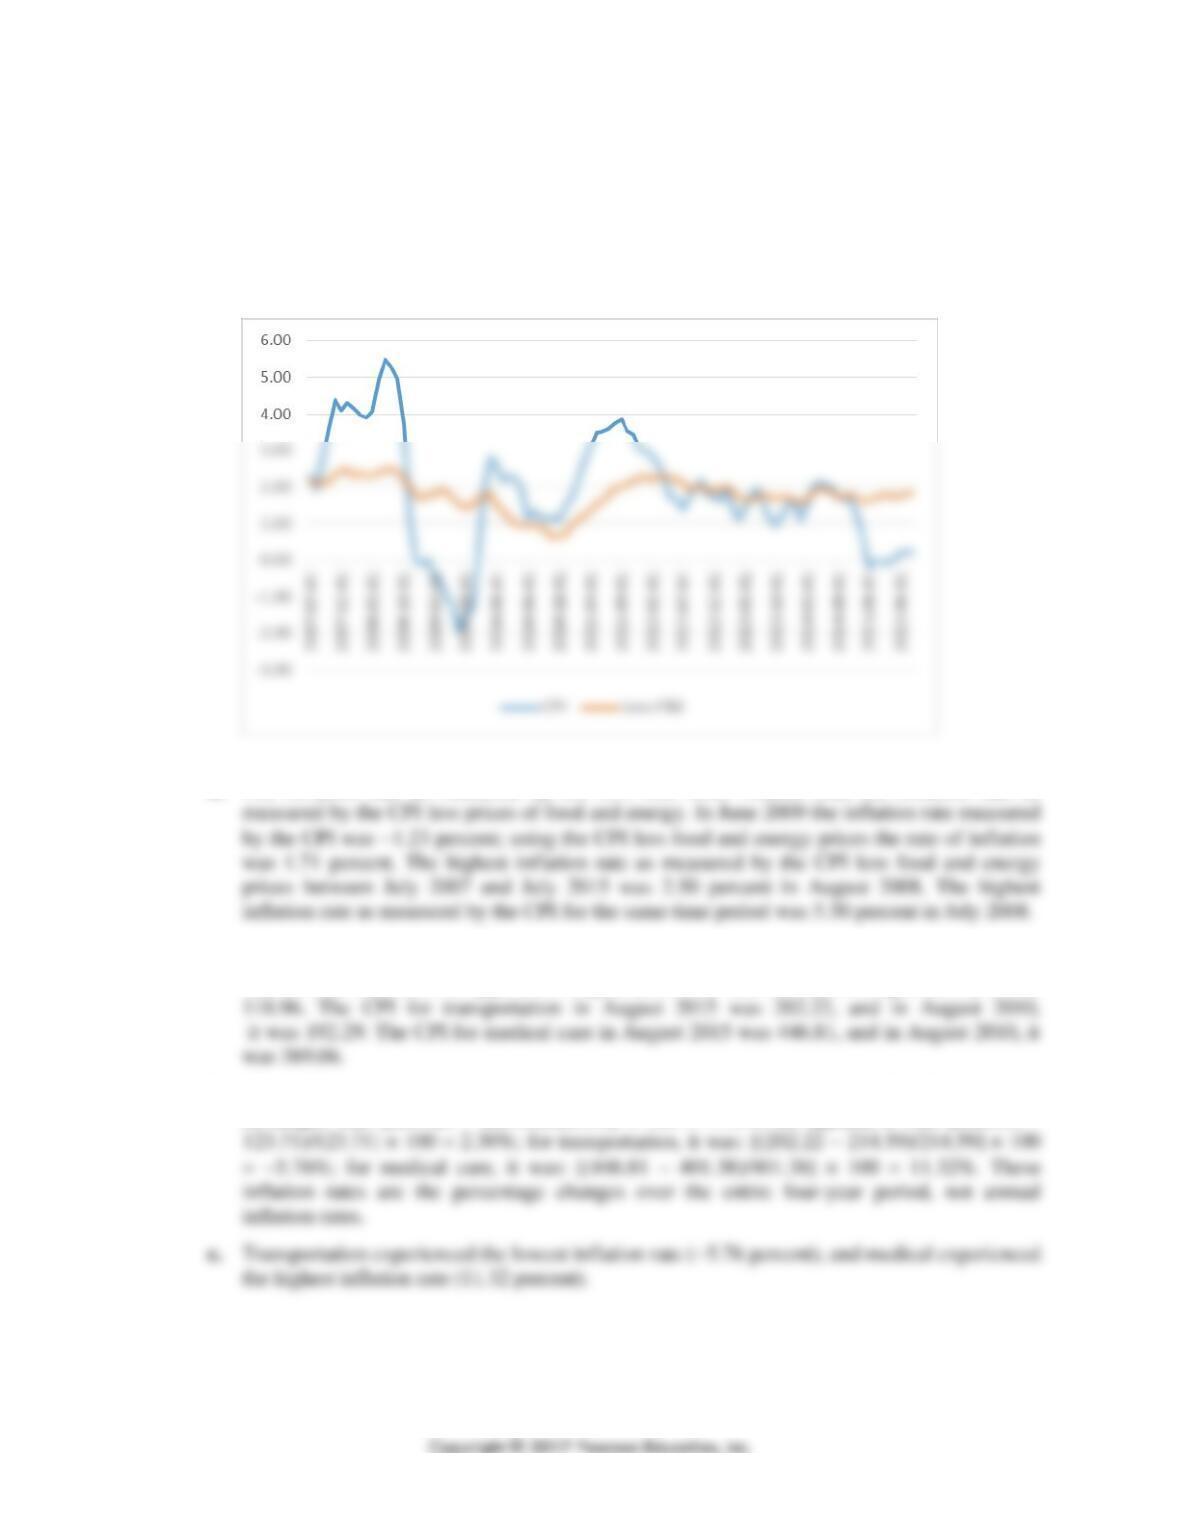
D9.2 a. and b. Data used in the graph in c. below covers the period from August 2010 to August 2015.
c.
224 CHAPTER 9 | Unemployment and Inflation
d. The inflation rate of 3.85 percent in September 2011 was the highest during these years. The
inflation rate for each month equals the percentage change in the CPI over the previous
twelve months.
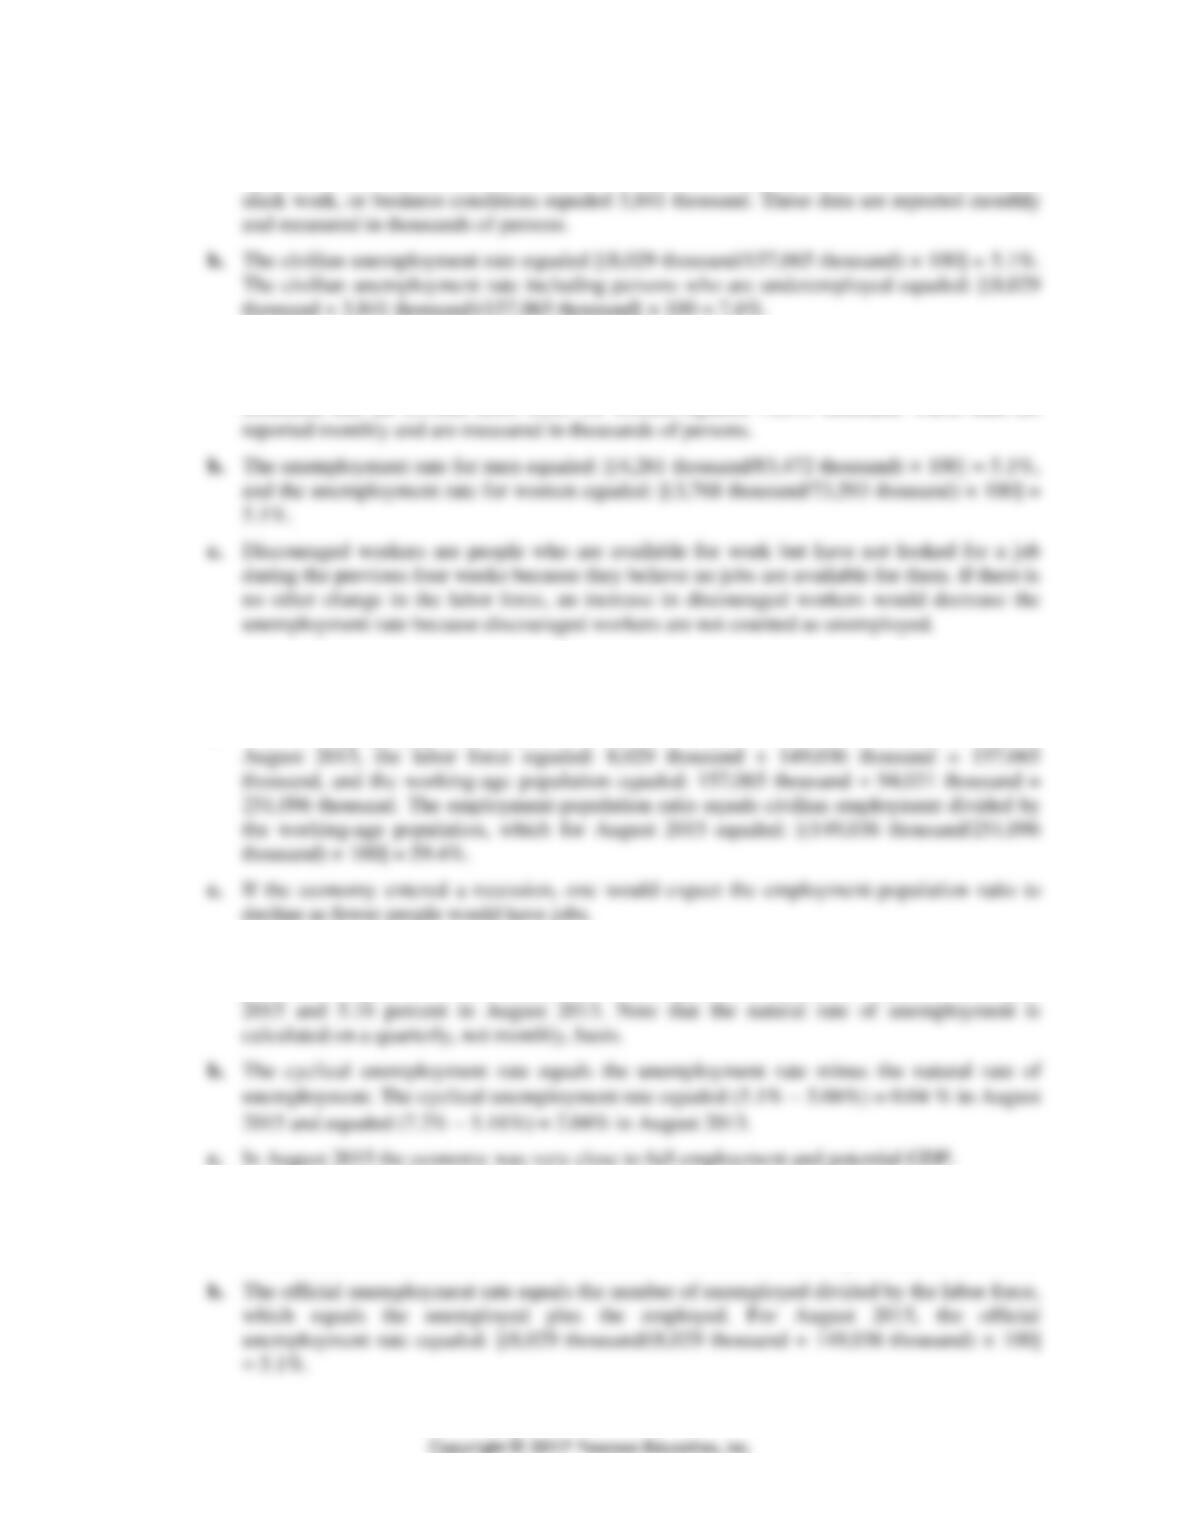
D9.3 a. and b. Data used in the graph in c. below covers the period from August 2007 to August 2015.
c.
d. The inflation rate as measured by the CPI was more volatile than the inflation rate as
D9.4 a. The CPI for food and beverages in August 2015 was 247.25, and in August 2010, it
was 219.88. The CPI for apparel in August 2015 was 126.55, and in August 2010, it was
b. The inflation rate over the entire period from August 2011 to August 2015 for food and
beverages was: [(247.25 – 229.50)/229.50] × 100 = 7.73%; for apparel, it was: [(126.55 –
CHAPTER 9 | Unemployment and Inflation 225
D9.5 a. In August 2015, the number of unemployed equaled 8,029 thousand, the civilian labor force
equaled 157,065 thousand, and workers with part-time employment for economic reasons,
D9.6 a. In August 2015, the number of unemployed men equaled 4,261 thousand, the number of
unemployed women equaled 3,768 thousand, the civilian labor force for men equaled 83,472
thousand, and the civilian labor force for women equaled 73,593 thousand. These data are
D9.7 a. In August 2015, the number of unemployed equaled 8,029 thousand, civilian employment
equaled 149,036 thousand, and those not in the labor force equaled 94,031 thousand.
b. The working-age population equals the labor force plus those not in the labor force. In
D9.8 a. The civilian unemployment rate equaled 5.1 percent in August 2015, and it equaled 7.2
percent in August 2013. The natural rate of unemployment equaled 5.06 percent in August
D9.9 a. In August 2015, the number of unemployed equaled 8,029 thousand, civilian employment
equaled 149,036 thousand, employment level – part-time for economic reasons equaled 6,483
thousand, and not in the labor force, searched for work and available equaled 1,812 thousand.
226 CHAPTER 9 | Unemployment and Inflation
c. This broader measure of the unemployment rate would include as unemployed the three
categories of unemployed: unemployed; employed but part-time for economic reasons; and
D9.10 a. In August 2015, the 3-month Treasury bill interest rate equaled 0.07 percent and the
University of Michigan inflation expectation equaled 2.8 percent.
D9.11 a. In August 2015 the CPI equaled 238.316 and average hourly earnings of private production
and nonsupervisory employees equaled $21.07, and in August 2014 the CPI equaled 237.852
and average hourly earnings equaled $20.68.