CHAPTER 9 | Unemployment and Inflation
Brief Chapter Summary and Learning Objectives
9.1 Measuring the Unemployment Rate, the Labor Force Participation Rate,
and the Employment-Population Ratio (pages 658–667)
9.2 Types of Unemployment (pages 667–670)
9.3 Explaining Unemployment (pages 670–672)
Explain what factors determine the unemployment rate.
9.4 Measuring Inflation (pages 672–676)
Define the price level and the inflation rate and understand how they are computed.
▪ The price level measures the average prices of goods and services in the economy. The
inflation rate is the percentage increase in the price level from one year to the next.
9.5 Using Price Indexes to Adjust for the Effects of Inflation (pages 676–678)
9.6 Nominal Interest Rates versus Real Interest Rates (pages 678–680)
9.7 Does Inflation Impose Costs on the Economy? (pages 680–683)
Discuss the problems that inflation causes.
▪ When the inflation rate is different from the expected inflation rate some people gain and
some people lose.
196 CHAPTER 9 | Unemployment and Inflation
Key Terms
Consumer price index (CPI), p. 673. A
measure of the average change over time in the
prices a typical urban family of four pays for the
goods and services they purchase.
Efficiency wage, p. 672. An above-market wage
that a firm pays to increase workers’
productivity.
Employed, p. 658. In government statistics,
someone who currently has a job or who is
temporarily away from his or her job.
Frictional unemployment, p. 668. Short-term
unemployment that arises from the process of
matching workers with jobs.
Menu costs, p. 681. The costs to firms of
changing prices.
Natural rate of unemployment, p. 669. The
normal rate of unemployment, consisting of
Producer price index (PPI), p. 676. An average
of the prices received by producers of goods and
services at all stages of the production process.
Real interest rate, p. 678. The nominal interest
rate minus the inflation rate.
Structural unemployment, p. 669.
Unemployment that arises from a persistent
mismatch between the skills or attributes of
workers and the requirements of jobs.
Unemployed, p. 658. In government statistics,
Chapter Outline
Why Is JPMorgan Chase Laying Off Workers?
Many workers lost their jobs during the 2007–2009 recession and the banking industry was hit especially
hard. JPMorgan Chase, the largest bank in the United States, saw its profit decline by two-thirds from 2007
CHAPTER 9 | Unemployment and Inflation 197
9.1
Measuring the Unemployment Rate, the Labor Force Participation Rate,
and the Employment-Population Ratio (pages 658–667)
Learning Objective: Define the unemployment rate, the labor force participation rate,
and the employment-population ratio and understand how they are computed.
A. The Household Survey
Each month the U.S. Bureau of the Census conducts the Current Population Survey to collect data needed
to compute the monthly unemployment rate. The Department of Labor’s Bureau of Labor Statistics (BLS)
B. Problems with Measuring the Unemployment Rate
The unemployment rate is not a perfect measure of the current state of joblessness. During a recession, an
increase in the number of discouraged workers occurs, but these workers are not counted as unemployed.
C. Trends in Labor Force Participation
The labor force participation rate determines the amount of labor that will be available to the economy
from a given population. The higher the labor force participation rate, the more labor will be available and
D. Unemployment Rates for Different Groups
Different groups in the population can have very different unemployment rates. For example, in August
2015, Asians had a lower unemployment rate, and African Americans had a higher unemployment rate,
than the overall rate.
E. How Long Are People Typically Unemployed?
In the modern U.S. economy, the typical unemployed person stays unemployed for a relatively brief
F. The Establishment Survey: Another Measure of Employment
The BLS uses the establishment survey, sometimes called the payroll survey, to measure total
employment in the economy. This monthly survey samples about 300,000 business establishments to
provide information on the total number of persons who are employed and on a company payroll. Despite
198 CHAPTER 9 | Unemployment and Inflation
some drawbacks, the establishment survey has the advantage of being determined by actual payrolls. In
recent years, some economists have come to rely more on establishment survey data than on household
survey data in analyzing current labor market conditions.
G. Revisions in the Establishment Survey Employment Data: How Bad Was the
2007–2009 Recession?
To avoid long waits in supplying data, such as the employment data from the establishment survey, to
H. Job Creation and Job Destruction over Time
The U.S. economy creates and destroys millions of jobs every year. The creation and destruction of jobs
Teaching Tips
The end of the chapter in the main text includes a special category of exercises titled Real-Time Data
Exercises. These exercises help students become familiar with a key data source, learn how to locate data,
Extra Making
the
Connection
How Unusual Was the Unemployment Situation Following the
2007–2009 Recession?
The Great Depression of the 1930s left its mark on nearly everyone who lived through it. The Depression
began in August 1929, became worse after the stock market crash in October 1929, and reached its lowest
point in 1933, following the collapse of the banking system. Real GDP fell by more than 25 percent
CHAPTER 9 | Unemployment and Inflation 199
had already declined to 7.2 percent. In contrast, after the recession of 2007–2009, the unemployment rate
peaked at 10.0 percent in October 2009, while 18 months later it had declined by only 1 percentage point
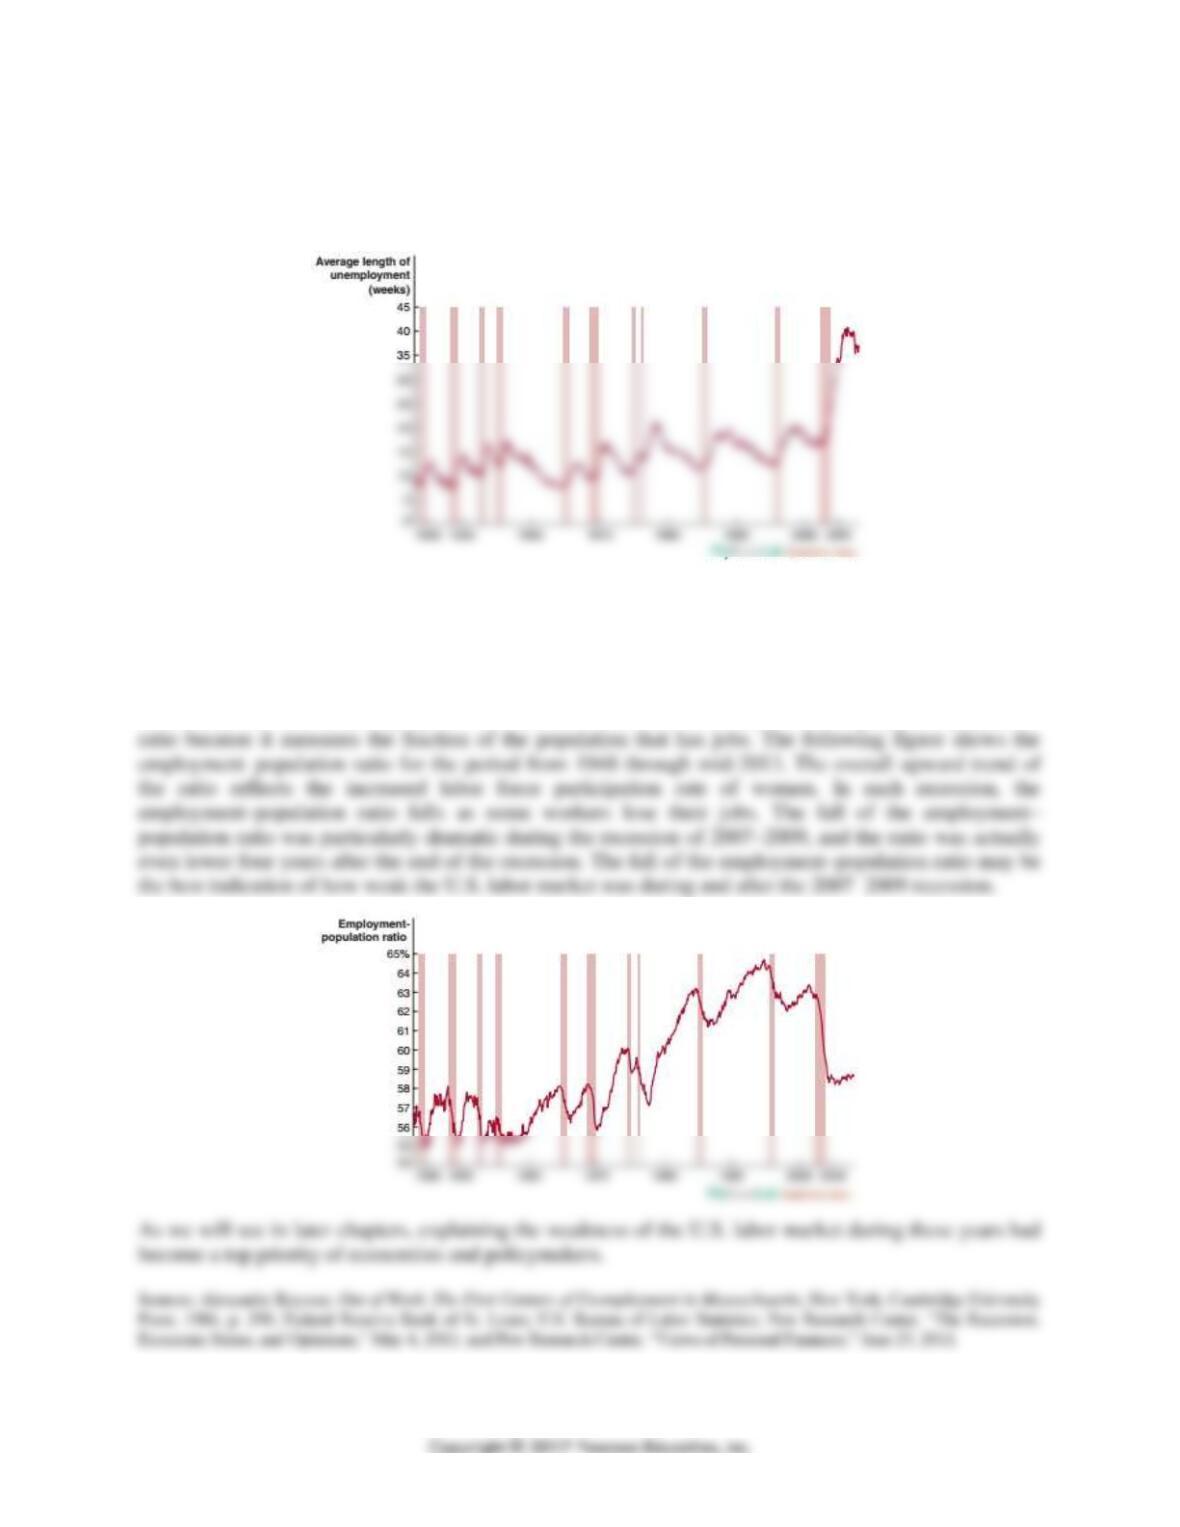
to 9.0 percent. The following figure shows that the average period of unemployment was twice as high
following the 2007–2009 recession as following any other recession since the end of World War II.
Unemployment was so persistent and widespread that a survey taken by the Pew Research Center in the
spring of 2011 found that more than half of all households had experienced at least one member losing his
or her job during the previous year. Another Pew survey taken in June 2011 found that more than half of
people with jobs expected to receive a pay cut or to lose their job during the next year. As we have seen,
one drawback to the unemployment data is that workers who drop out of the labor market are no longer
counted by the BLS as unemployed. As a result, some economists focus on the employment–population
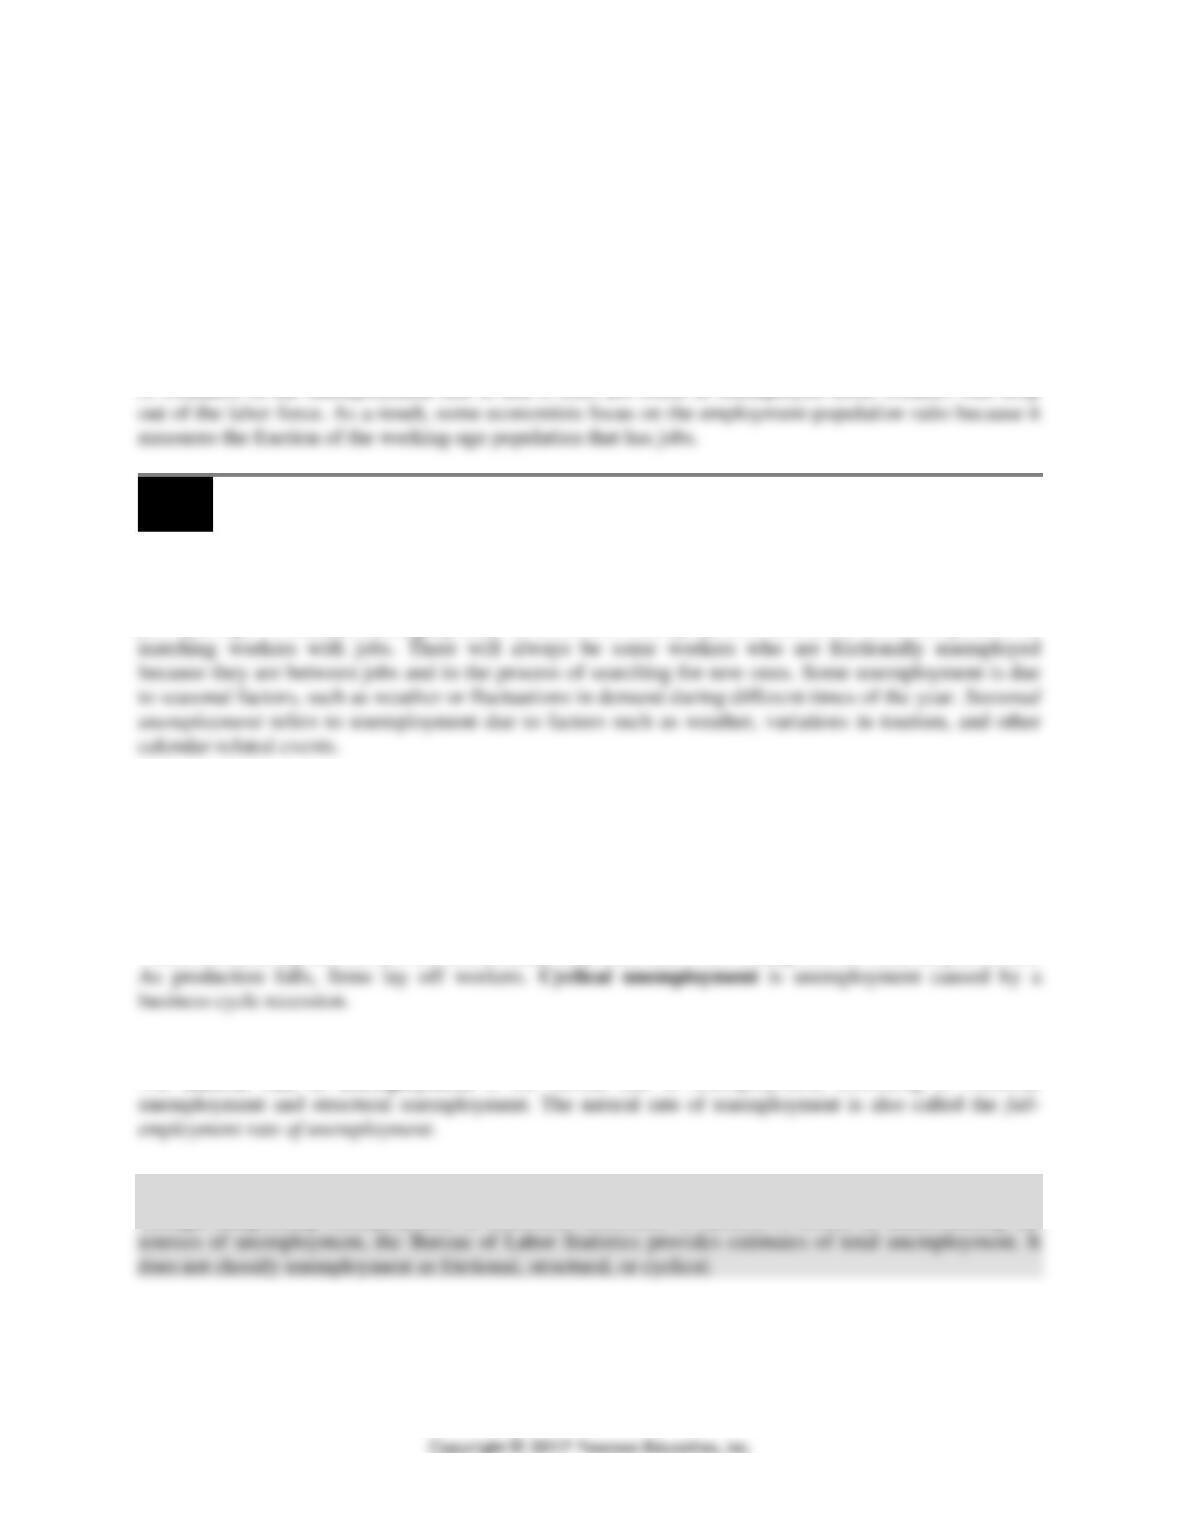
200 CHAPTER 9 | Unemployment and Inflation
Question
An article published in the New York Times in July 2011 argued: “For the second straight year, the
recovery in the job market has essentially stalled. This chart, showing the share of adults with jobs, offers
the best summary you’ll find.” The “share of adults with jobs” is known more formally as the
employment–population ratio. Why might the employment–population ratio provide the “best summary”
of the state of the job market rather than the unemployment rate?
Source: David Leonhardt, “Overly Optimistic, Once Again,” New York Times, July 8, 2011.
Answer
A weakness of the unemployment rate is that it does not count as unemployed those workers who drop
9.2
Types of Unemployment (pages 667–670)
Learning Objective: Identify the three types of unemployment.
A. Frictional Unemployment and Job Search
Most workers spend time engaging in a job search, and most firms spend time searching for people to fill
job openings. Frictional unemployment is short-term unemployment that arises from the process of
B. Structural Unemployment
Structural unemployment is unemployment that arises from a persistent mismatch between the skills or
attributes of workers and the requirements of jobs. This type of unemployment can last for longer periods
than frictional unemployment because workers need time to learn new skills.
C. Cyclical Unemployment
When the economy moves into recession, many firms find their sales falling and cut back on production.
D. Full Employment
The natural rate of unemployment is the normal rate of unemployment, consisting of frictional
Teaching Tips
Though categorizing unemployment as frictional, structural, or cyclical is useful in understanding the
CHAPTER 9 | Unemployment and Inflation 201
Extra Solved Problem 9.2
Reasons for Unemployment
Some of the data the Bureau of Labor Statistics collects regarding the reasons people are unemployed
appear in the following table (numbers are in thousands, not seasonally adjusted).
Unemployment
Reason for Unemployment
Year
Rate
(%)
Number
Job Losers
Job
Leavers
Reentrants
New
Entrants
Total
On
Layoff
Other
2008
5.8
8,924
4,789
1,176
3,614
896
2,472
766
2009
9.3
14,265
9,160
1,630
7,530
882
3,187
1,035
2010
9.6
14,825
9,250
1,431
7,819
889
3,466
1,220
2011
8.9
8,106
1,230
6,876
956
3,401
1,284
2012
8.1
12,506
6,877
1,183
5,694
967
3,345
1,316
2013
7.4
6,073
1,136
4,937
932
3,207
1,247
2014
6.2
4,878
1,007
3,831
824
2,829
1,086
Source: U.S. Department of Labor, Bureau of Labor Statistics. www.bls.gov.
a. Calculate the percentage of the unemployed who lost their jobs (Job Losers) and the percentage
that left their jobs (Job Leavers) from 2008 to 2014.
b. Calculate the percentage of the unemployed who were unemployed as the result of entering the
labor force, either for the first time or as reentrants, from 2008 to 2014.
Solving the Problem
Step 1: Review the chapter material.
Step 2: Calculate the percentage of the unemployed who lost their jobs and the percentage
that left their jobs from 2008 to 2014.
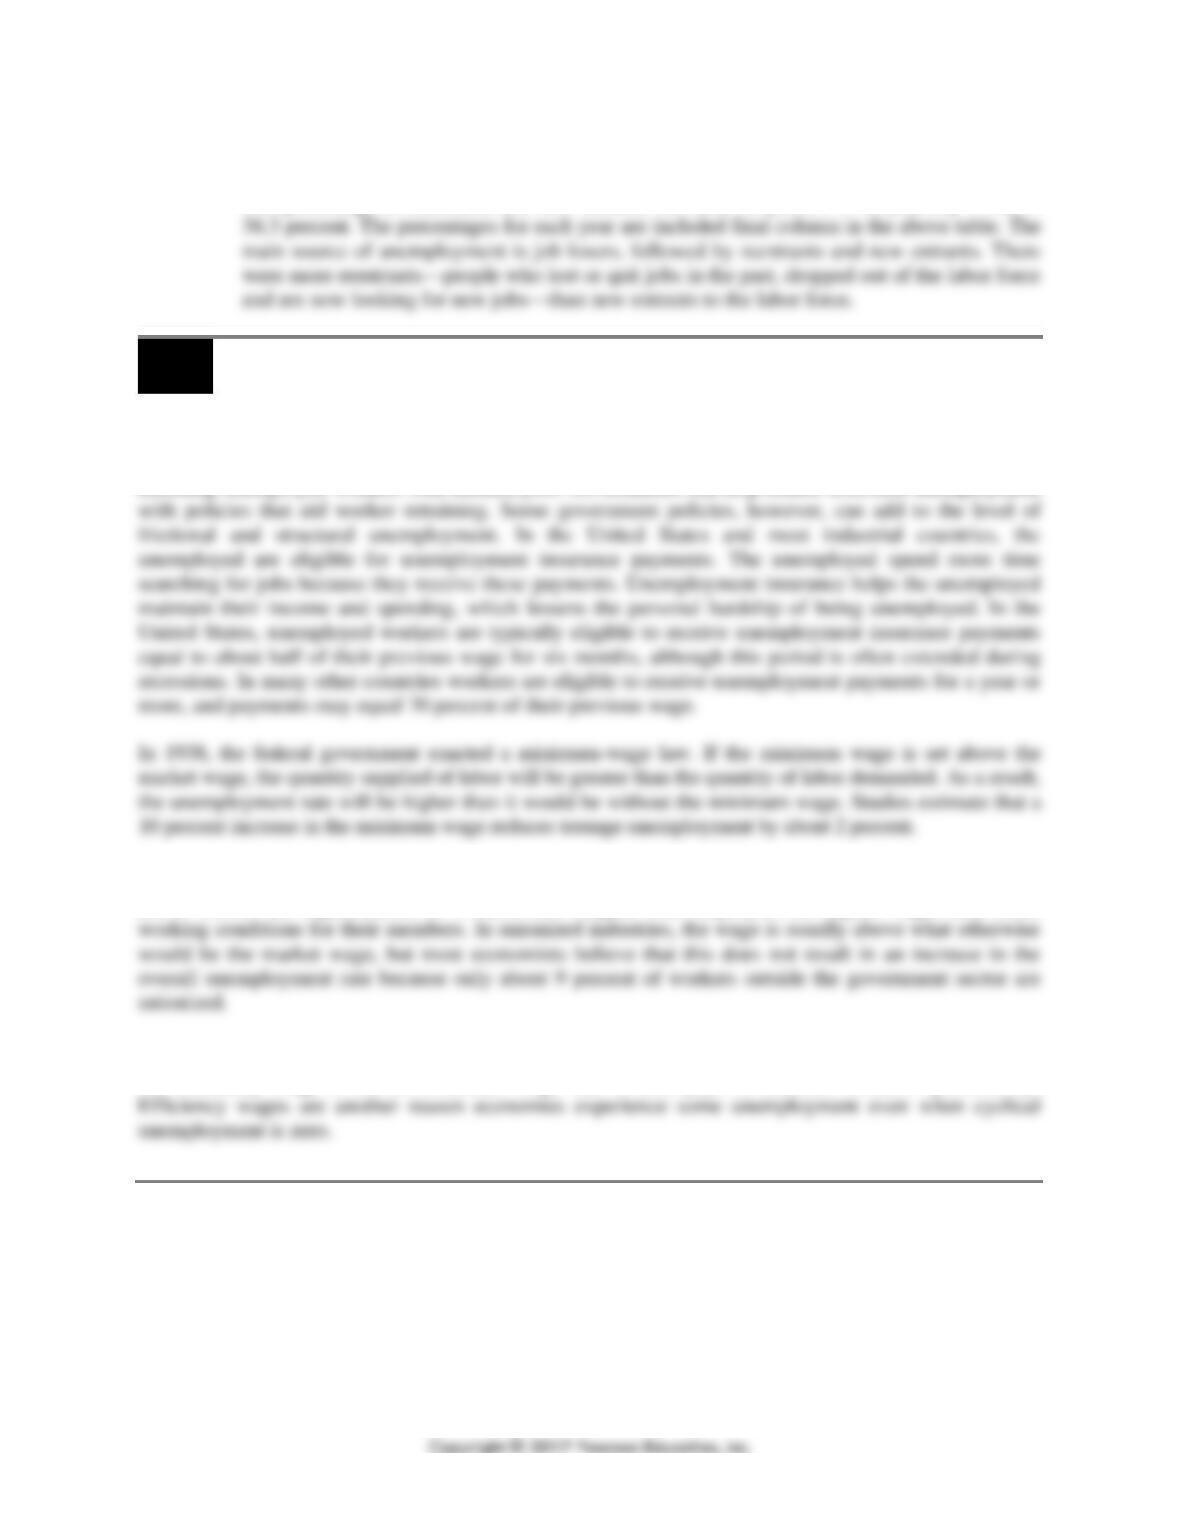
The percentage of “job losers,” for example in 2008, can be calculated as: (4,789/8,924)
202 CHAPTER 9 | Unemployment and Inflation
Step 3: Calculate the percentage of the unemployed who were unemployed as the result
of entering the labor force from 2008 to 2014.
The percentage of reentrants and new entrants for 2008 is: [(2,472 + 766)/8,924]
100 =
9.3
Explaining Unemployment (pages 670–672)
Learning Objective: Explain what factors determine the unemployment rate.
A. Government Policies and the Unemployment Rate
Governments can reduce the level of frictional unemployment with policies that speed up the process of
matching unemployed workers with unfilled jobs. Governments can help reduce structural unemployment
B. Labor Unions
Labor unions are organizations of workers that bargain with employers for higher wages and better
C. Efficiency Wages
An efficiency wage is an above-market wage that a firm pays to increase workers’ productivity.
Extra Solved Problem 9.3
The Graying of the Unemployment Rate
The unemployment rate changes not only as the number of unemployed workers changes (the numerator
of the unemployment rate formula), but also as the size of the labor force changes (the denominator of the
unemployment rate formula). As the textbook notes, there has been a dramatic increase in the number of
women in the labor force since the late 1940s. The participation rate among adult women increased from
CHAPTER 9 | Unemployment and Inflation 203
There are several reasons why many workers today retire earlier than in years past. First, many boomers
have greater disposable incomes than people in other age groups and choose to use this income to
consume more leisure. Second, career advancement becomes more difficult after age 40. Third, over
Solving the Problem
Step 1: Review the chapter material.
Step 2: What effect will the retirement of baby boomers will have on the unemployment
rate?
Holding other factors that affect the labor force constant, as baby boomers retire, the
Step 3: Explain whether the size of the labor force can increase despite the retirement of
older workers.
It is possible, but unlikely, that the labor force will increase due to the retirement of older
9.4
Measuring Inflation (pages 672–676)
Learning Objective: Define the price level and the inflation rate and understand how
they are computed.
The price level is a measure of the average prices of goods and services in the economy. The inflation
rate is the percentage increase in the price level from one year to the next. The GDP deflator is the
broadest measure of the price level, but to know the impact of inflation on the typical household, the
deflator can be misleading. Changes in the consumer price index come closest to measuring changes in
the cost of living as experienced by the typical household.
204 CHAPTER 9 | Unemployment and Inflation
A. The Consumer Price Index
To obtain prices of a representative group of goods and services, the BLS surveys 30,000 households on
The CPI is sometimes called the cost-of-living index.
B. Is the CPI Accurate?
The CPI is the most widely used measure of inflation. It is important that the CPI be as accurate as
C. The Producer Price Index
In addition to the GDP deflator and the CPI, the government also computes the producer price index
(PPI), which is an average of the prices received by producers of goods and services at all stages of the
production process. Changes in the PPI can give an early warning of future movements in the CPI.
Extra Solved Problem 9.4
Calculating the CPI
The consumer price index (CPI) compares the cost of a market basket of goods in a given year with the
cost of the same market basket in the base year. Suppose that a market basket includes (1) admission for
two to a local theatre for a weekend movie, (2) a large box of popcorn at the theatre, (3) a large pepperoni
pizza (carry-out from a local pizzeria), and (4) a two-liter bottle of diet Coke.
Year
Theatre
Admission
for One
Person
Popcorn
Pizza
Diet
Coke
1
$5.00
$2.00
$12.00
$1.25
3
Solving the Problem
Step 1: Review the chapter material.
CHAPTER 9 | Unemployment and Inflation 205
Step 2: Determine the value of the market basket.
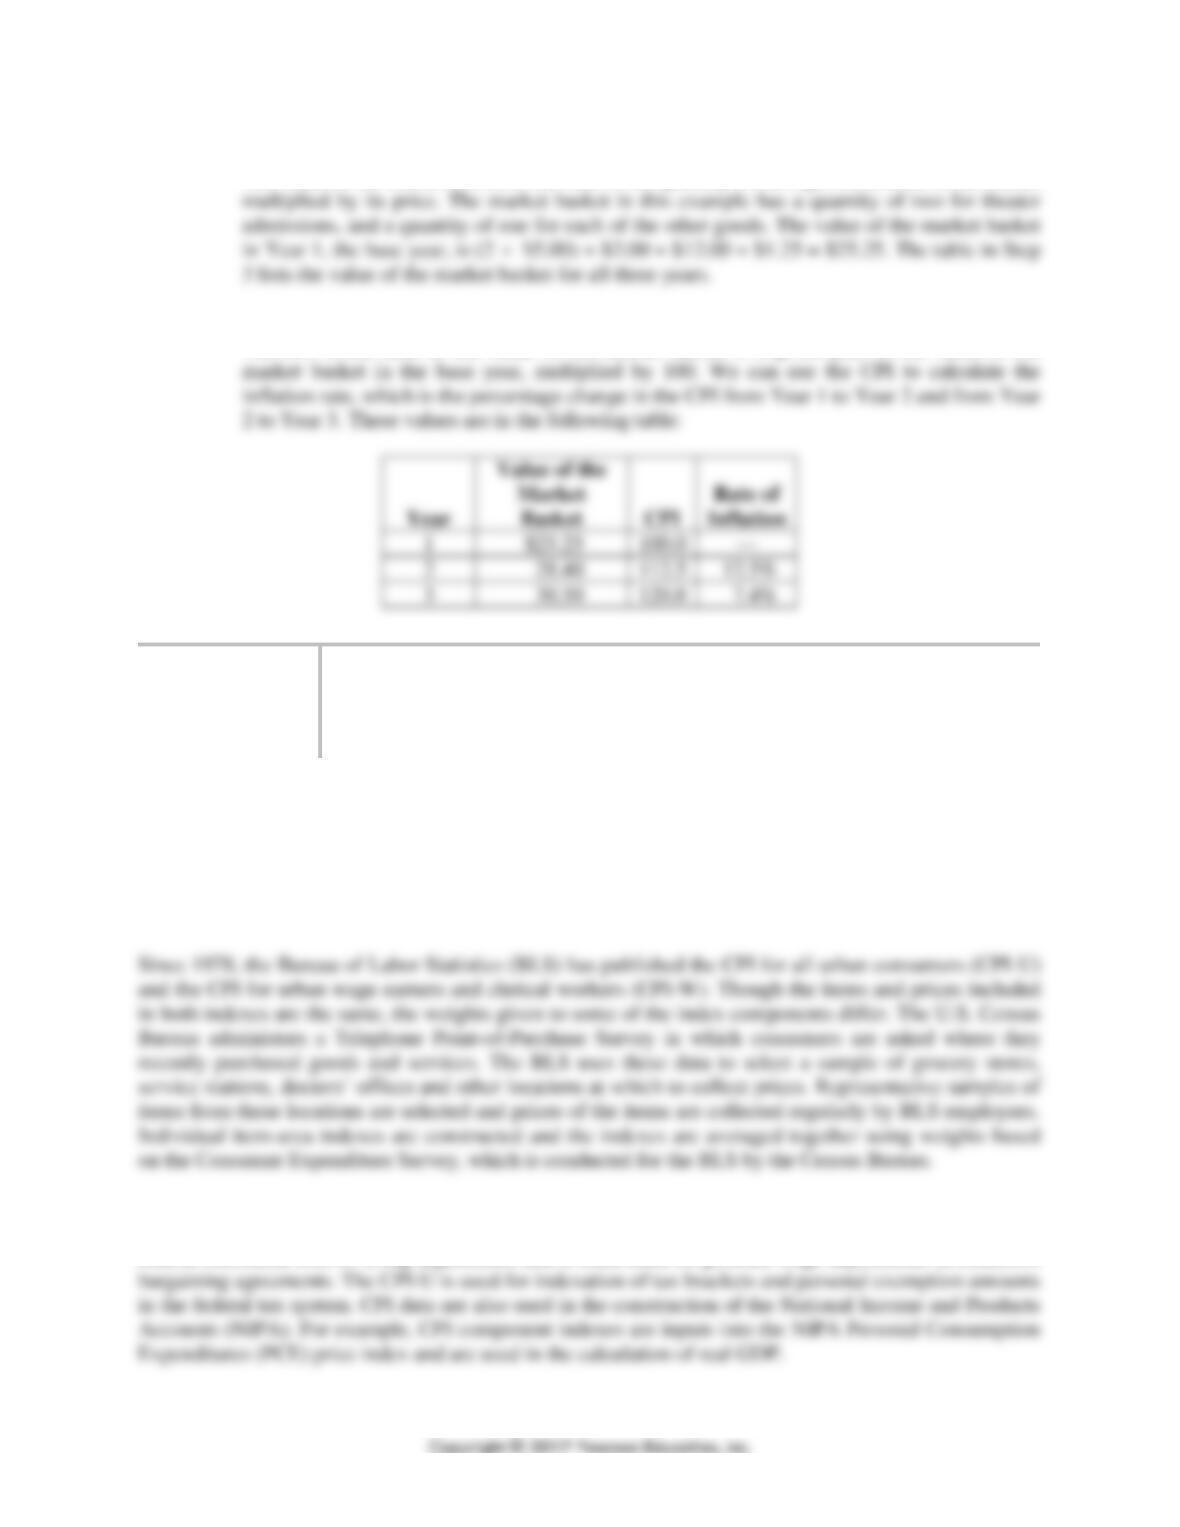
The value of the market basket is the sum of the quantity of each good included in the basket
Step 3: Calculate the value of the CPI and the inflation rates for Years 2 and 3.
The CPI is the ratio of the value of the market basket in a given year to the value of the
Extra Making
the
Connection
Explaining How the CPI Measures the Price Level and Rate of
Inflation
There are many misconceptions about how the consumer price index (CPI) is constructed and exactly
what it measures. Economists John Greenlees and Robert McCelland addressed these misconceptions in
an article published in the Monthly Labor Review. They explain that “…when prices change, the goal of
the CPI is to measure the percentage by which consumers would have to increase their spending to be as
well off with the new prices as they were with the old prices…” The following information regarding the
CPI and its construction are taken from the Greenlees and McCelland article.
The all-items CPI-U is the CPI that is reported most widely, but the CPI-U and the CPI-W are both used
to make cost-of-living adjustments. The CPI-W is the index used to make annual Social Security and
federal retirement cost-of-living adjustments and is often used for periodic wage adjustments in collective
206 CHAPTER 9 | Unemployment and Inflation
In 2002, the BLS began publishing the chained Consumer Price Index for urban consumers (C-CPI-U).
This more closely approximates a cost-of-living index by reflecting consumer substitution among item
categories. Over time, some goods and services consumers commonly bought are replaced by new goods
and services. Adjustments to the CPI must be made to avoid having a shrinking market basket that is
unrepresentative of what consumers are buying. For many food items, the substitution is facilitated
9.5
Using Price Indexes to Adjust for the Effects of Inflation (pages 676–678)
Learning Objective: Use price indexes to adjust for the effects of inflation.
Price indexes give us a way of adjusting for the effects of inflation so that we can compare dollar values
Extra Solved Problem 9.5
Calculating Real Wages at Caterpillar
In 2013, Caterpillar and the United Steelworkers Union signed a labor contract that froze the wages of
caterpillar workers for six years. In 2013, the average wage at Caterpillar was about $27 per hour and the
Solving the Problem
Step 1: Review the chapter material.
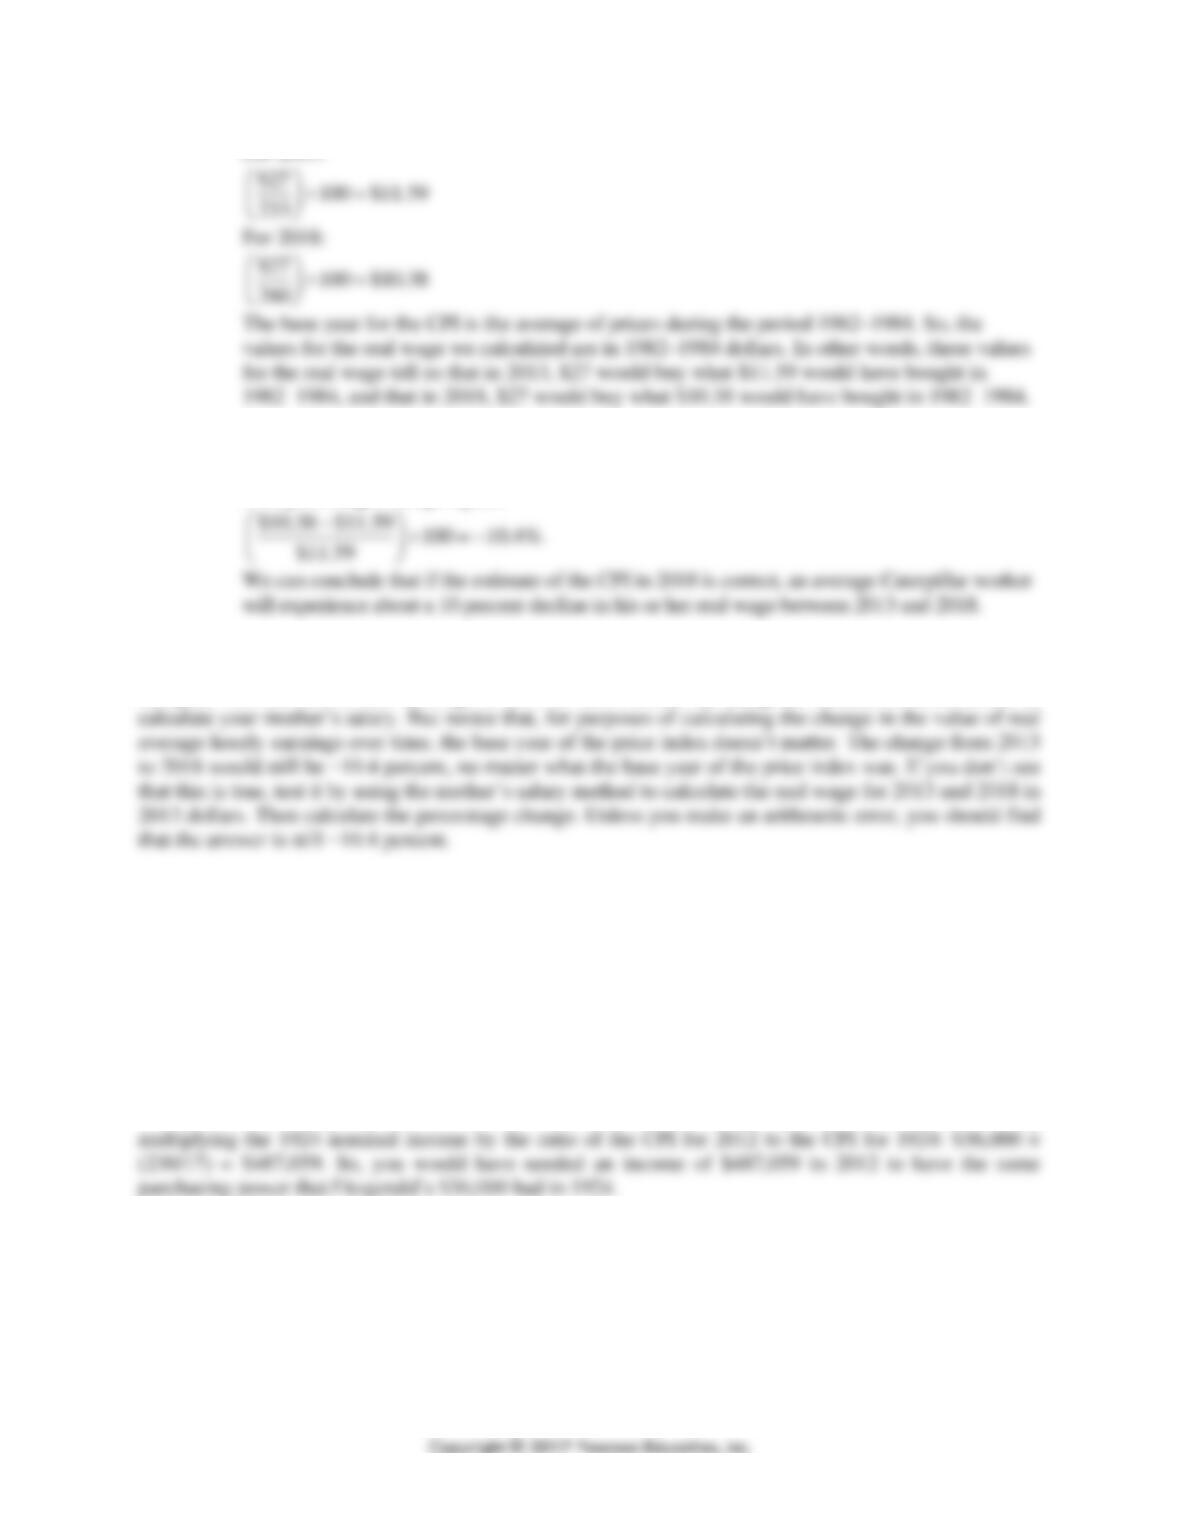
This problem is about using price indexes to correct for the effects of inflation, so you may
CHAPTER 9 | Unemployment and Inflation 207
Step 3: Complete the answer by calculating the percentage change in the real wage
Caterpillar workers will receive.
This percentage change equals:
Extra Credit: The values we computed for the real wages Caterpillar workers earn are measured in
1982–1984 dollars. Because this period is more than 30 years ago, the values are somewhat difficult to
interpret. We can convert the earnings to 2013 or 2018 dollars by using the method we used earlier to
Question
In 1924, the famous novelist F. Scott Fitzgerald wrote an article for the Saturday Evening Post titled
“How to Live on $36,000 a Year,” in which he wondered how he and his wife had managed to spend all
of that very high income without saving any of it. The CPI in 1924 was 17, and the CPI in 2012 was 230.
What income would you have needed in 2012 to have had the same purchasing power that Fitzgerald’s
$36,000 had in 1924? Be sure to show your calculation.
Source: F. Scott Fitzgerald, “How to Live on $36,000 a Year,” Saturday Evening Post, April 5, 1924.
Answer
We can convert Fitzgerald’s 1924 nominal income of $36,000 to an equivalent income in 2012 by
Question
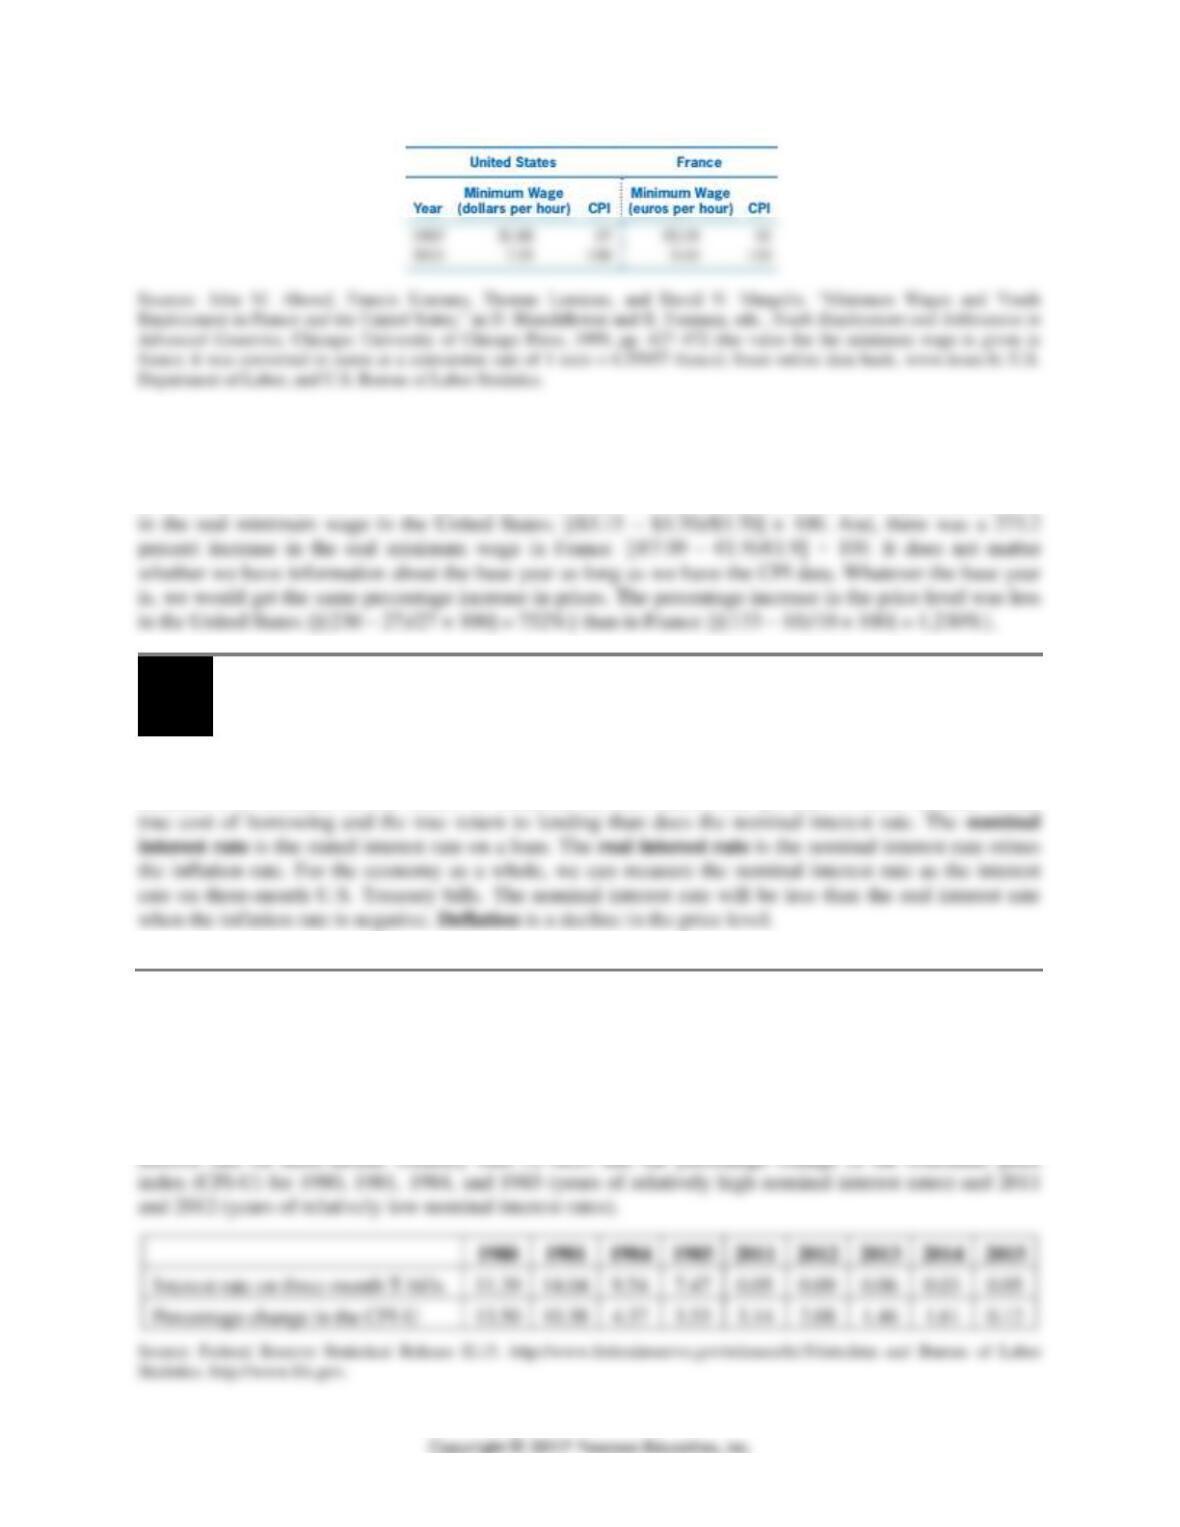
Use the information in the table in the next column to determine the percentage changes in the U.S. and
French real minimum wages between 1957 and 2012. Does it matter for your answer that you have not
been told the base year for the U.S. CPI or the French CPI? Was the percentage increase in the price level
greater in the United States or in France during these years?
208 CHAPTER 9 | Unemployment and Inflation
Answer
In the United States, the real minimum wage in 1957 was $3.70: [($1.00/27) × 100], and in 2012 it was
$3.15: [($7.25/230) 100]. In France, the real minimum wage in 1957 was €1.9: [(€0.19/10) × 100], and in
2012 it was €7.09: [(9.43/133) × 100]. Therefore, between 1957 and 2012, there was a 14.9 percent decrease
9.6
Nominal Interest Rates versus Real Interest Rates (pages 678–680)
Learning Objective: Distinguish between the nominal interest rate and the real interest
rate.
The difference between nominal and real values is important when money is being borrowed and lent.
Because it is corrected for the effects of inflation, the real interest rate provides a better measure of the
Extra Solved Problem 9.6
Computing the Real Rate of Interest
The real interest rate is defined as the nominal interest rate minus the inflation rate. The textbook uses the
three-month interest rate on U.S. Treasury bills (short-term loans investors make to the federal
government) as a measure of the nominal interest rate. The table below contains the average annual
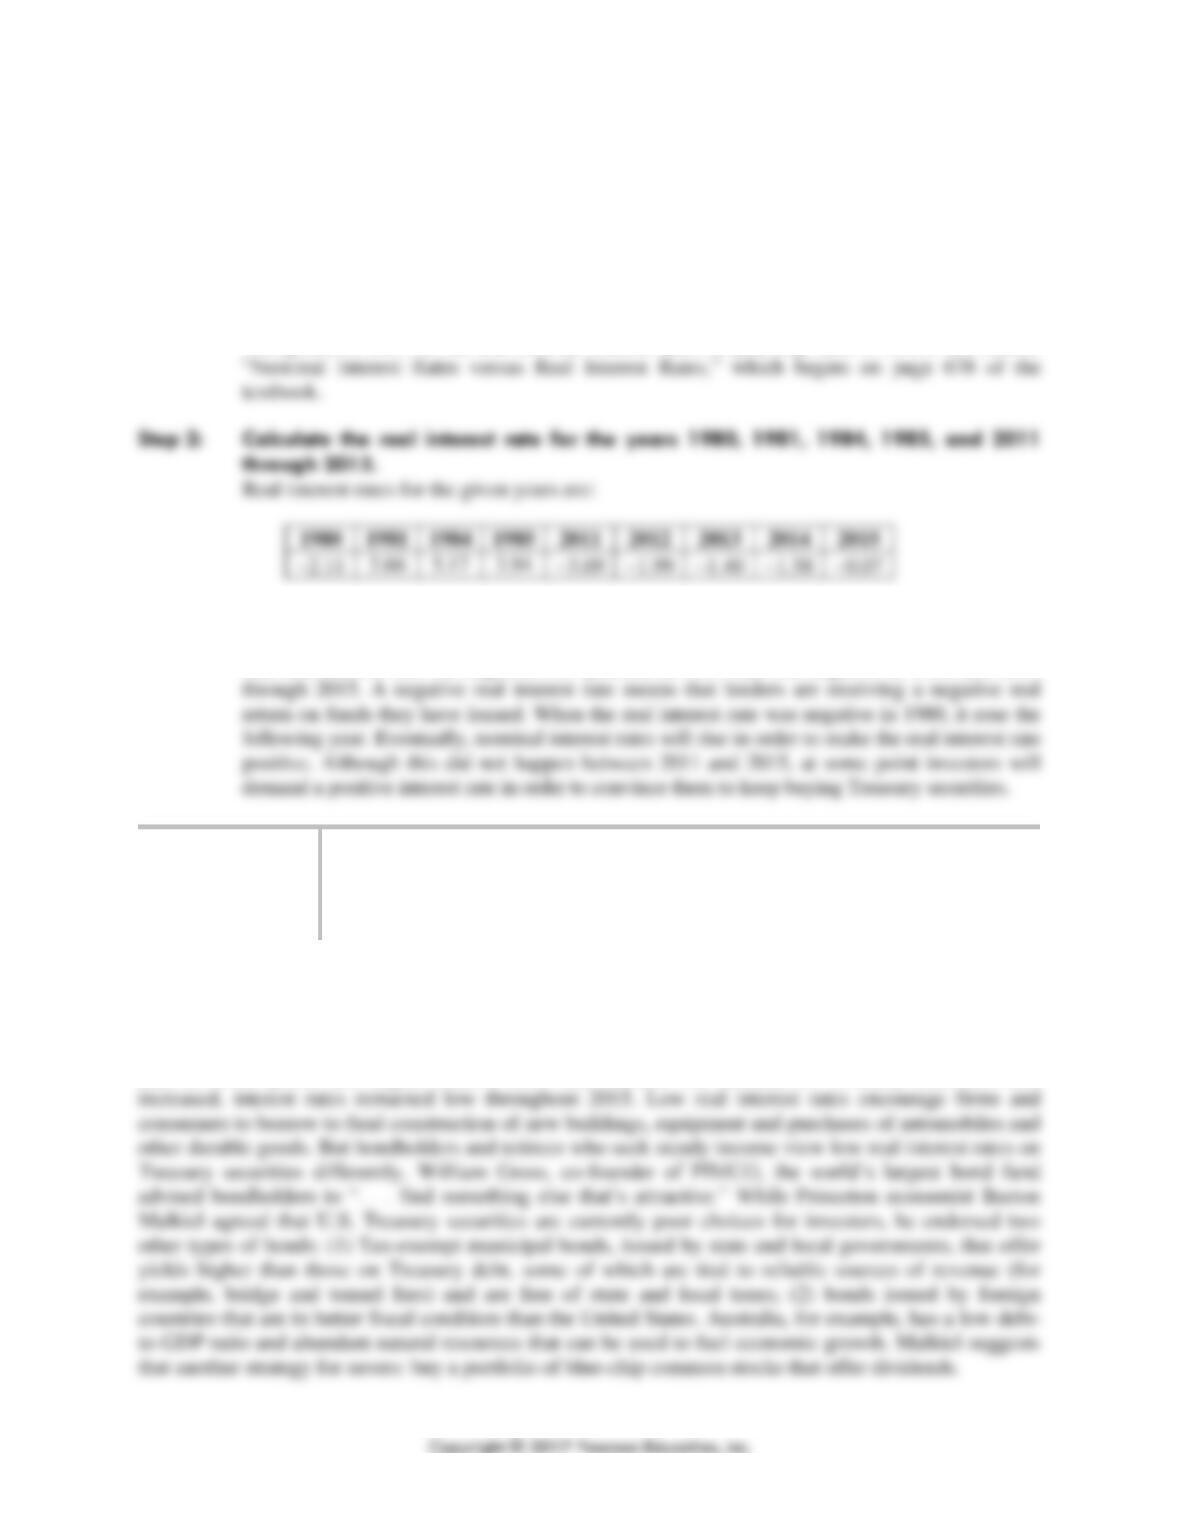
CHAPTER 9 | Unemployment and Inflation 209
a. What was the real interest rate in the years 1980, 1981, 1984, 1985, 2011, and 2012?
b. In which of these years was the real interest highest? In which years was the real interest rate
negative?
Solving the Problem
Step 1: Review the chapter material.
This problem refers to real and nominal interest rates, so you may want to review the section
Step 3: In which of these years was the real interest rate highest? In which years was the
real interest rate negative?
The real interest rate was highest, 5.17 percent, in 1984 and was negative in 1980 and 2011
Extra Making
the
Connection
Low Real Interest Rates on Treasury Debt Force Investors to
Consider Alternatives
The federal government’s deficit declined from $1.4 trillion in fiscal year (October 1–September 30) 2009
to $439 billion in fiscal year 2015. Although the size of deficit fell, the total national debt climbed to over
$19 trillion in 2016. The U.S. Treasury has to sell hundreds of billions of dollars in securities annually to
pay interest on this debt. Holding the demand constant, an increase in supply of Treasury securities will
lead to lower prices and higher interest rates. But because the demand for Treasury securities also
210 CHAPTER 9 | Unemployment and Inflation
9.7
Does Inflation Impose Costs on the Economy? (pages 680–683)
Learning Objective: Discuss the problems that inflation causes.
A. Inflation Affects the Distribution of Income
Although inflation does not reduce the affordability of goods and services to the average consumer, it still
imposes costs on the economy. Inflation affects the distribution of income. Some people will find their
B. The Problem with Anticipated Inflation
When inflation is anticipated, its main costs are that paper money loses value. Anyone holding paper
money will find its purchasing power decreasing each year by the rate of inflation. To avoid this cost,
C. The Problem with Unanticipated Inflation
When people borrow money or banks lend money, they must forecast the rate of inflation so they can
calculate the real rate of interest on a loan. When the actual inflation rate turns out to be different from the
expected rate, some people gain, and other people lose. This apparently unfair redistribution is a key
reason why people dislike unanticipated inflation.
Extra Making
the
Connection
How What’s So Bad about Falling Prices?
When the rate of inflation is higher than expected it can cause problems for consumers, workers, and
firms. But what if an economy begins to experience falling prices—deflation, rather than inflation? A