
Chapter 9
interactive activity
Long-Run Economic
Growth
1. The accompanying table shows data from the World Bank, World Development
Indicators, for real GDP per capita in 2010 U.S. dollars for Argentina, Ghana,
South Korea, and the United States for 1960, 1980, 2000, and 2015.
Year
Argentina Ghana South Korea United States
Real GDP
per capita
(2010
dollars)
Percentage of
Real
GDP per
capita
(2010
dollars)
Percentage of
Real
GDP per
capita
(2010
dollars)
Percentage of
Real
GDP per
capita
(2010
dollars)
Percentage of
1960
real
GDP
per
capita
2015
real
GDP
per
capita
1960
real
GDP
per
capita
2015
real
GDP
per
capita
1960
real
GDP
per
capita
2015
real
GDP
per
capita
1960
real
GDP
per
capita
2015
real
GDP
per
capita
1960 $5,853 ? ? $1,053 ? ? $1,103 ? ? $17,037 ? ?
2015 12,128 ? ? 1,696 ? ? 25,023 ? ? 51,486 ? ?
a. Complete the table by expressing each year’s real GDP per capita as a percent-
age of its 1960 and 2015 levels.
b. How does the growth in living standards from 1960 to 2015 compare across
these four nations? What might account for these differences?
1. a. The accompanying table shows each nation’s real GDP per capita in terms of
its 1960 and 2015 levels.
Year
Argentina Ghana South Korea United States
Real GDP
per capita
(2010
dollars)
Percentage of
Real
GDP per
capita
(2010
dollars)
Percentage of
Real
GDP per
capita
(2010
dollars)
Percentage of
Real
GDP per
capita
(2010
dollars)
Percentage of
1960
real
GDP
per
capita
2015
real
GDP
per
capita
1960
real
GDP
per
capita
2015
real
GDP
per
capita
1960
real
GDP
per
capita
2015
real
GDP
per
capita
1960
real
GDP
per
capita
2015
real
GDP
per
capita
2000 8,544 146.0 70.4 975 92.6 57.5 15,105 1369.4 60.4 45,056 264.5 87.5
2015 12,128 207.2 100.0 1,696 161.0 100.0 25,023 2268.6 100.0 51,486 302.2 100.0
b. South Korea experienced the greatest increase in living standards from 1960
to 2015; in 2015 it produced 2,270% ($25,023/$1,103 × 100) of what it produced
in 1960. Argentina experienced only a modest growth in living standards
over the same period, and Argentina’s path was less consistent than that of
Ghana. Compared with real GDP per capita in 1960, the United States in
Solution

S-122 Chapter 9 Long-Run Economic gRowth
underinvestment in education, political instability, and irresponsible govern–
2. The following table shows the average annual growth rate in real GDP per capita
for Argentina, Ghana, and South Korea using data from the World Bank, World
Development Indicators, for the past few decades.
Years
Average annual growth rate of
real GDP per capita
Argentina Ghana South Korea
1965–1975 1.92% −1.13% 8.29%
1975–1985 −1.42 −2.29 7.08
a. For each 10-year period and for each country, use the Rule of 70 where
possible to calculate how long it would take for that country’s real GDP per
capita to double.
2. a. The accompanying table shows the number of years it would take for real
GDP per capita to double according to the Rule of 70 using the average
annual growth rate in real GDP per capita per decade in each country. Values
corresponding to years with negative growth rates are left uncalculated
because we cannot apply the Rule of 70 to a negative growth rate.
Years
Years for real GDP per capita to
double according to the Rule of 70
Argentina Ghana South Korea
b. If each nation continues to grow as it did from 2005–2015, real GDP per capita
will have doubled in Argentina by 2037, in Ghana by 2030, and in South Korea
by 2038.
Solution
Chapter 9 Long-Run Economic gRowth S-123
3. The following table provides approximate statistics on per capita income levels
and growth rates for regions defined by income levels. According to the Rule
of 70, starting in 2015 the high-income countries are projected to double their
per capita GDP in approximately 70 years, in 2085. Throughout this question,
assume constant growth rates for each of the regions are equal to their average
value between 2000 and 2015.
Region
Real GDP per
capita (2015)
Average annual growth
rate of real GDP per
capita (2000–2015)
High-income countries $41,038 1.0%
Middle-income countries 4,584 4.4
Low-income countries 588 2.3
Data from: World Bank.
a. Calculate the ratio of per capita GDP in 2015 of the following:
i. Middle-income to high-income countries
b. Calculate the number of years it will take the low-income and middle-income
countries to double their per capita GDP.
c. Calculate the per capita GDP of each of the regions in 2085. (Hint: How many
times does their per capita GDP double in 70 years, the number of years from
2015 to 2085?)
3. a. i. The ratio of per capita GDP in 2015 of middle-income to high-income
countries is 0.112 or 11.2%.
ii. The ratio of per capita GDP in 2015 of low-income to high-income
countries is 0.014 or 1.4%.
b. Middle-income countries are projected to take 70/4.4 = 15.9, or approxi-
mately 16 years to double their per capita GDP, and low-income countries are
projected to take 30 years.
c. With a real GDP per capita growth rate of 1.0%, it will take 70/1 = 70 years for
GDP to double. Therefore, high-income countries are projected to double their
d. Using the projected per capita GDP figures in 2085, the percentages are as
follows:
i. Middle-income to high-income countries: 0.894 or 89.4%
e. Both the low-income countries and the middle-income countries (as defined
in 2015) have improved their per capita GDP relative to high-income countries
Solution

4. The country of Androde is currently using Method 1 for its production function.
By chance, scientists stumble onto a technological breakthrough that will
Method 1 Method 2
Physical capital
per worker
Real GDP
per worker
Physical capital
per worker
Real GDP
per worker
0 0.00 0 0.00
100 50.00 100 100.00
200 70.71 200 141.42
300 86.60300 173.21
400 100.00 400 200.00
500 111.8 0500 223.61
100. In your figure, label that point A.
b. Starting from point A, over a period of 70 years, the amount of physical capital
per worker in Androde rises to 400. Assuming Androde still uses Method 1, in
your diagram, label the resulting point of production B. Using the Rule of 70,
calculate by how many percent per year output per worker has grown.
d. As the economy of Androde moves from point A to point C, what share of the
annual productivity growth is due to higher total factor productivity?
4. a. In the accompanying diagram, the line labeled “Productivity1” shows the pro–
duction function using Method 1, and the line labeled “Productivity2” shows the
production function using Method 2. Point A is the point, using Method 1, at
which Androde produces output using 100 units of physical capital per worker.
250 300200150 400 500450350100500
250.00
150.00
50.00
Real GDP
per worker
Physical capital per worker
B
A
C
Productivity1
Productivity2
Solution

Chapter 9 Long-Run Economic gRowth S-125
b. In the accompanying diagram, Point B is the point, using Method 1, at which
Androde produces output using 400 units of physical capital per worker.
Output per worker has grown from 50 units to 100 units. Since over a period
of 70 years, output per worker has doubled, output per worker must have
grown by 1% per year.
c. In the accompanying diagram, Point C is the point, using Method 2, at which
5. The Bureau of Labor Statistics regularly releases the “Productivity and Costs”
report for the previous month. Go to www.bls.gov and find the latest report.
(On the Bureau of Labor Statistics home page, from the tab “Subjects,” select
the link to “Labor Productivity & Costs”; then, from the heading “LPC News
Releases,” find the most recent “Productivity and Costs” report.) What were the
percent changes in business and nonfarm business productivity for the previous
quarter? How does the percent change in that quarter’s productivity compare to
data from the previous quarter?
5. Answers will vary with the latest data. For the second quarter of 2016, business
6. What roles do physical capital, human capital, technology, and natural resources
play in influencing long–run economic growth of aggregate output per capita?
7. How have U.S. policies and institutions influenced the country’s long-run
economic growth?
Solution
S-126 Chapter 9 Long-Run Economic gRowth
8. Over the next 100 years, real GDP per capita in Groland is expected to grow at
an average annual rate of 2.0%. In Sloland, however, growth is expected to be
somewhat slower, at an average annual growth rate of 1.5%. If both countries
have a real GDP per capita today of $20,000, how will their real GDP per capita
differ in 100 years? [Hint: A country that has a real GDP today of $x and grows
8. If real GDP per capita in Groland grows at an average annual rate of 2.0%, real
9. The accompanying table shows data from the World Bank, World Development
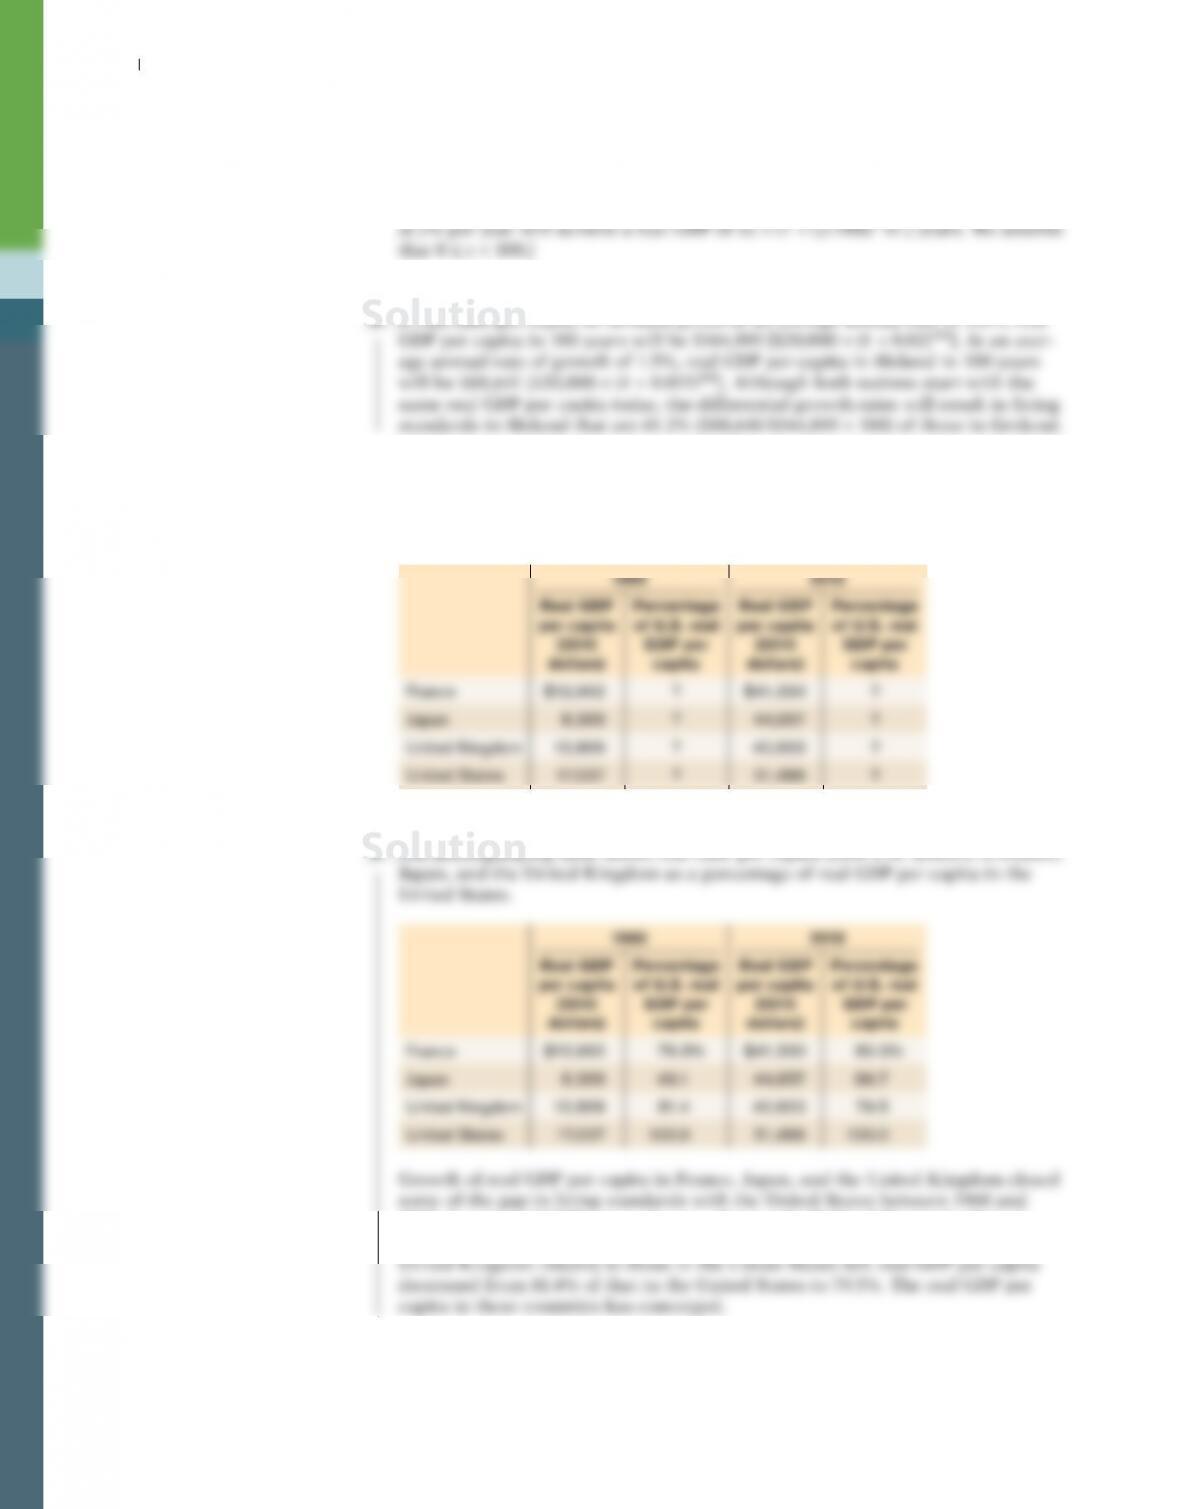
Indicators, for real GDP per capita (2010 U.S. dollars) in France, Japan, the
United Kingdom, and the United States in 1960 and 2015. Complete the table.
Have these countries converged economically?
2015. Japan’s real GDP per capita grew from only 49.1% of that in the United
States to 86.7%, and France’s rose from 76.3% to 80.3%. Living standards in the
Solution
10. The accompanying table shows data from the World Bank, World Development
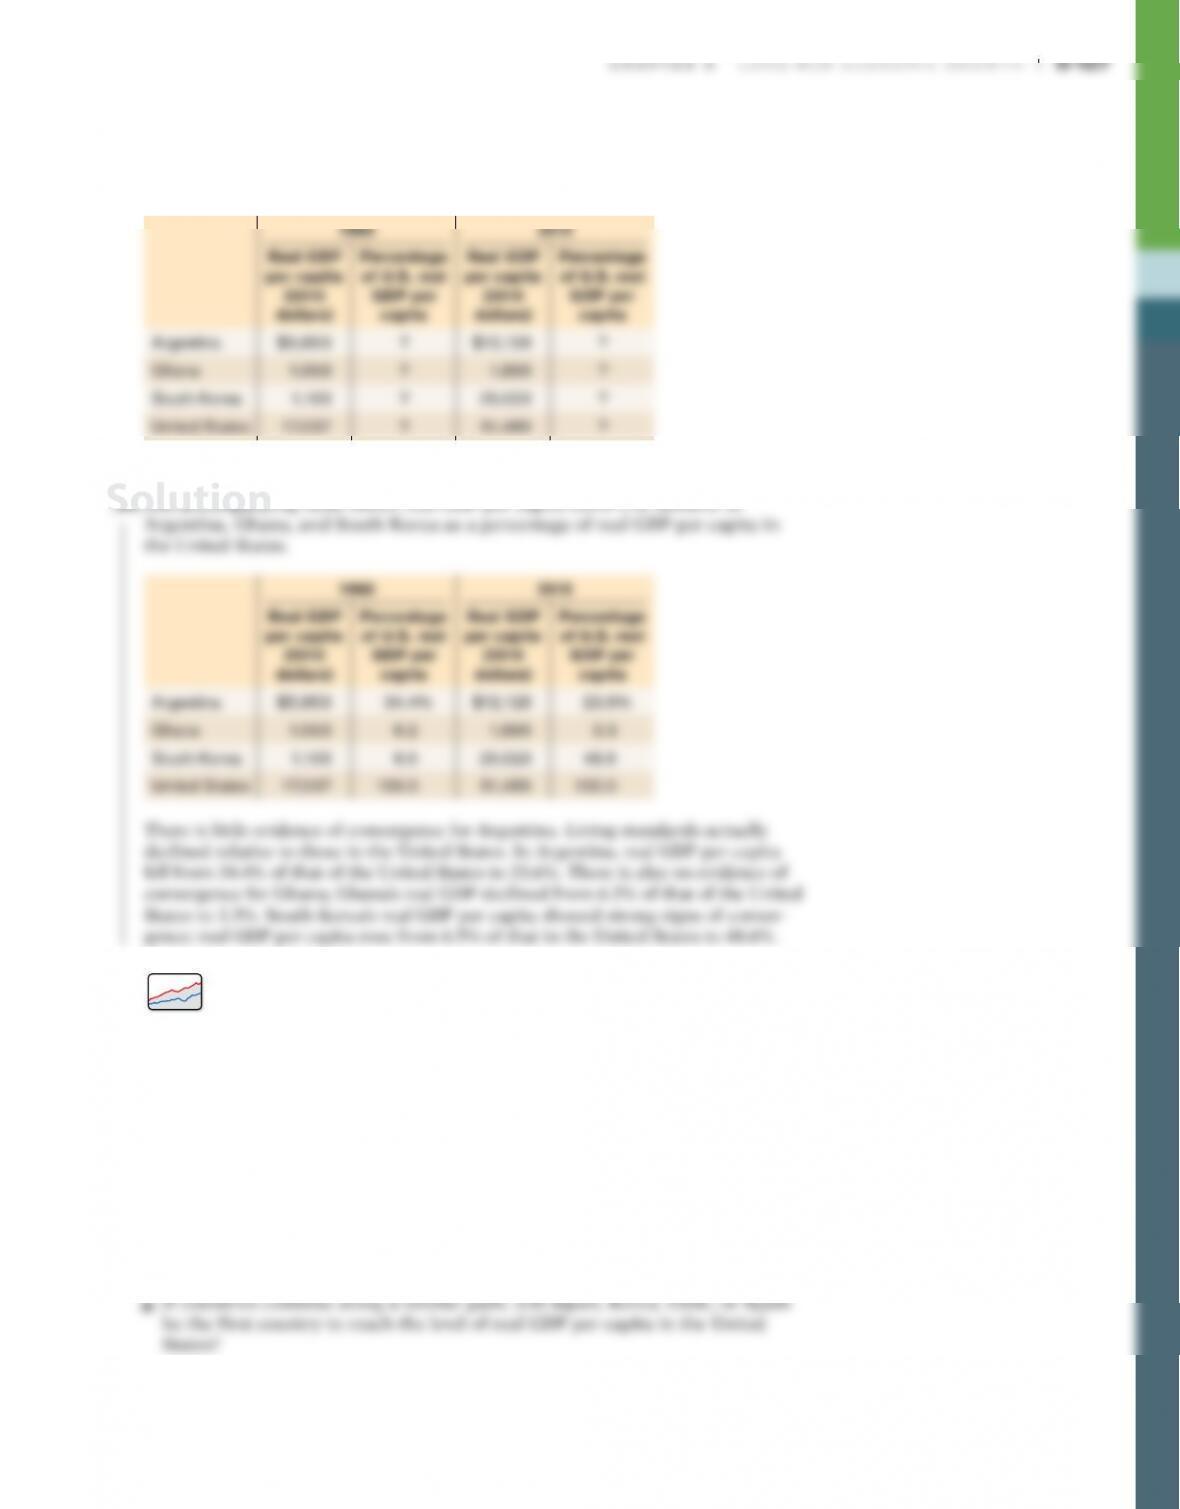
Indicators for real GDP per capita (2010 U.S. dollars) for Argentina, Ghana,
South Korea, and the United States in 1960 and 2015. Complete the table. Have
these countries converged economically?
11. Access the Discovering Data exercise for Chapter 9 online to answer the
following questions.
a. What was the ratio of Japanese GDP per capita relative to the United States in
1950 and 1991?
b. Why has Japan’s GDP converged to that of the United States?
c. Rank the country in order of richest to poorest (with 1 being the richest) in
1960 and 2010?
d. What was the ratio of GDP per capita for Spain relative to the United States in
1960 and 2010?
e. Which two countries experienced the fastest rate of convergence from 1960
through 2010?
f. Why are lower income countries, like Korea in 1960, able to grow faster than
rich countries?
12. Why would you expect real GDP per capita in California and Pennsylvania to
exhibit convergence but not in California and Baja California, a state of Mexico
that borders the United States? What changes would allow California and Baja
California to converge?
12. According to the conditional convergence hypothesis, other things equal,
13. According to the U.S. Energy Information Administration, the proven oil
reserves existing in the world in 2015 consisted of 1,663 billion barrels. In that
year, the U.S. Energy Information Administration reported that the world daily
oil production was 80.58 million barrels a day.
a. At this rate, for how many years will the proven oil reserves last? Discuss the
Malthusian view in the context of the number you just calculated.
b. In order to do the calculations in part a, what did you assume about the
total quantity of oil reserves over time? About oil prices over time? Are these
assumptions consistent with the Malthusian view on resource limits?
Solution
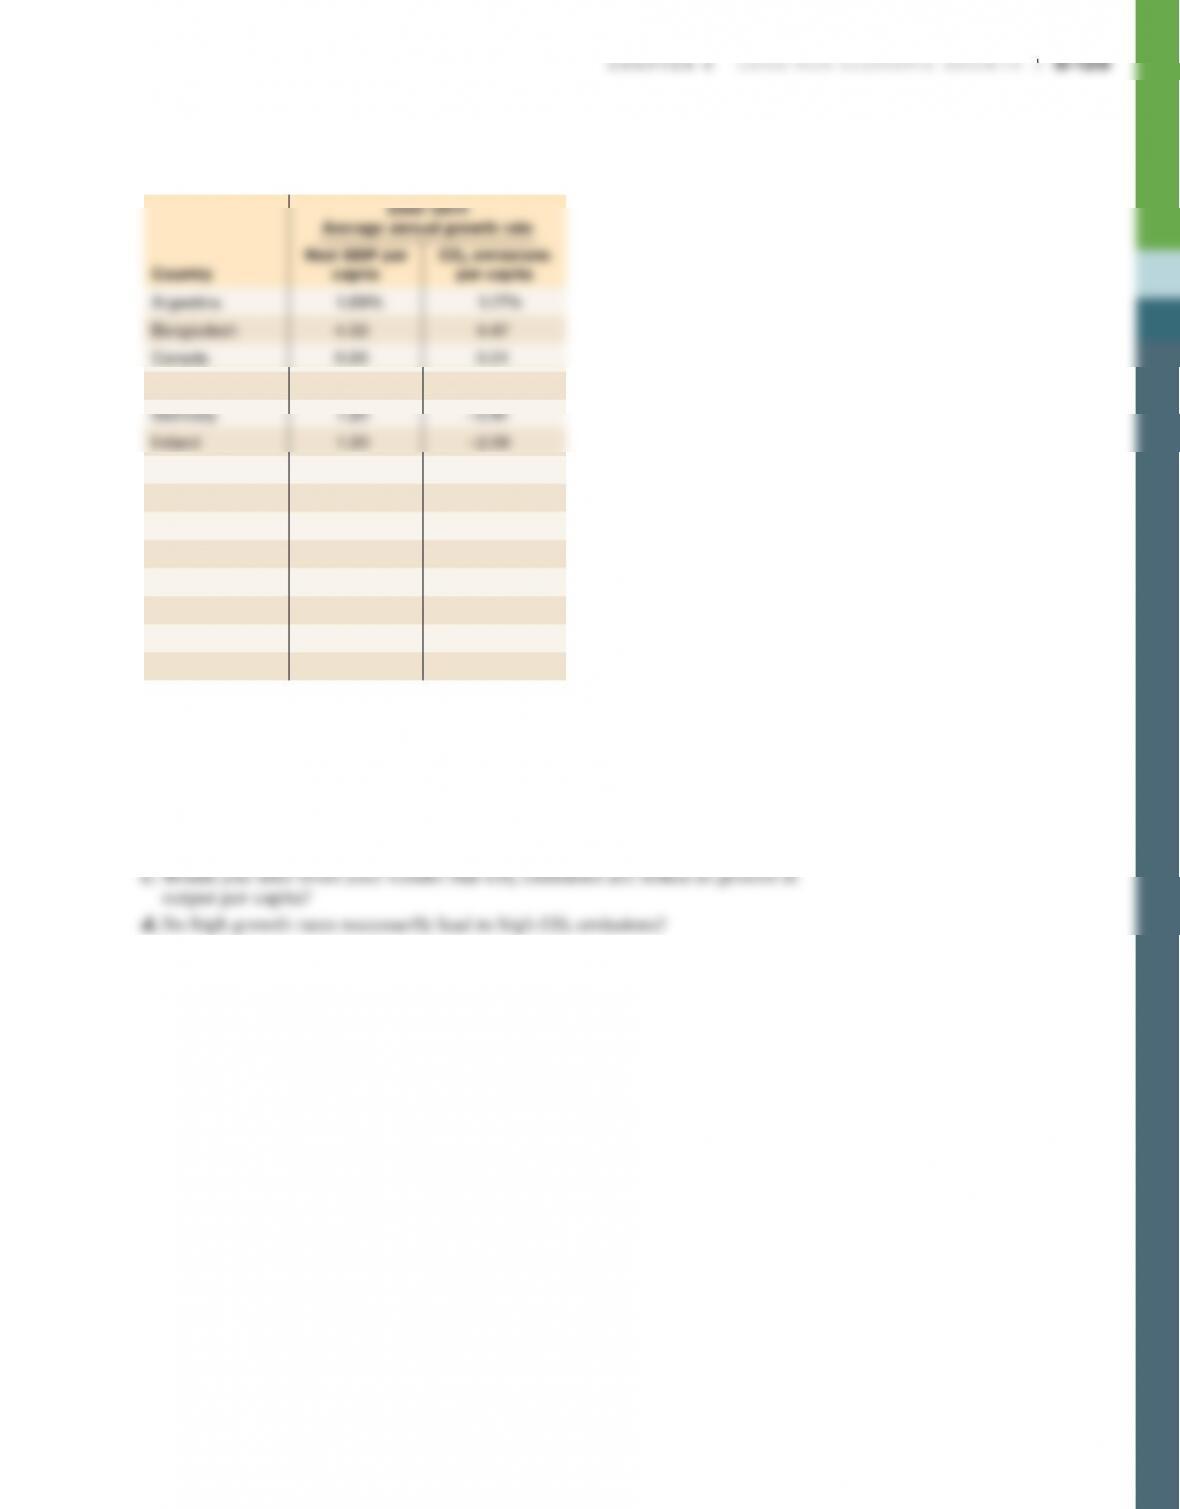
14. The accompanying table shows the annual growth rate for the years 2000–2014
in per capita emissions of carbon dioxide (CO2) and the annual growth rate in
real GDP per capita for selected countries.
2000–2014
Average annual growth rate
Real GDP per
CO2 emissions
China 9.24 7.48
Japan 0.70 0.11
South Korea 3.51 2.32
Mexico 0.67 −0.42
Nigeria 5.03 −1.30
Russia 4.16 1.35
South Africa 1.64 −0.02
United Kingdom 1.02 −2.20
United States 0.85 −1.27
Data from: Energy Information Administration; World Bank.
a. Rank the countries in terms of their growth in CO2 emissions, from highest to
lowest. What five countries have the highest growth rate in emissions? What
five countries have the lowest growth rate in emissions?
b. Now rank the countries in terms of their growth in real GDP per capita, from
highest to lowest. What five countries have the highest growth rate? What five
countries have the lowest growth rate?
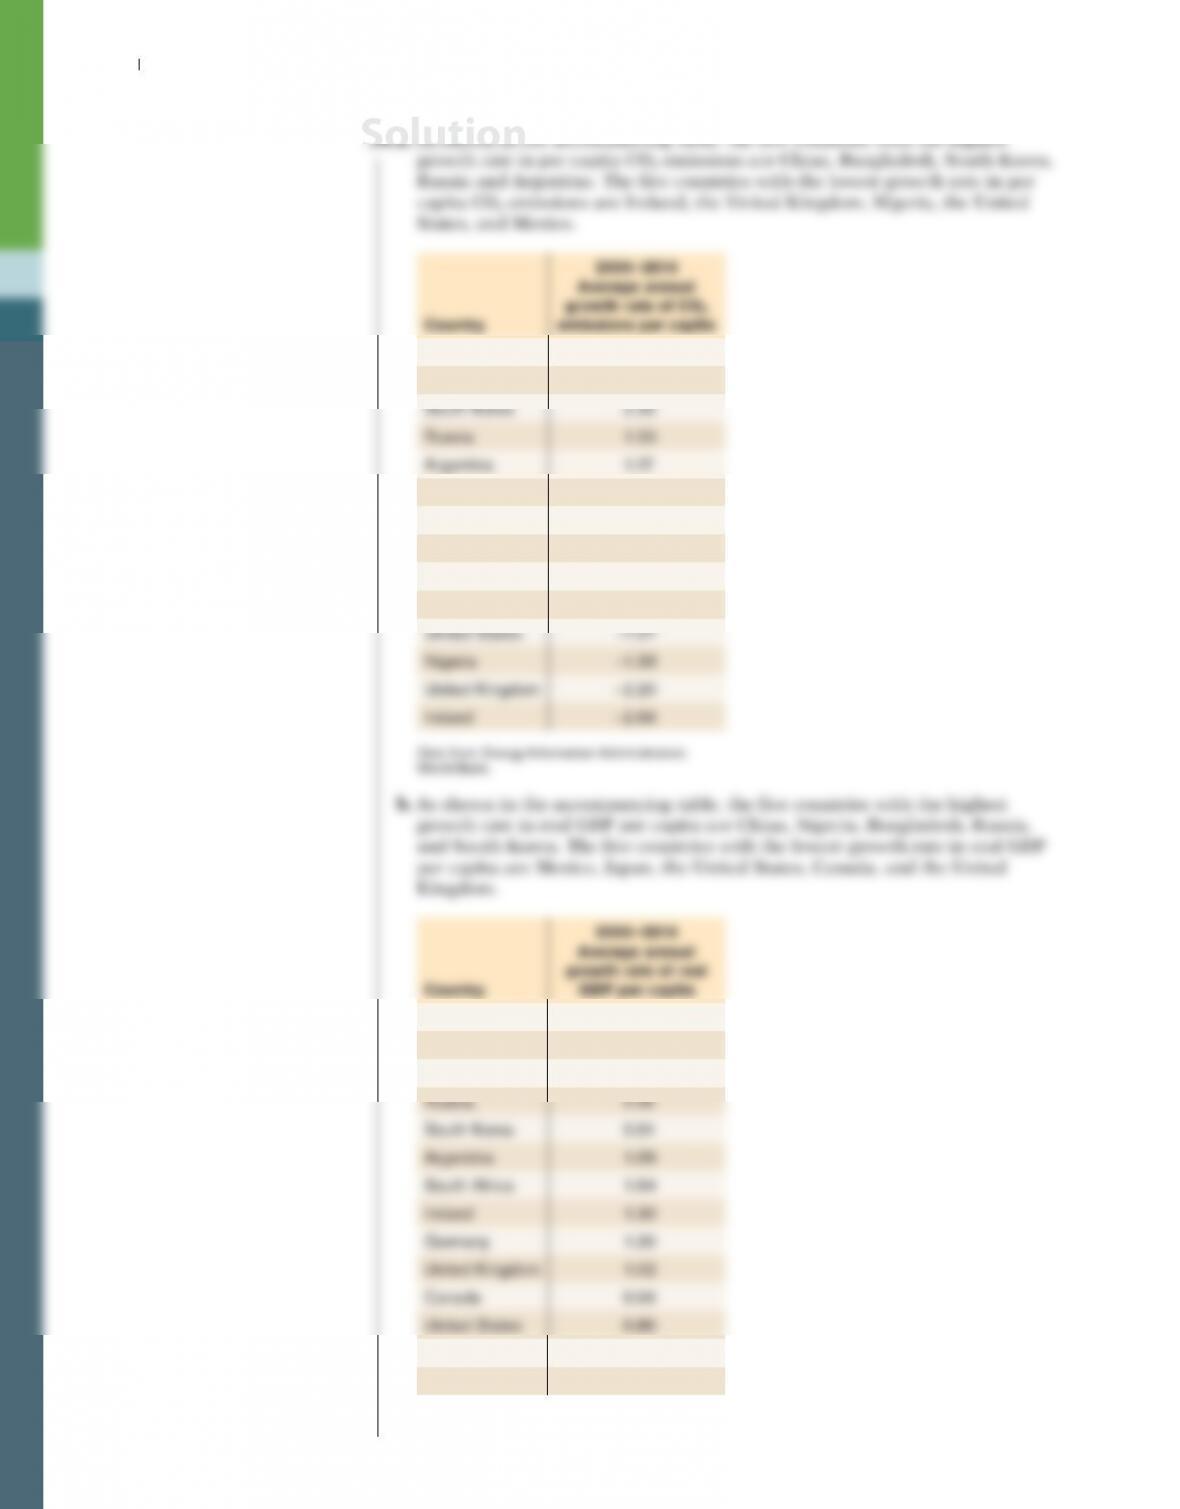
S-130 Chapter 9 Long-Run Economic gRowth
China 7.48%
Bangladesh 4.47
Japan 0.11
Canada 0.01
South Africa −0.02
Germany −0.41
Mexico −0.42
China 9.24%
Nigeria 5.03
Bangladesh 4.33
Japan 0.70
Mexico 0.67
Data from: Energy Information Administration;
World Bank.
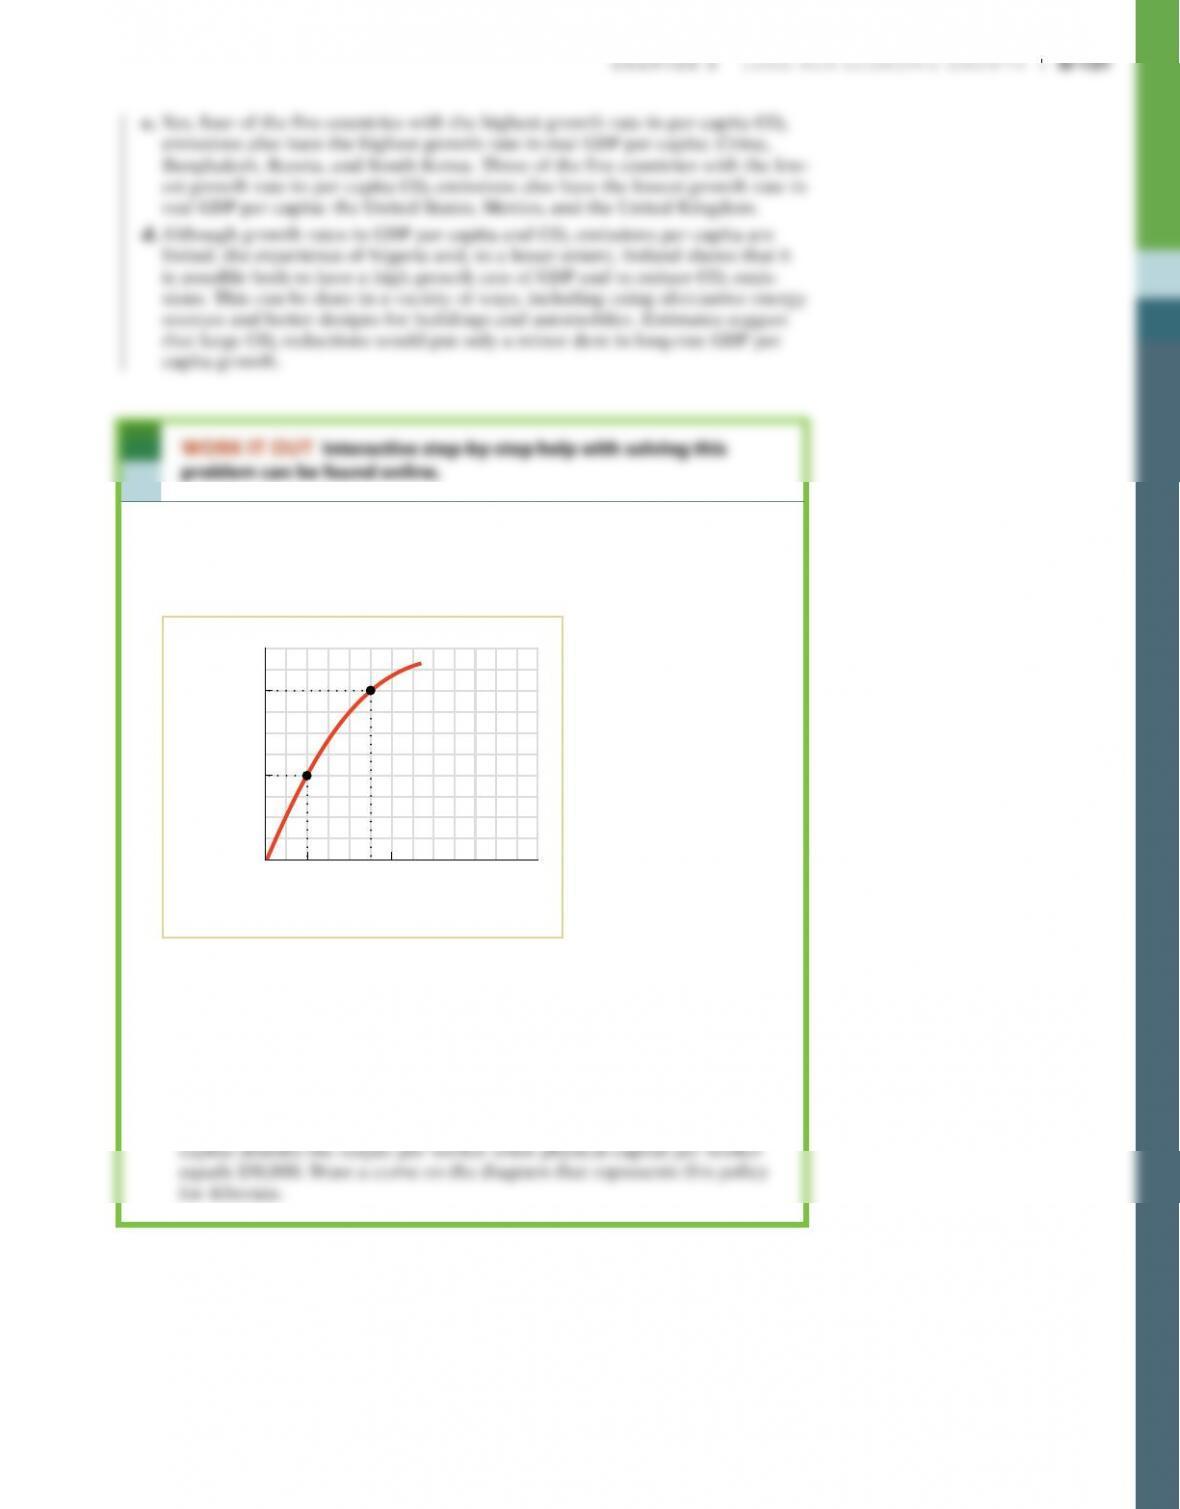
15. You are hired as an economic consultant to the countries of Albernia and
Brittania. Each country’s current relationship between physical capital per
worker and output per worker is given by the curve labeled “Productivity1” in
the accompanying diagram. Albernia is at point A and Brittania is at point B.
Real GDP
per worker
Physical capital
per worker
B
Productivity1
A
$40,000
20,000
$10,000 30,000
a. In the relationship depicted by the curve Productivity1, what factors are
held fixed? Do these countries experience diminishing returns to physical
capital per worker?
b. Assuming that the amount of human capital per worker and the technol-
ogy are held fixed in each country, can you recommend a policy to gener-
ate a doubling of real GDP per capita in Albernia?
c. How would your policy recommendation change if the amount of human
capital per worker could be changed? Assume that an increase in human
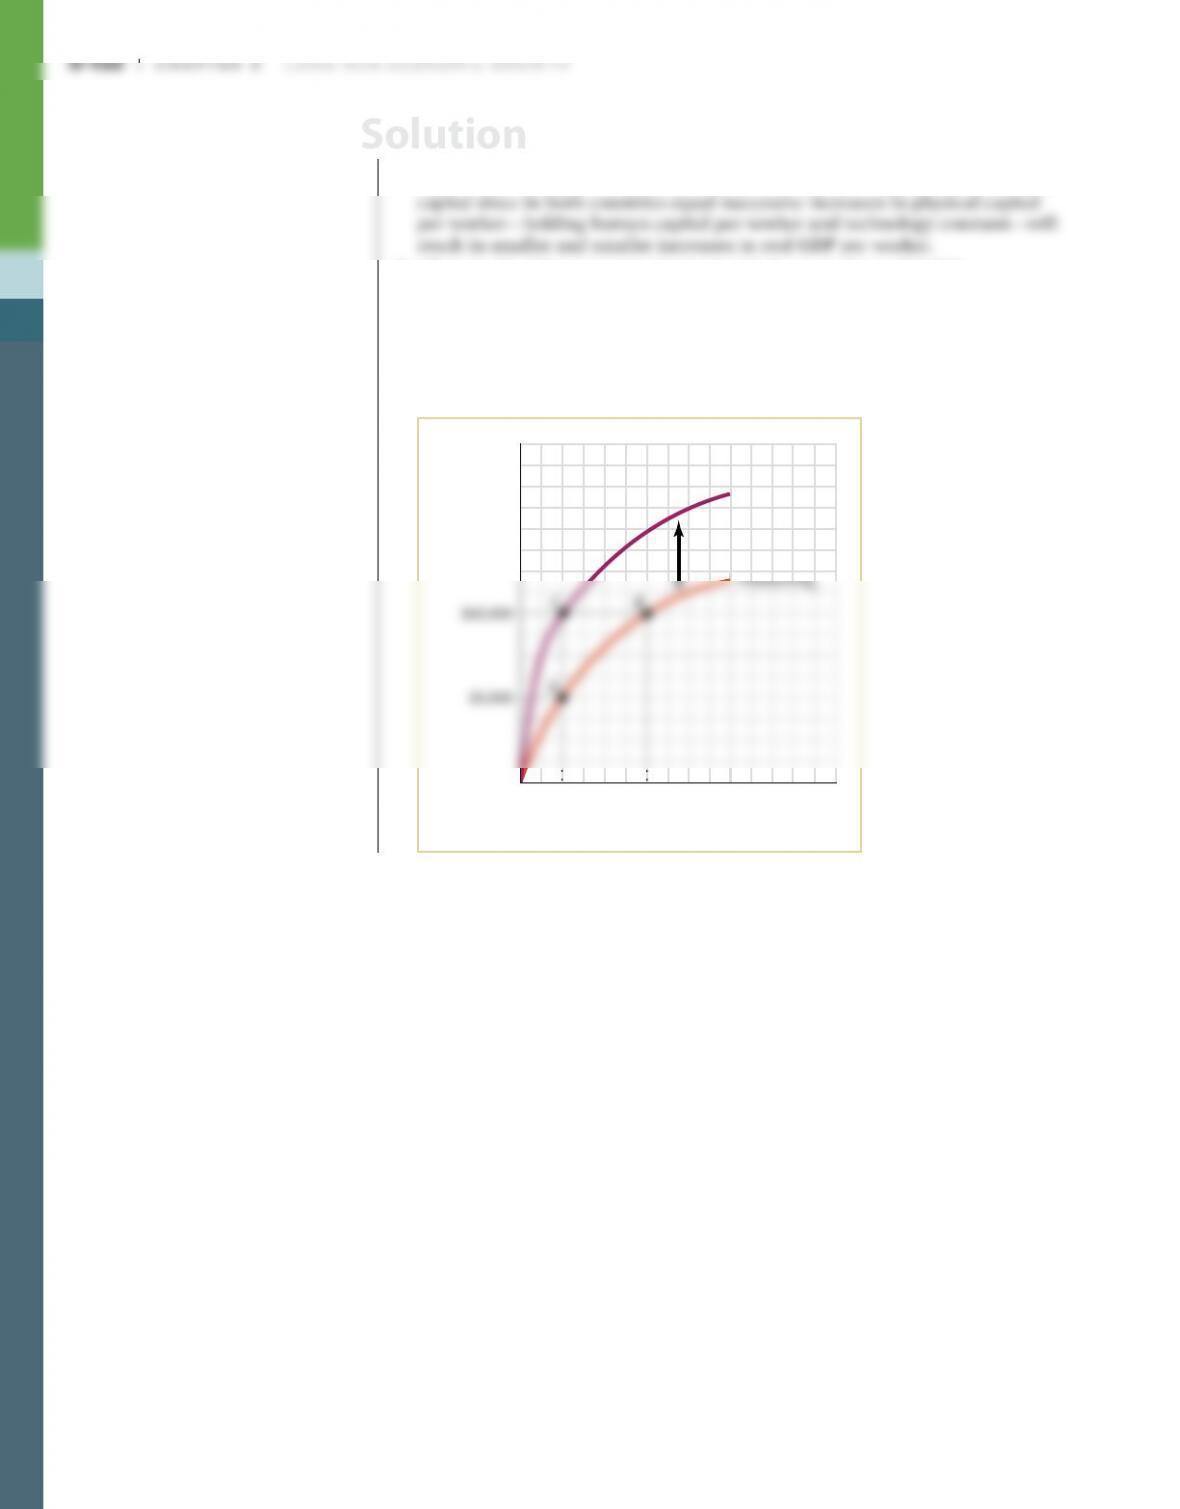
15. a. The curve reflecting the relationship between physical capital per worker and
output per worker is drawn holding human capital per worker and technology
fixed. Both Albernia and Brittania experience diminishing returns to physical
b. Albernia should increase its physical capital per worker to $30,000.
c. An increase in human capital per worker shifts the curve Productivity1 to
Productivity2 and Albernia doubles real GDP per worker without a change
in the physical capital per worker. On the accompanying diagram, Albernia
would move from point A to point C. So your policy recommendation should
be to increase the amount of human capital per worker.
Real GDP
per worker
Physical capital
per worker
B
Productivity1
Productivity2
C
$10,000 30,000
Solution