207
CHAPTER 9
Economic Growth II: Technology,
Empirics, and Policy
Notes to the Instructor
Chapter Summary
This chapter continues the presentation of the Solow growth model started in Chapter 8. The chapter
begins by adding labor–augmenting technological progress to the model. This addition completes the
Solow growth model. Once the complete model is developed, it is used to address how public policy
affects growth and development. The last section of the chapter examines some of the weaknesses of the
Solow growth model and introduces the student to endogenous growth theory. In addition, there is an
appendix on growth accounting based on the Solow growth model.
Building on the lessons of Chapter 8, the three sections of this chapter teach the following lessons:
1. Technological progress is the sole determinant of growth in living standards in the long run.
Comments
This chapter expands the Solow growth model of Chapter 8 to explain sustained growth in output per
capita and thus the ongoing rise in the standard of living. The chapter also discusses endogenous growth
1. The Meaning of Effective Worker
The analysis of population growth often seems easy to students while that of technological progress seems
2. Why Does Technological Progress Reduce k?
Students find it counterintuitive that technological progress reduces the capital–labor ratio, probably
because of the difficulty of interpreting the concept of effective worker. To emphasize that, the lower k
3. Confusion Among a Number of Similar Graphs and Variants of
the Model
The following are suggestions to correct such confusion:
(a) Make some or all of the discussion intuitive rather than mathematical; see Supplements 8–9
and 9-7.
(b) Stress that there is ultimately just one model with a number of special cases. The entire
4. Difficulties Relating the Model to the Real World
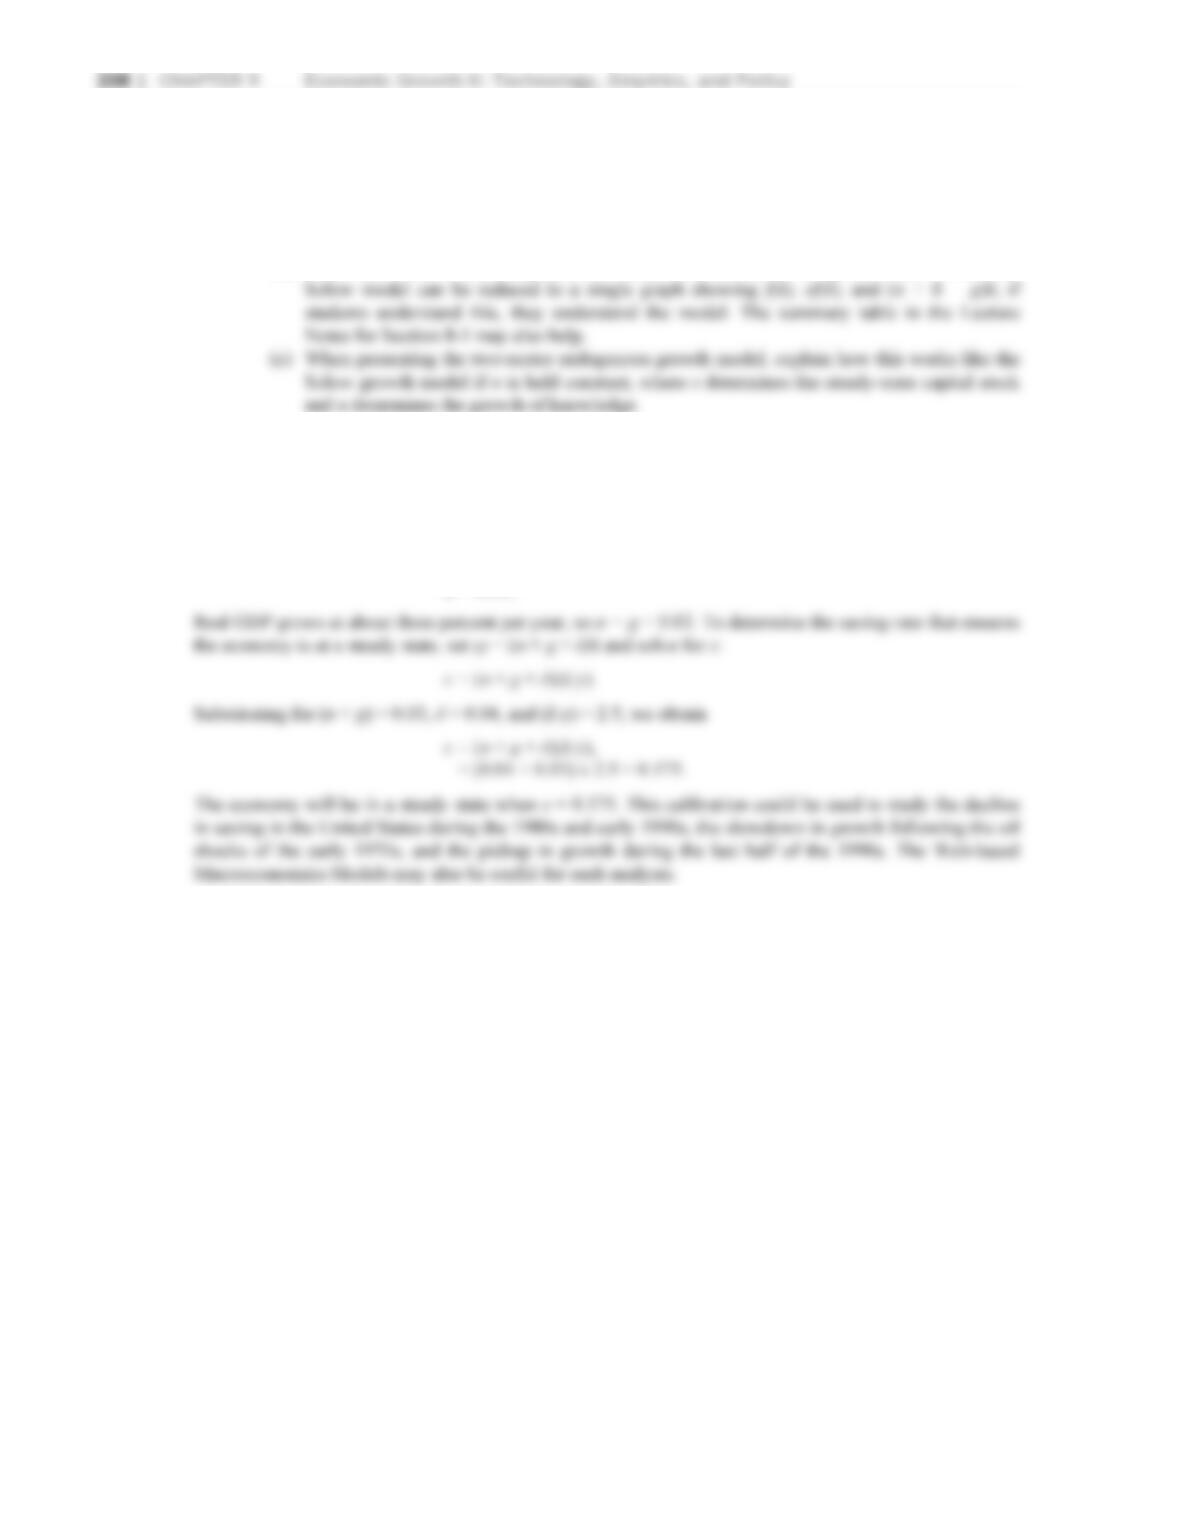
The Solow model can be roughly calibrated to the U.S. economy. As discussed in Chapter 9 of the
textbook, if depreciation is ten percent of GDP and the capital stock is 2.5 times one year’s GDP, we can
compute the depreciation rate by dividing
δ
k = 0.1y by k = 2.5y to obtain:
δ
k /k = (0.1y)/(2.5y),
δ
= 0.04.
Use of the Dismal Scientist Web Site
Go to the Dismal Scientist Web site and download data for total business fixed investment and investment
in information technology and software over the past 40 years. Compute the ratio of investment in
information technology and software to total business fixed investment. How has this ratio changed over
time? Discuss whether the data are consistent with the pickup in trend productivity growth during the late
1990s.
Lecture Notes | 209
Chapter Supplements
This chapter contains the following supplements:
9-1 More on the Convergence Hypothesis
9-3 The Economics of Ideas
9-5 Corruption and Growth
9-7 The Solow Growth Model: An Intuitive Approach—Part Two
9-9 More on the New Economy (Case Study)
9-10 Additional Readings
210 | CHAPTER 9 Economic Growth II: Technology, Empirics, and Policy
Lecture Notes
Introduction
The Solow growth model as developed in Chapter 8 showed how changes in the capital stock
and population growth affect the long–run level of output of the economy. This chapter adds
changes in technology to complete the model. The complete Solow growth model can then be
9-1 Technological Progress in the Solow Model
Chapter 8 provided an explanation of persistently rising output, but we have not yet explained
rising living standards. To do so, we incorporate technological progress, meaning that we are
able to produce more output with a given amount of capital and labor.
The Efficiency of Labor
Technological progress is a slightly trickier process to incorporate into the model. The reason is
that it can enter the production function in different ways; it may increase the productivity of
capital or labor. The simplest form to analyze is labor–augmenting technological progress.
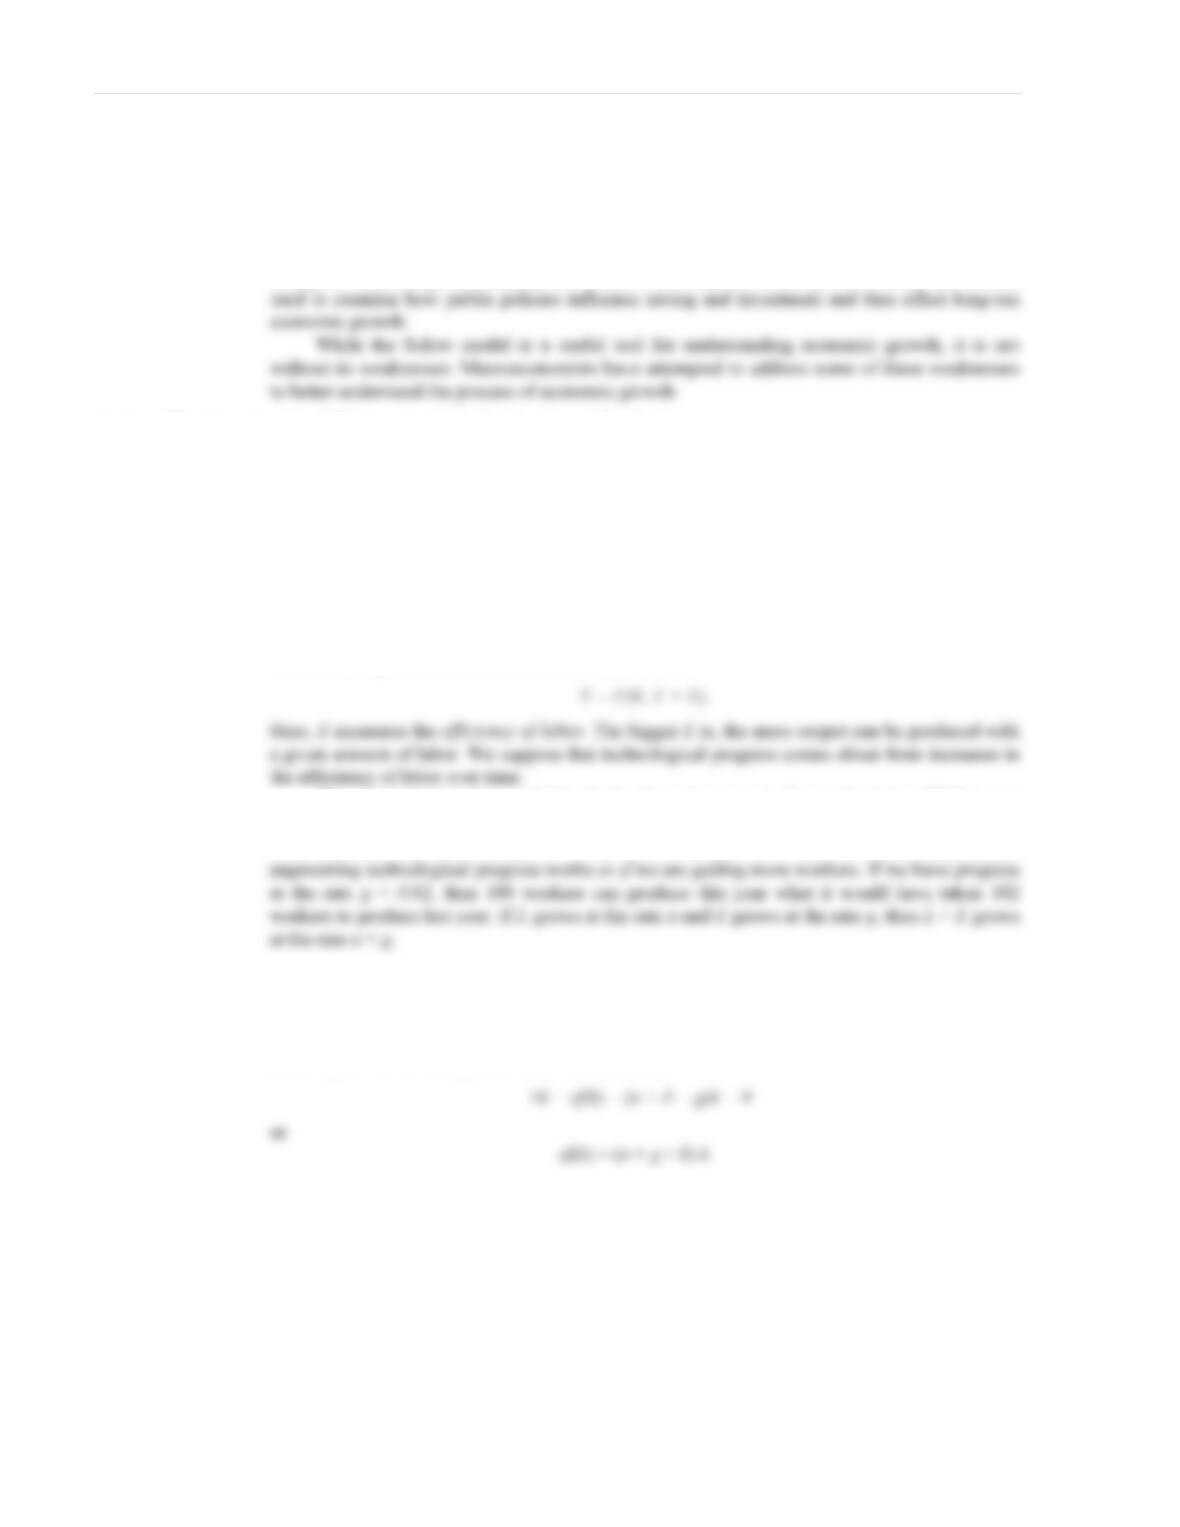
Return to the production function and amend it so that
This assumption makes analysis simple since increases in the productivity of labor now
look just like increases in population. If either L or E increases, output is affected in just the
same way. For this reason we call L × E the number of effective workers. In other words, labor–
The Steady State With Technological Progress
Now redefine k to be capital per effective worker (k = K/LE), and likewise, y = Y/LE. The
analysis of technological progress is now exactly analogous to that of population growth. The
economy will be in steady state with k constant when
The Effects of Technological Progress
In steady state, output, capital, and consumption per worker are all growing at the rate g. The
model can now explain rising living standards. According to the Solow model, technological
progress is the only source of rising living standards over time. The analysis of the Golden Rule
is again altered when we have technological progress. The condition for maximum consumption
per effective worker is
MPK – δ = n + g.
!Figure 9-1
!Table 9-1
9-2 From Growth Theory to Growth Empirics
Thus far, we have used the Solow model to help us understand how policy might influence
economic growth. We now turn to the question of how well the model fits the empirical facts.
Balanced Growth
Data for the United States bear out the predictions of the Solow model for technological progress
FYI: Economic Possibilities for Our Grandchildren
Since the Industrial Revolution, economic growth has raised living standards of people
worldwide. John Maynard Keynes, writing in 1930, projected that continued rapid economic
growth would raise living standards by four to eight times over the next 100 years. He saw such
growth as ensuring that most basic needs and material desires would be satisfied. He expected
the workweek to be much shorter and that the main problem facing society would be how to use
Convergence
The differences in living standards around the world are staggering. Yet the Solow model
suggests that economies are likely to converge toward the same steady state—at least if they
possess similar technologies and have similar rates of saving and population growth. If the
differences between rich and poor countries are just due to the fact that rich countries have more
capital, then we would expect poor countries to accumulate capital faster and so eventually catch
up with richer ones.
!Supplement 9–1,
“More on the
Convergence
Hypothesis”
!Supplement 9–2,
“Convergence of
education.
Factor Accumulation Versus Production Efficiency
Cross–country differences in income per person arise either because of differences in capital per
person (physical capital and human capital) or because of differences in the efficiency with
which factors are employed. Although results vary from study to study, research has shown that
Case Study: Good Management as a Source of Economic
Growth
Differences in incomes across nations occur in part because of differences in production
efficiency. The same is true about businesses. One possible reason is differences in management
practices. A recent study finds significant variation in management practices across firms in the
United States, the United Kingdom, France, and Germany. In each country, some firms are
efficiently managed and others are poorly managed. But the distribution of management quality
9-3 Policies to Promote Growth
What are the policy implications of the Solow growth model?
Evaluating the Rate of Saving
A natural starting point for evaluating the saving rate is to see if the U.S. economy is above the
Golden Rule, since we know that policymakers could then make everybody better off by
discouraging saving. We need to compare the growth rate
(n + g) with the return to capital net of depreciation (MPK – δ).
The following are true for the U.S. economy:
Lecture Notes | 213
Changing the Rate of Saving
Although the Solow model as set out here excluded the government for simplicity, we know
from the analysis of the classical model that national saving depends on both private saving and
government saving. One way, therefore, for policymakers to change the saving rate is by
increasing public saving—running government surpluses rather than government deficits. Recall
Allocating the Economy’s Investment
Although the Solow model assumes a single capital good, it is helpful to distinguish three
different types of capital. First, there is private physical capital: the factories, machinery, and the
like firms use to produce goods. Second, there is public physical capital—that is, capital goods,
such as the interstate highway system, that the government provides. Such goods are often
known as infrastructure. And third, there is human capital, or the knowledge and skills of people
in the economy.
Case Study: Industrial Policy in Practice
A long–standing debate in economics revolves around whether governments should promote
certain industries or firms because of their importance to the economy. This debate in the United
States goes back to the early days of the country and the Tariff of 1789, which was intended to
help develop domestic manufacturing. One example supporters of industrial policy often point to
is the success of the Internet—a government–sponsored defense project that, by all estimation,
Establishing the Right Institutions
As noted earlier, nations have differences in per–capita income because of differences in factor
accumulation and differences in production efficiency. In turn, nations may have different levels
of production efficiency because they have different political and legal institutions that affect the
allocation of scarce resources. For example, the extent of legal protection afforded shareholders
and creditors may influence the functioning of capital markets and thus the allocation of capital
!Supplement 3–2,
“What Is Capital”
214 | CHAPTER 9 Economic Growth II: Technology, Empirics, and Policy
A comparison of the economic performance between North and South Korea highlights
well the importance of institutions for economic success. Both nations shared a common
government, economy, heritage, and culture for many centuries. After World War II, Korea was
Case Study: The Colonial Origins of Modern Institutions
A nation’s geographical latitude is strongly correlated with its income per capita. Nations near
the equator typically have a lower income per capita than nations farther away from the equator.
This finding holds for both the northern and southern hemispheres. Some economists argue that
this correlation is due to the direct effect of tropical climates on productivity in agriculture and
industry—hot climates are associated with more disease and generally poorer results in
agriculture. Recent work by Daron Acemoglu, Simon Johnson, and James Robinson goes
beyond the direct effect of climate on productivity to consider the indirect effect of climate on
institutions. These authors argue that the presence of tropical disease dissuaded Europeans from
settling in tropical areas and opting instead to establish permanent settlements in more temperate
Encouraging Technological Progress
Having gone through the Solow model in some detail, we are left with a somewhat disturbing
conclusion from the point of view of our theory. Explaining growing living standards means
explaining technological progress, which is exogenous in the model. Economists do not yet have
a very good understanding of the sources of technological progress. Nonetheless, government
policies are often directed to encouraging technological progress. Such policies include tax
breaks for research and development and government funding of basic research. More broadly,
government subsidization of education, by improving the skills of the work force, may increase
the efficiency of labor.
Case Study: Is Free Trade Good for Economic Growth?
As Adam Smith noted, international trade allows countries to specialize in productive activities
in which they have a comparative advantage. So one might expect that countries that are open to
trade would have higher living standards than countries that are closed to trade. The empirical
evidence shows that countries that are more open to trade indeed do experience more rapid
9-4 Beyond the Solow Model: Endogenous Growth Theory
How to incorporate the process of technological change into a growth model?
The Basic Model
Start with a production function
Y= AK,
where A is a constant measuring the amount of output produced for each unit of capital. This is
known as an AK model. The production function does not exhibit diminishing returns to capital.
If s is the fraction of income saved, then
A Two–Sector Model
The AK model developed above is the simplest example of an endogenous growth model. A
more sophisticated version incorporates two sectors: a manufacturing sector that produces goods
and services for either consumption or investment in physical capital K and a research sector
composed of universities that produce knowledge, E, which is used in both sectors.
The economy can be described by three equations:
The Microeconomics of Research and Development
There are three microeconomic facts of research and development (R&D):
2. Research is profitable because innovations give firms temporary monopoly power.
3. Firms build on the innovations of other firms.
!Supplement 9–3,
“The Economics
of Ideas”
!Supplement 9–4,
“Green Growth”
216 | CHAPTER 9 Economic Growth II: Technology, Empirics, and Policy
The Process of Creative Destruction
Economist Joseph Schumpeter proposed that economic growth occurs through a process known
as “creative destruction.” His theory viewed new firms as continually entering the marketplace,
having monopoly power over their innovations, and reaping the profits that induced the firms to
enter the market in the first place. Consumers benefit from the greater choice of products, but
existing firms now face competition. Some of these established firms cannot compete and go out
9-5 Conclusion
While the Solow model explains the long–run determination of the capital stock and teaches us
where to focus our attention, if we want to explain economic growth, it is unsatisfactory in that it
takes as exogenous precisely those variables identified as sources of growth—population change
Appendix: Accounting for the Sources of Economic Growth
Growth accounting attempts to decompose overall output growth into its constituent sources:
changes in labor, capital, and technology.
Increases in the Factors of Production
First, we hold the technology constant. Recall the following definitions from Chapter 3:
MPK = F(K + 1, L) – F(K, L);
MPL = F(K, L + 1) – F(K, L).
Given a change in capital ∆K and a change in labor ∆L, we then have
∆Y = (MPK × ∆K) + (MPL × ∆L).
Now divide through by Y, multiply and divide the first term on the right–hand side by K,
multiply and divide the second term on the right–hand side by L, and rearrange to obtain
Lecture Notes | 217
Technological Progress
To include technological progress, write the production function as
Y = A × F(K, L),
The Sources of Growth in the United States
Table 9-2 in the text presents decade–by–decade decompositions of U.S. economic growth into
its constituent sources.
Case Study: The Slowdown in Productivity Growth
Economic growth slowed sharply after the early 1970s. This slowdown was worldwide and has
been attributed to a decline in the rate of technological progress. The downshift in growth meant
that living standards for many countries rose more slowly in the 1970s and 1980s than they had
2. faster obsolescence of capital in the 1970s due to the large changes in oil prices;
4. a decline in inventiveness.
The worldwide slowdown in growth that began in the early 1970s seems to have ended
sometime in the mid–1990s. In the United States, GDP per person has grown by 2 percent per
year since 1995, compared with just 1.5 percent per year from 1972 to 1995. This increase in the
growth rate has been described by some observers as the dawning of a “New Economy.”
Economists are not completely certain as to why growth suddenly surged in the 1990s, but
many suspect that it had something to do with advances in computing and other information
!Table 9-2
!Supplement 9–8,
“More on the
Productivity
!Supplement 9–9,
“More on the
New Economy”
218 | CHAPTER 9 Economic Growth II: Technology, Empirics, and Policy
Case Study: Growth in the East Asian Tigers
Many businesspeople, economists, and other commentators have noted the phenomenal
economic success of certain countries in East Asia—particularly Hong Kong, Singapore, South
The Solow Residual in the Short Run
This appendix shows how we may infer the effect of technological change on the economy by
using the techniques of growth accounting. Any variation in output that cannot be explained by
changes in capital or labor, so the reasoning goes, must be the result of technological progress.
This unexplained change in output is known as the Solow residual. The Solow residual has, in
fact, fluctuated substantially in the past. It rises during expansions and falls during recessions.
Economist Edward Prescott has argued that such fluctuations in technology are an important
during times when business has slowed, but this activity is not generally accounted for in the
National Income Accounts’ measures of output. As a result, output and the Solow residual
appear lower than they actually are during recessions. The evidence on labor hoarding and
cyclical mismeasurement of output, however, is not clear–cut, and so the debate goes on between
proponents and critics of real business cycle theory.
!Figure 9-2
ADDITIONAL CASE STUDY
9-1 More on the Convergence Hypothesis
The Solow growth model suggests that economies with similar rates of population growth and
technological progress should exhibit similar levels of per–capita income in the long run, regardless of
their initial capital stock. During the adjustment to steady state, countries with a lower capital stock will
grow faster than those with higher capital stocks. This is known as the convergence hypothesis. Some
recent theories of endogenous growth, by contrast, do not imply convergence. Rather, they suggest that
there may be constant or increasing returns to capital and, hence, no tendency for convergence in per–
capita income.
There is as yet no consensus on whether or not countries do exhibit convergence in per–capita income.
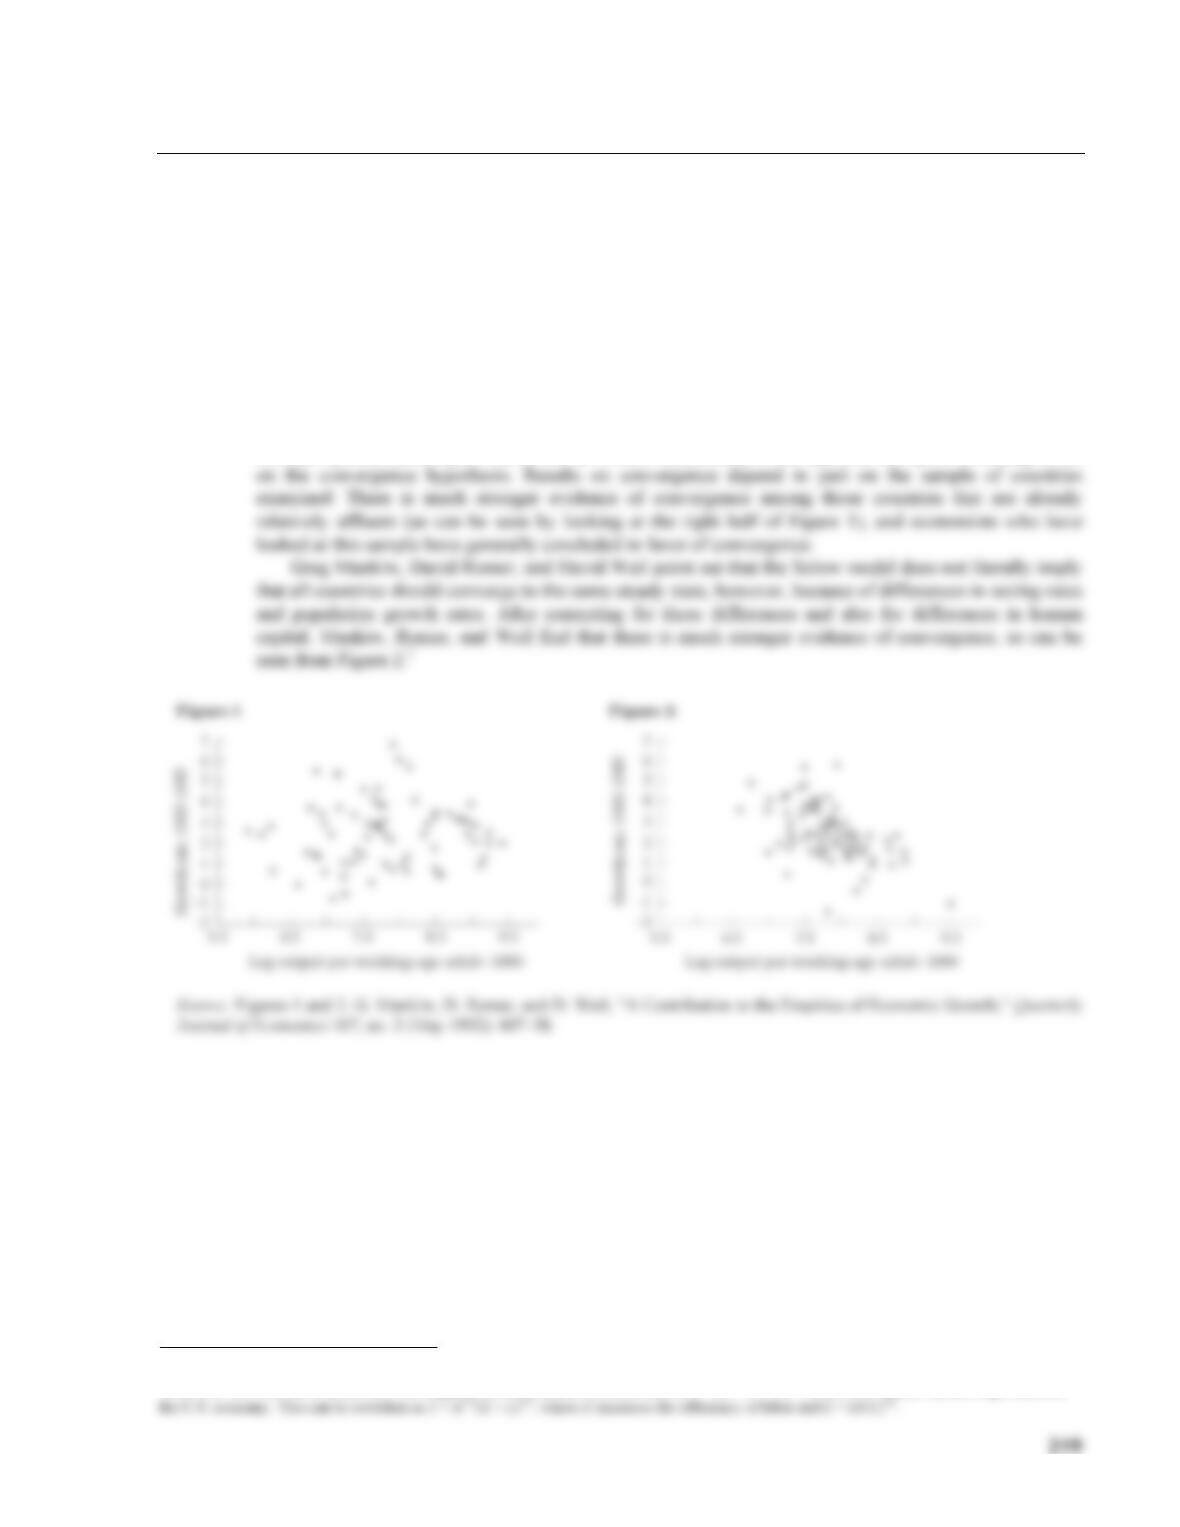
Figure 1 shows a scatterplot of growth rates since 1960 against output per worker in 1960. The simple
convergence hypothesis suggests that these variables should be negatively related: Countries with higher
GDP per person should grow more slowly. Such a relationship is not apparent in Figure 1, casting doubt
1 G. Mankiw, D. Romer, and D. Weil, “A Contribution to the Empirics of Economic Growth,” Quarterly Journal of Economics 107, no. 2 (May
1992): 407–38. Mankiw, Romer, and Weil suggest that a production function such as Y = (K × L × H)1/3, where H is human capital, might describe