220
ADDITIONAL CASE STUDY
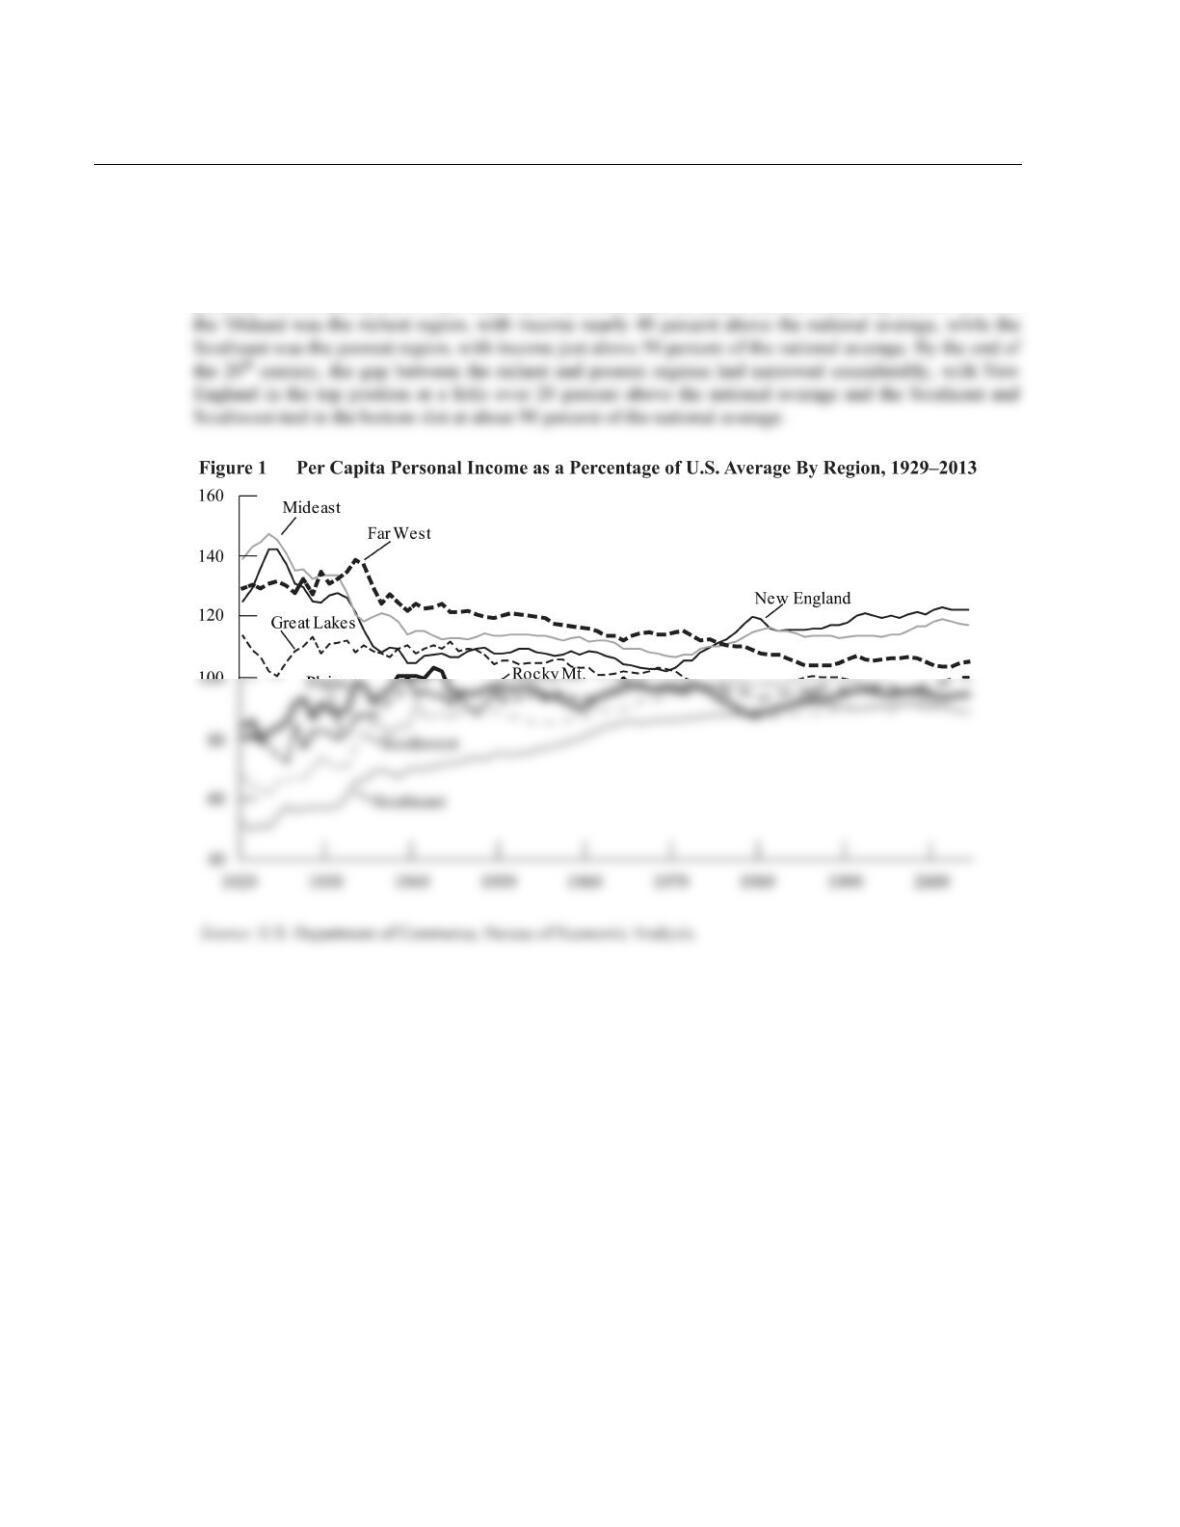
9-2 Convergence of Income Across the United States
The Solow growth model predicts that economies with similar rates of saving, population growth, and
technological progress should converge over time. Poor economies should catch up to rich economies and
eventually have similar levels of per–capita income. As Figure 1 shows, regional differences in per–capita
personal income across the United States have narrowed considerably since the Great Depression. In 1929,
221
LECTURE SUPPLEMENT
9-3 The Economics of Ideas
Recent work on economic growth emphasizes the importance of human capital. Yet the term is something
of a catchall that is often used to include both embodied skills, such as the ability to use a word processor
or to operate a piece of machinery, and disembodied knowledge, such as the software code or the blueprint
for the machine.
Paul Romer argues that understanding economic growth requires that we think seriously about ideas,
which he claims are quite distinct from other economic goods, including human capital.1 Ideas “are the
instructions that let us combine limited physical resources in ways that are ever more valuable.”2 Romer
uses the metaphors of children’s toys to illustrate his ideas about ideas.
We use the Fun Factory model or something just like it to describe how capital (the Fun
Factory) and labor (the child’s strength) change the characteristics of goods, converting them
from less valuable forms (lumps of modeling compound) into more valuable forms (lengths of
pipe)…. The production function and the Fun Factory metaphor have been widely used in the
neoclassical analysis of aggregate growth. Yet in this analysis the neoclassical model has been
view, the excitement of this toy comes from trying to find some combination of the underlying
chemicals that, when mixed together and heated, does something more impressive than change
colors (explode, for example). In a set with N jars, there are 2N – 1 different mixtures…. For a
moderately large chemistry set, the number of possible mixtures is far too large for the toy
manufacturer to have directly verified that no mixture is explosive. If N is equal to 100, there
superconductor at temperatures far exceeding those for all the known superconductors.
This “high–tech” example of a valuable mixture suggests only a small part of the
enormous scope for making discoveries of economic importance. If a garment factory requires
52 distinct independent steps to assemble a shirt, there are 52! = 1068 different ways to order
222
temperature superconductors, are discovered and put to use but also how millions of little
ideas, such as better ways to assemble shirts, are discovered and put to use….”3
Romer goes on to discuss the distinction between objects and ideas. He first considers public goods,
which are defined to be those goods that are nonrival and nonexcludable. Nonrival means that one
person’s use of the good does not preclude another person from also using that good. Nonexcludable
means that we cannot prevent anyone from enjoying the benefit of a good. The classic example of a public
good is national defense. A traditional private good, such as a pair of shoes, is both rival and excludable.
Other combinations are possible: A fish in the ocean is rival but largely nonexcludable; an encoded
satellite television broadcast is nonrival but excludable. In general, objects are rival goods while ideas are
3 Ibid., 67–69.
LECTURE SUPPLEMENT
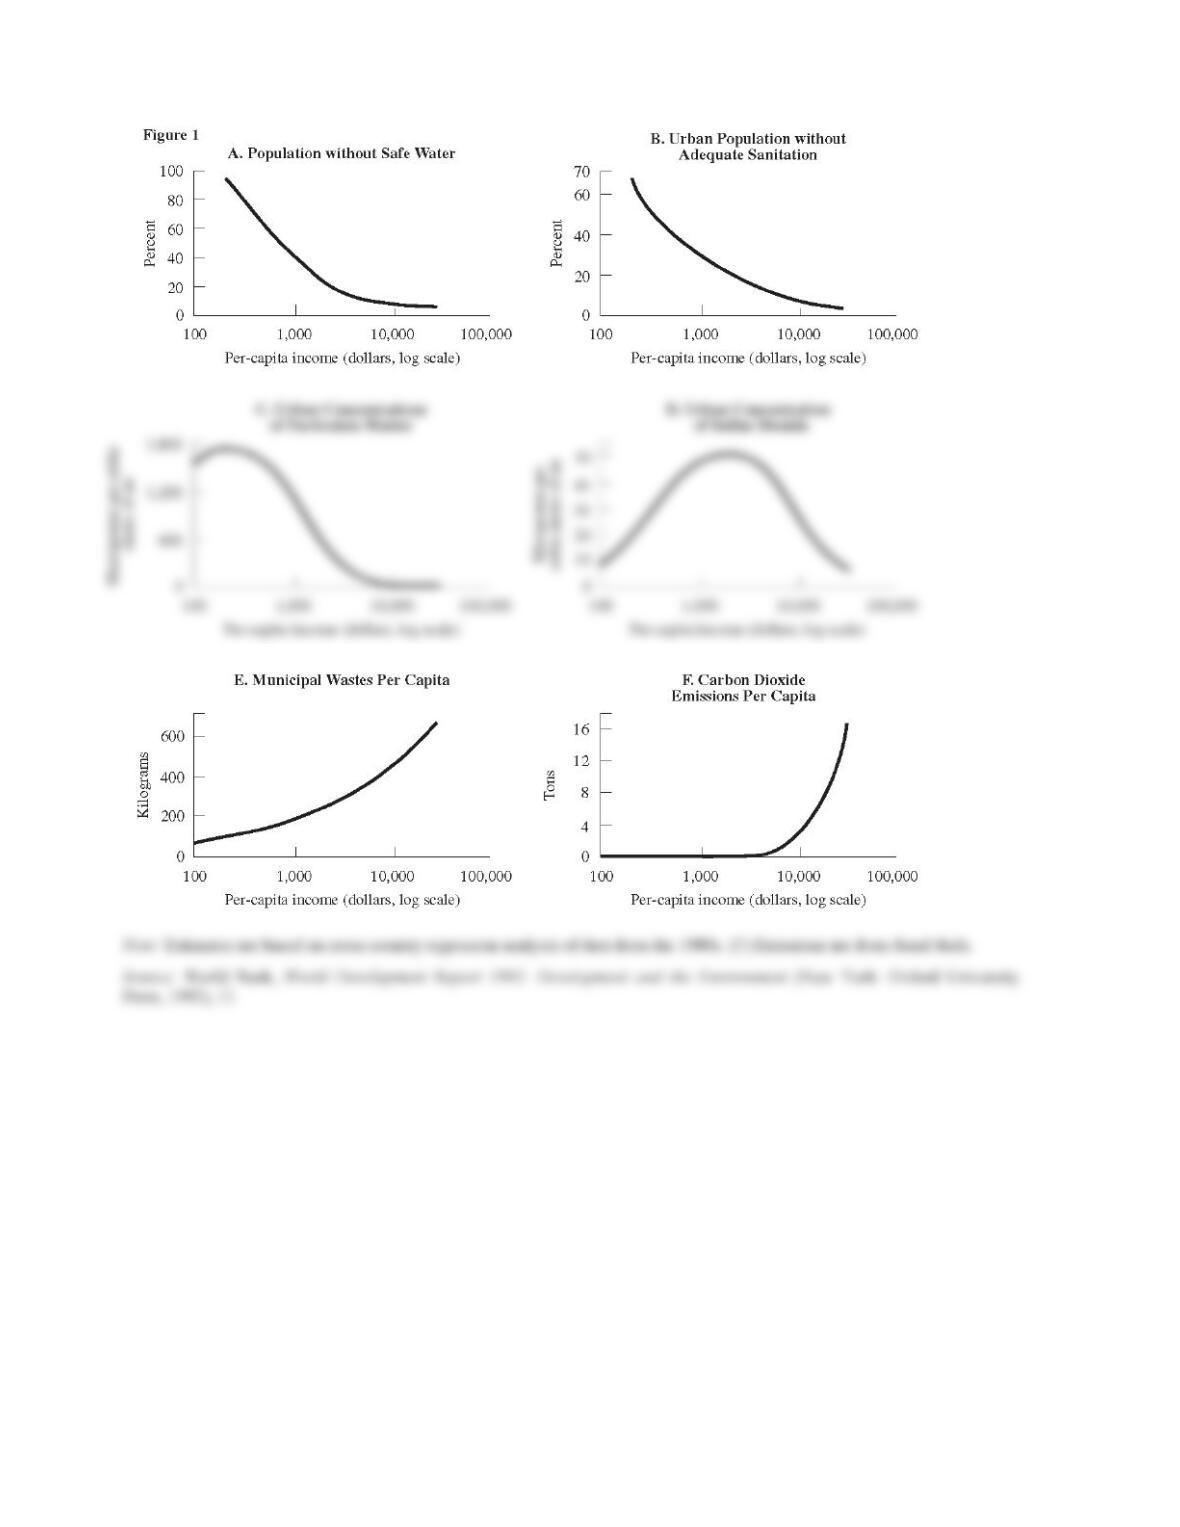
9-4 Green Growth
There has long been debate among economists, environmentalists, and others about the effects of
economic growth on the environment. Pessimists point to the fact that increased production of goods and
services may imply increased degradation of the natural environment, both because production uses scarce
natural resources and because it generates pollutants as a by–product. Some, therefore, argue that
economic growth should not be an aim of policymakers. Optimists note that newer, more productive
technologies often are less polluting and use fewer natural resources than older production methods.
Moreover, richer countries may wish to invest more resources in cleaning up the environment. From this
perspective, growth is good for the environment.
The truth seems to be in the middle. Figure 1 reproduces the relationship between income and the
environment for various indicators of environmental quality. For some aspects of the environment, rich
certainly does seem to be better: Rich countries enjoy safe water and good sanitation while poor countries
do not. But the environmental problems of municipal waste (which fills landfills) and carbon dioxide
emissions (which may contribute to global warming) are relatively worse in richer countries. Perhaps most
interestingly, measures of air quality indicate that air pollution is worst in middle–income countries. As
countries grow, their air quality apparently worsens for a while but then improves when they become
sufficiently rich.
224
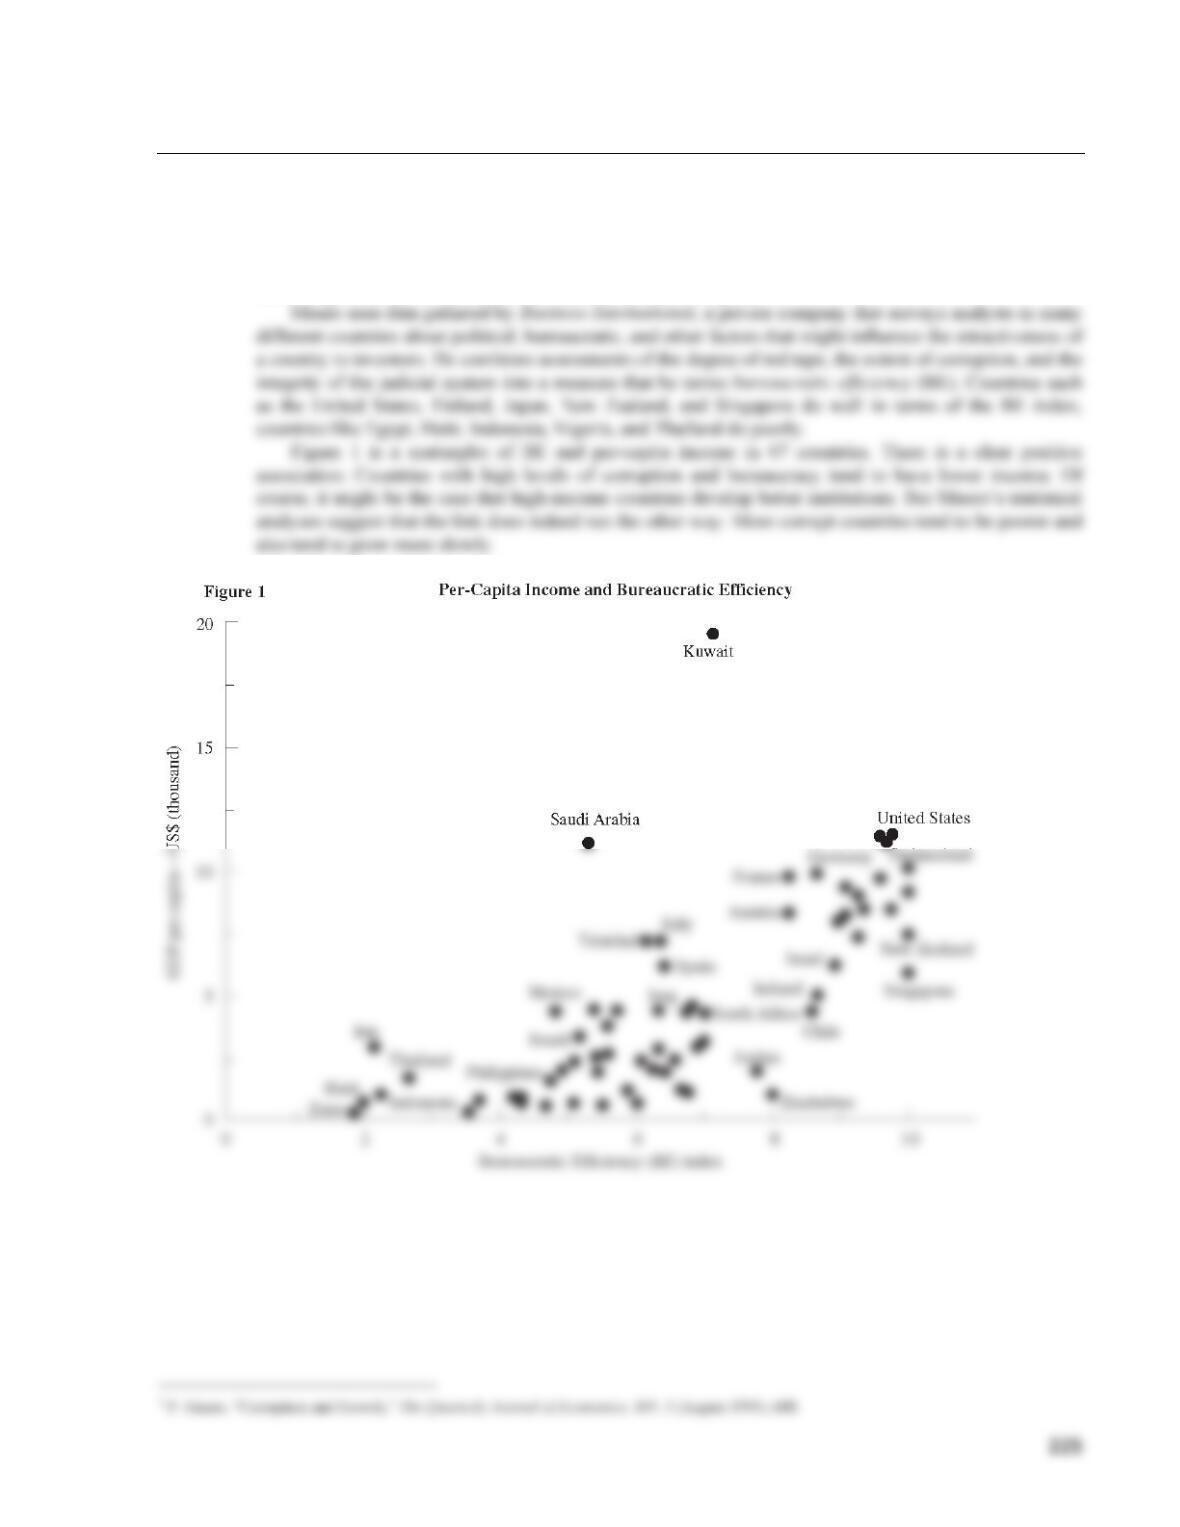
ADDITIONAL CASE STUDY
9-5 Corruption and Growth
The Solow model does quite a good job of explaining differences in living standards and growth rates
among different countries. But it is not perfect, so many economists have sought additional explanations
of the varying economic performance of different countries. Paolo Mauro has investigated the link
between growth and the incidence of bureaucracy and corruption.1
226
LECTURE SUPPLEMENT
9-6 Income Inequality and Growth
Is there a tradeoff between economic growth and the distribution of income? Must a country accept a more
unequal distribution of income to achieve a high rate of economic growth? Recent studies reject this
tradeoff and agree instead that a more equal distribution of income results in higher economic growth.1
Persson and Tabellini (1994), for example, examine the effects of the distribution of income on the
growth of per–capita income in 56 countries between 1960 and 1985.2 In their model, as is standard in this
literature, average growth in each year between 1960 and 1985 is determined by the initial level of GDP
per capita, the initial level of human capital (as measured by schooling), and the initial distribution of
income before taxes. Their results show that the higher the initial level of GDP, the lower is the growth
rate of the economy, which supports the idea of convergence. Furthermore, the higher the education level
of the population, the higher is the growth rate of the economy. Persson and Tabellini also find that the
more equal the distribution of income in a country in 1960, the higher was its rate of economic growth
LECTURE SUPPLEMENT
9-7 The Solow Growth Model: An Intuitive Approach—Part Two
This supplement continues the more intuitive and less mathematical explanation of growth models.
Technological Progress
In general, technological progress can take many different forms. By far the easiest form to analyze is
labor–augmenting technological progress. We write the production function as
Y = F(K, E × L).
The new variable, E, represents the efficiency of labor, which depends on the skills and education of the
workforce. The idea is that a more skilled and better trained workforce can produce more output with a
given capital stock. (As an example, think of capital as consisting of personal computers and labor
efficiency as being knowledge of software packages.) We represent technological progress as an
exogenous increase in the value of E through time. That is, we suppose that E grows at the rate g. Over
Putting the Pieces Together
We can now summarize the Solow model when all three sources of growth—changes in capital, changes
in labor, and changes in technology (labor efficiency)—are present.
Suppose that the population is growing at the rate n (say, 1 percent per year), and the efficiency of
labor is growing at the rate g (say, 2 percent per year). Then effective workers (E × L) are growing at the
rate (n + g), which equals 3 percent per year. Since capital per efficiency unit of labor is constant in steady
state, it follows that the capital stock must also be growing at 3 percent per year. Consequently, total
output will be growing at 3 percent per year. Although capital per effective worker is constant, capital per
person (the capital–labor ratio) is growing at 2 percent per year. Similarly, output per person and
consumption per person are also growing at 2 percent per year in this steady state.
Growth Accounting
Robert Solow, the inventor of the Solow growth model, also pioneered an accounting technique to
measure how much of overall economic growth is explained by changes in capital, changes in labor, and
228
Policy Implications
An important message conveyed by the Solow growth model is that increases in the rate of saving are not
necessarily desirable. There are two reasons for this. First, beyond a certain point, increases in the saving
rate actually lower consumption in the long run. The reason is that with a very high capital stock we may
have to devote so much output simply to replacing worn–out machines that not very much is left over for
consumption. Beyond a point known as the Golden Rule, increases in the capital–labor ratio decrease
steady–state consumption. An economy in such a position would actually want to decrease its saving rate,
since this allows present and future generations to enjoy increased consumption.
What Have We Learned?
The Solow model explains the forces that lie behind the accumulation of capital in an economy, and it
helps us to understand how changes in capital, labor, and technology all contribute to economic growth. It
also helps explain differences in living standards across countries: The model predicts that, even if all
countries have access to identical technology, we might expect to see higher standards of living in
countries with higher saving rates and lower population growth rates. The model teaches the surprising
lesson that higher saving rates do not affect economic growth in the long run (although they do affect the
overall level of income). Finally, the model clearly reveals that economic growth concerns the choice
229
Endogenous Growth Theory
Recent work on economic growth seeks to fix the weaknesses of the Solow growth model. One area,
known as endogenous growth theory, attempts to directly incorporate the process driving sustained
economic growth rather than relying on exogenous technological progress.
In the Solow growth model, an increase in the rate of saving does not affect economic growth in the
long run because of diminishing returns to capital. One way to get around this problem is to assume that
each unit of capital produces a constant amount of output
Y = AK.
230
CASE STUDY EXTENSION
9-8 More on the Productivity Slowdown
Table 9–2 of the textbook shows evidence of a worldwide slowdown in economic growth starting in the
early 1970s. This slowdown was attributable in turn to a decline in productivity growth. Concern about
this productivity slowdown, however, may have been premature, as growth appears to have picked up
again in the 1990s (see Supplement 9–4). Still, economists’ concerns are understandable since small
The United States has also been experiencing a relative productivity decline. Between 1870 and 1930,
U.S. productivity growth exceeded the average growth of 16 (relatively affluent) countries analyzed by
William Baumol, Sue Anne Batey Blackman, and Edward Wolff; between 1950 and 1980, U.S.
productivity growth was little more than half the average of the same 16 countries.3 This is not necessarily
bad for the United States since, if other countries are more productive, we obtain cheaper imports, but it
percentage change in the capital stock is much larger than capital’s share of output. According to Romer,
the aggregate production function for the United States would be better written as Y = KαLβ, where α has a
value between 0.7 and 1.0 and β has a value between 0.1 and 0.3.5
CASE STUDY EXTENSION
9-9 More on the New Economy
The step–up in economic growth during the last half of the 1990s has raised the question of whether these
gains reflect a payoff from investment in computers and information technologies. To assess this question,
a recent paper by Stephen Oliner and Daniel Sichel extends the growth–accounting framework presented in
the textbook’s appendix to this chapter.1
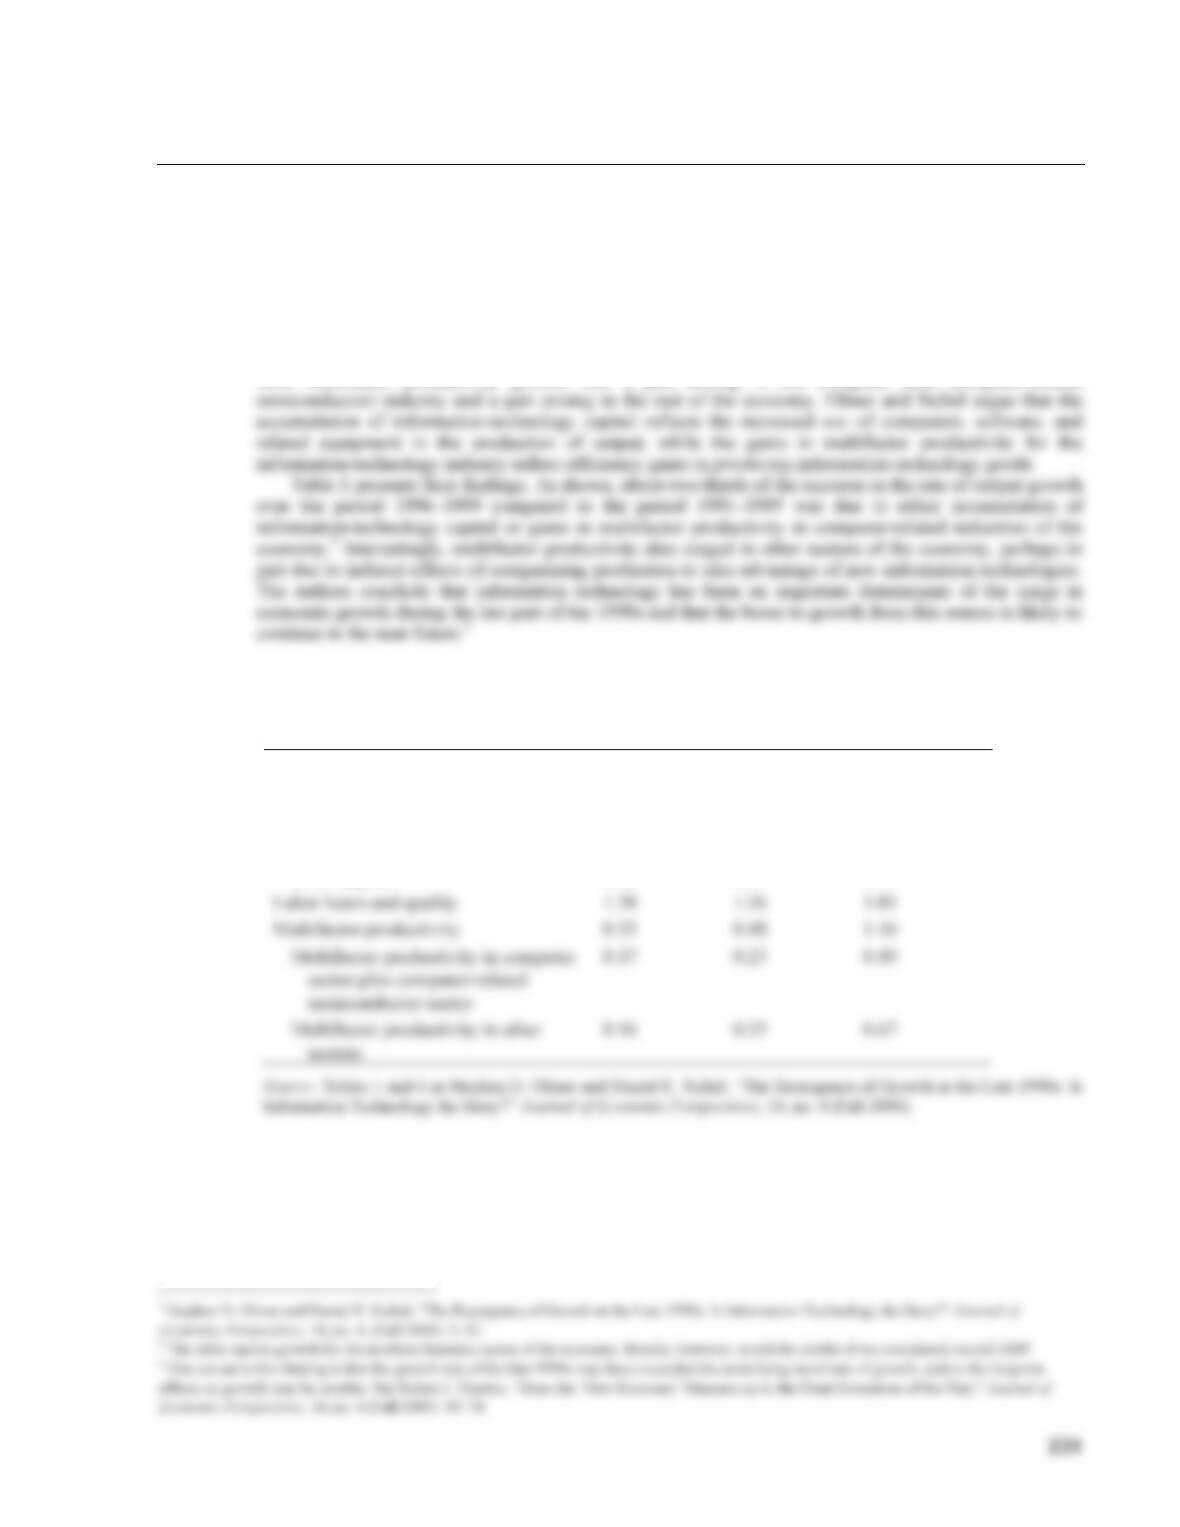
The authors take the contribution to output growth from capital accumulation and break it down into
the contribution from information–technology capital (computers, software, and communications
equipment) and the contribution from other forms of capital. They also separate the output contribution
from multifactor productivity growth into a part arising in the computer (and computer–related
Table 1 Contributions to Growth of Real Output in Nonfarm Business Sector, 1974–1999
(annual percentage change)
1974–1990
1991–1995
1996–1999
Growth rate of output
3.06
2.75
4.82
Contribution from:
Capital
1.35
1.01
1.85
Information–technology capital
0.49
0.57
1.10
Other capital
0.86
0.44
0.75
1.38
1.26
1.81
0.33
0.48
1.16
LECTURE SUPPLEMENT
9-10 Additional Readings
The more recent work on endogenous growth theory is for the most part quite difficult. There is a useful
symposium in the Winter 1994 Journal of Economic Perspectives. A very brief and relatively accessible
history of growth theory, including some recent developments, is provided by Nicholas Stern, “The
Determinants of Growth,” Economic Journal 101 (January 1991): 122–33. (This edition of the Economic