09 Chapter model 12/12/2018
THE DISCOUNTED DIVIDEND MODEL (Section 9-4)
CONSTANT GROWTH STOCKS (Section 9-5)
The long-run growth rate (g) is especially difficult to measure, but one approximates this rate by
multiplying the firm’s return on equity by the fraction of earnings retained, ROE x
(1 – Payout ratio). Generally speaking, the long-run growth rate is likely to fall between 5% and
Chapter 9. Stocks and Their Valuation
The basic dividend valuation equation is:
This model is similar to the bond valuation models developed in Chapter 7 in that we employ
discounted cash flow analysis to find the value of a firm’s stock.
The value of any financial asset is equal to the present value of future cash flows provided by the
asset. Stocks can be evaluated in two ways: (1) by finding the present value of the expected
future dividends, or (2) by finding the present value of the firm’s expected future free cash flows,
subtracting the market value of the debt and preferred stock to find the total value of the common
equity, and then dividing that total value by the number of shares outstanding to find the value per
share. Both approaches are examined in this spreadsheet.
In the constant growth model, we assume that the dividend will grow forever at a constant growth
rate. This is a very strong assumption, but for stable, mature firms, it can be reasonable to
assume that the firm will experience some ups and downs throughout its life but those ups and
downs balance each other out and result in a long-term constant rate. In addition, we assume that
the required return for the stock is a constant. With these assumptions, the price equation for a
common stock simplifies to the following expression:
EXAMPLE
g4.0%
rs9.0%
STOCK PRICE SENSITIVITY
Resulting
% Change Last Price
-30% $0.70 $14.56
-15% $0.85 $17.68
% Change
rs$20.80
-30% 6.30% $45.22
-15% 7.65% $28.49
% Change g $20.80
-30% 2.80% $16.58
-15% 3.40% $18.46
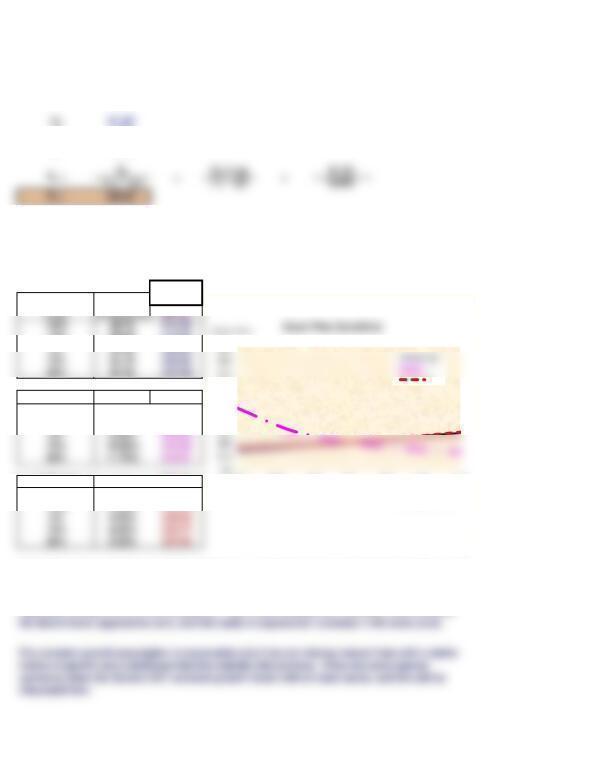
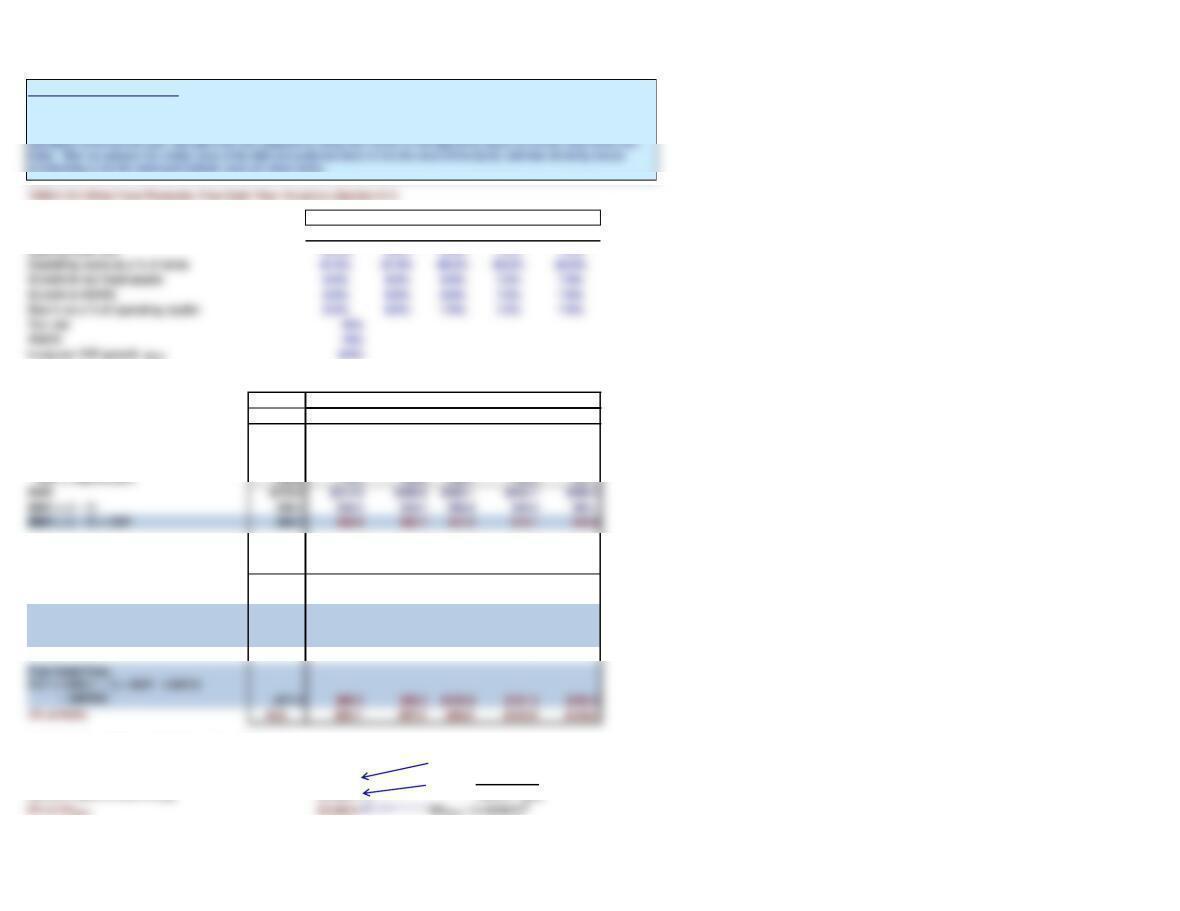
One of the keys to understanding stock valuation is knowing how various factors affect the stock
price. We construct below a series of data tables and a graph to show how the stock price is
affected by changes in the dividend, the growth rate, and rs.
From the chart we see that the stock price increases with increases in the dividend and the growth
rate but decreases with increases in the required return. The dividend relationship is linear, while
price is a nonlinear function of the growth rate and the required return. Changes in rs and g have
especially strong effects on the stock price. This occurs because as rs declines or g increases,
Keller Medical Products just paid a dividend of $1.00, and the dividend is expected to grow at a
constant rate of 4%. What stock price is consistent with these numbers, assuming a 9% required
return?
$30
$40
$50
$60
$70
$90
-30% -20% -10% 0% 10% 20% 30%
% Change in Input
g
EXPECTED RATE OF RETURN ON A CONSTANT GROWTH STOCK
D1
P0
EXAMPLE
P0 $20.80
D1$1.040
EXTENSION
What is the expected price of this stock in 5 years?
N = 5
You buy a stock for $20.80, and you expect the next annual dividend to be $1.04. Furthermore,
you expect the dividend to grow at a constant rate of 4%. What is the expected rate of return and
dividend yield on the stock?
Using the constant growth equation, we transpose the equation to solve for rs. In doing so, we are
now solving for an expected return. Here is the resulting equation:
rs =
+
g
VALUING NONCONSTANT GROWTH STOCKS (Section 9-6)
EXAMPLE
D0$1.00
PV of dividends
1.0092$
1.0184
3.0554$ 27.6848 = Terminal value =
21.3777 0.050
= rs − gL
24.4331$
= P0
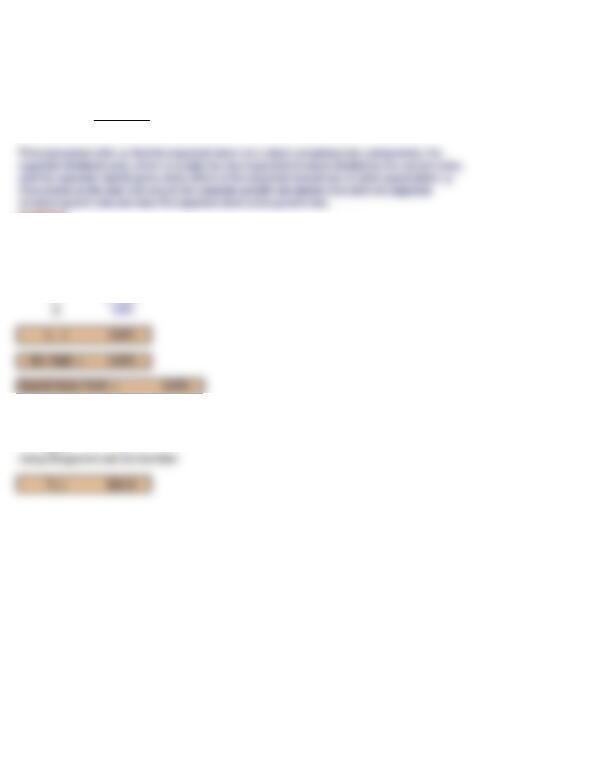
PREFERRED STOCK (Section 9-8)
EXAMPLE
For many companies, it is unreasonable to assume constant growth. Here valuation procedures
become a little more complicated, because we must estimate a short-run nonconstant growth rate,
then assume that after a certain point of time the firms will grow at a constant rate, and estimate
A special case of the constant growth model is a stock with a zero growth rate. Such a stock is a
A perpetual preferred stock pays a $10 annual dividend and has a required return of 10.3%. What
is its value?
A company just paid a $1.00 dividend, and it is expected to grow at 10% for the next 3 years. After
3 years the dividend is expected to grow at the rate of 4% indefinitely. If the required return is 9%,
what is the stock’s value today?
The point in time when the dividend begins to grow at a constant rate is called the “horizon date,”
EXAMPLE
N50
N50
I6%
Had this been a perpetual preferred with a required return of 6%, what would be the stock price?:
Consider another preferred stock that has a finite life of 50 years (a sinking fund preferred issue),
a $100 par value, and a $10 annual dividend. The required return is 8%. If the par value is repaid at
maturity in 50 years, what is the price of the stock?
What would its value be if the required return declined to 6%?
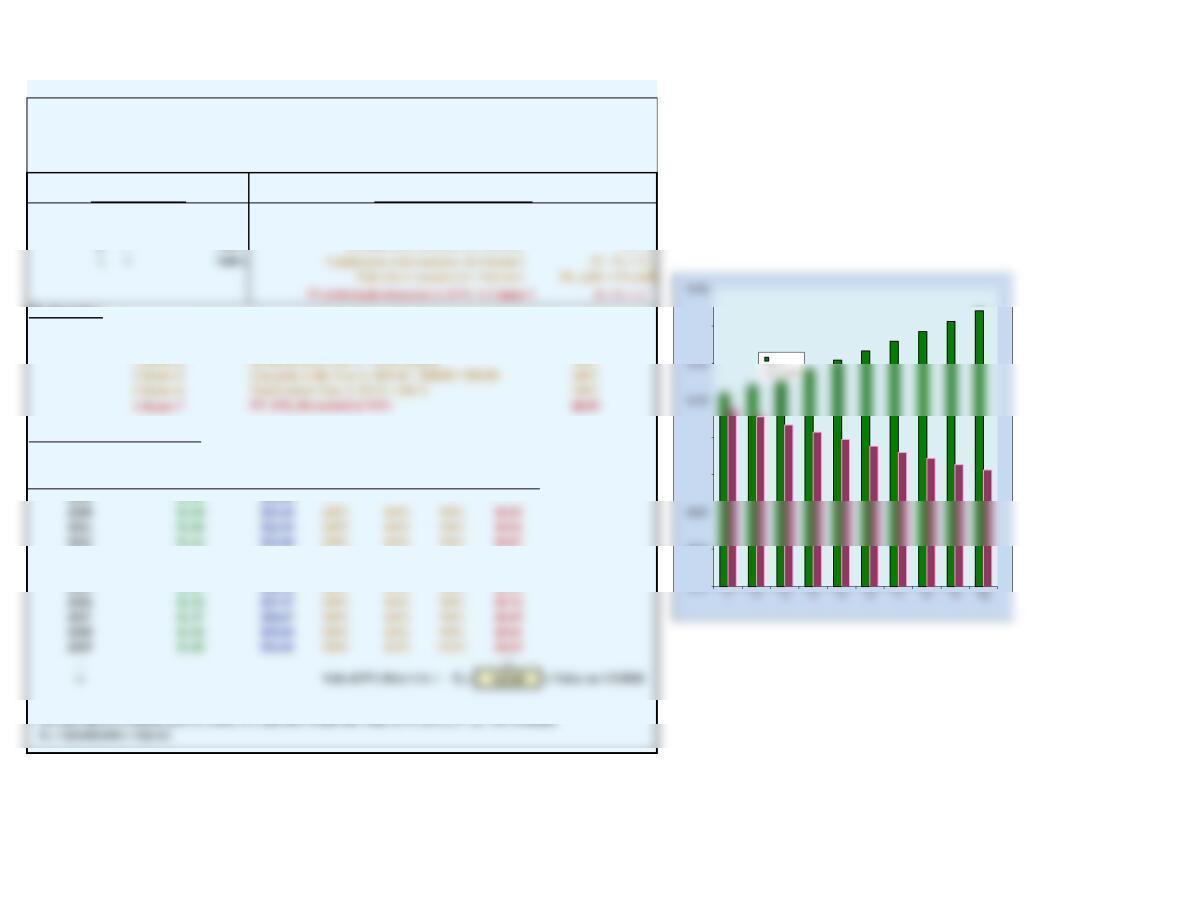
Table 9.1 Analysis of a Constant Growth Stock
12/12/2018
D0 = $1.00 Dividend in Year t , Dt , in Column 2 Dt-1(1 + g)
P0 = $20.80 Intrinsic value (and price) in Year t, Pt , in Column 3 Dt+1 / (rs − g)
g = 4.00% Dividend yield (constant) in Column 4
Dt / Pt-1
III. Examples:
Column 2
D1 = $1.00(1.04) $1.04
Column 3
P0 = $1.04 / (0.09 − 0.04) $20.80
IV. Forecasted Results over Time: PV of
At end Dividend Capital Total dividend
of year: Dividend Price * yield gains yield return at 9.0%
(1) (2) (3) (4) (5) (6) (7)
2023 $1.17 $24.33 5.0% 4.0% 9.0% $0.83
2024 $1.22 $25.31 5.0% 4.0% 9.0% $0.79
2025 $1.27 $26.32 5.0% 4.0% 9.0% $0.75
I. Basic Information:
II. Formulas Used in the Analysis:
In Section I we show the basic inputs, the formulas are in Section II, and in Section III we give examples of how cells in Columns 2
through 7 are calculated. The dividends and stock prices grow at a constant rate of 4%; the capital gains yield is equal to the growth
rate; the dividend yield is a constant 5.0%; and the total annual return is a constant 9.0%. We plot the first 10 years of dividends and their
PVs in the chart to the right of the table.
* Because this is a constant growth stock, we could have found the value for Pt as Pt-1(1 + g). For example,
$0.00
$0.20
$0.60
$0.80
$1.40
DPS
Table 9.1a Analysis of a Constant Growth Stock: Beginning with Earnings
III. Explanation of the Columns
2.
3.
4.
5.
7.
The stock price is found by use of Equation 9.2, P0 = D1 / (rs – g), e.g., $1.04 / (0.09 – 0.04)
= $20.80 at the start of 2020.
8. The stock price grows at the constant rate, 4%.
10.
The capital gains yield is (Pt – Pt-1) / Pt = ($21.63 – $20.80) / $20.80 = 4.0%, and it is equal
to the constant growth rate.
The growth rate is equal to the fraction of earnings retained times ROE, or g = (1 – Payout) × ROE =
(1 – 0.6)(10%) = 0.4(10%) = 4% for 2020 and all subsequent years. Earnings, dividends, and the stock price all
grow at this constant rate.
2020.
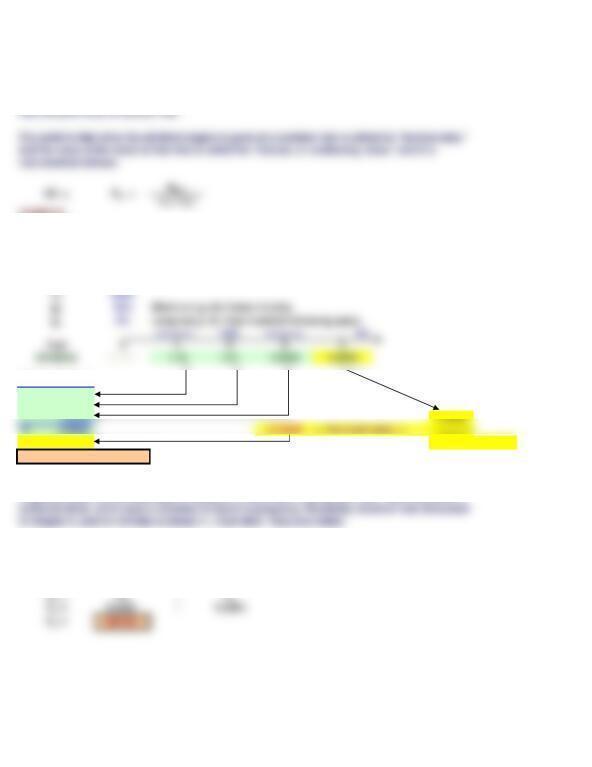
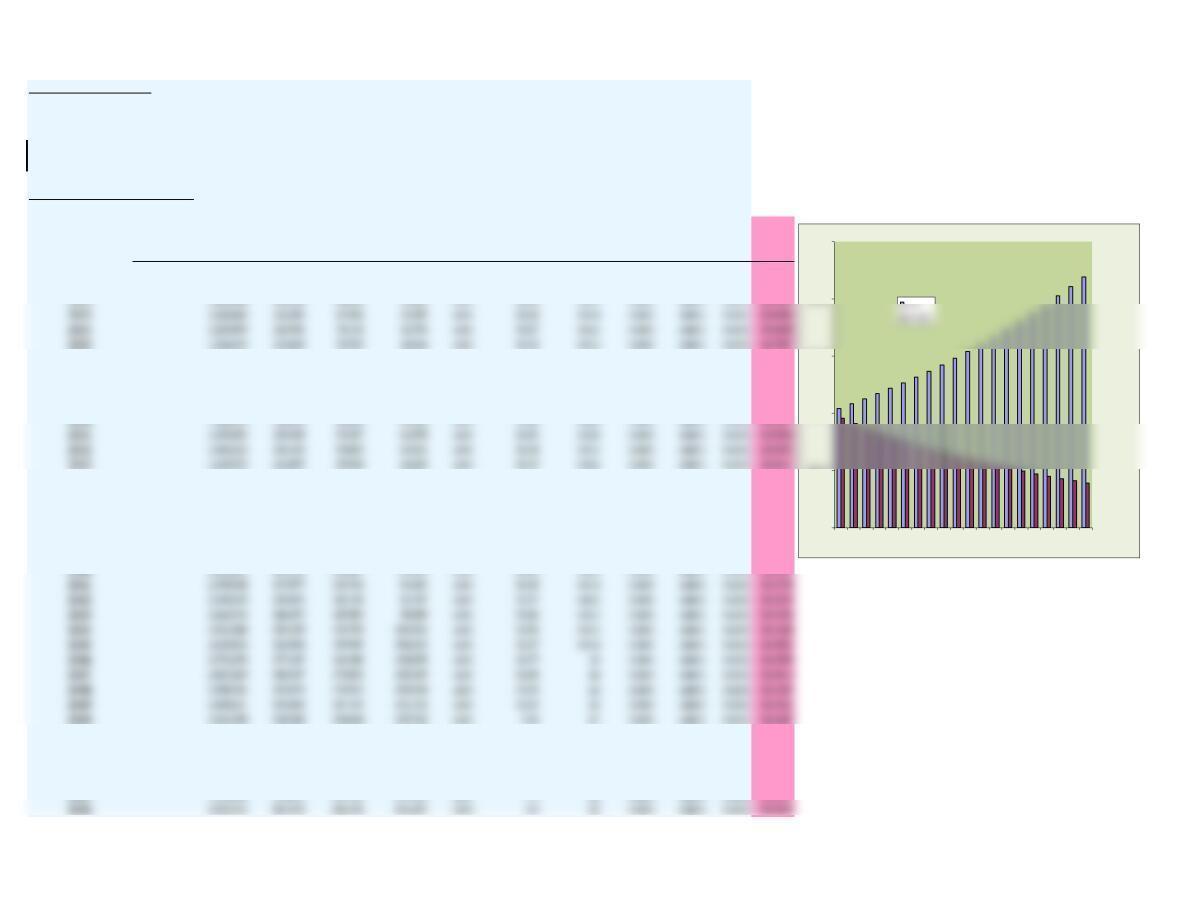
ALTERNATIVE VERSION OF TABLE 9.1 (Not in text). We know that dividends must come from earnings, and earnings
must come from assets, which are bought with debt and equity capital. Therefore, we develop below Table 9.1a, which
starts with assets and ROA (or ROE), calculates net income, applies a payout ratio, and then gets DPS and other values.
Total dividends paid at the end of year, e.g., dividends in 2020 were (payout ratio)(net income) = 0.6($100,000) =
$60,000.
I. Data Used By Analyst Equity = Assets (no debt): $1,000,000
Rate of return on equity, ROE: 10%
Dividend payout: 60.0%
Shares outstanding: 60,000
Required rate of return, rs:9.00%
II. Forecasted Results Over Time
Assets Net Total Earnings Growth Price Dividend Capital Total PV DIV
Year and Equity Income Dividends Retained Rate DPS per Share Yield Gains yield Return at 9.0%
(1) (2) (3) (4) (5) (6) (7) (8) (9) (10) (7)
2020 $1,000,000 $100,000 $60,000 $40,000 $20.8
2021 $1,040,000 $104,000 $62,400 $41,600 4.0% $1.04 $21.6 5.00% 4.00% 9.00% $0.9541
2026 1,265,319 126,532 75,919 50,613 4.0% $1.27 $26.3 5.00% 4.00% 9.00% $0.7545
2027 1,315,932 131,593 78,956 52,637 4.0% $1.32 $27.4 5.00% 4.00% 9.00% $0.7199
2028 1,368,569 136,857 82,114 54,743 4.0% $1.37 $28.5 5.00% 4.00% 9.00% $0.6868
2029 1,423,312 142,331 85,399 56,932 4.0% $1.42 $29.6 5.00% 4.00% 9.00% $0.6553
2034 1,731,676 173,168 103,901 69,267 4.0% $1.73 $36.0 5.00% 4.00% 9.00% $0.5182
2035 1,800,944 180,094 108,057 72,038 4.0% $1.80 $37.5 5.00% 4.00% 9.00% $0.4944
2036 1,872,981 187,298 112,379 74,919 4.0% $1.87 $39.0 5.00% 4.00% 9.00% $0.4717
2037 1,947,900 194,790 116,874 77,916 4.0% $1.95 $40.5 5.00% 4.00% 9.00% $0.4501
2038 2,025,817 202,582 121,549 81,033 4.0% $2.03 $42.1 5.00% 4.00% 9.00% $0.4295
2039 2,106,849 210,685 126,411 84,274 4.0% $2.11 $43.8 5.00% 4.00% 9.00% $0.4098
2051 3,373,133 337,313 202,388 134,925 4.0% 3.4 70 5.00% 4.00% 9.00% $0.2332
2052 3,508,059 350,806 210,484 140,322 4.0% 3.5 73 5.00% 4.00% 9.00% $0.2225
2053 3,648,381 364,838 218,903 145,935 4.0% 3.6 76 5.00% 4.00% 9.00% $0.2123
2054 3,794,316 379,432 227,659 151,773 4.0% 3.8 79 5.00% 4.00% 9.00% $0.2026
$0.00
$0.50
$1.00
$1.50
$2.00
$2.50
1 2 3 4 5 6 7 8 9 10 11 12 13 14 15 16 17 18 19 20
2066 6,074,823 607,482 364,489 242,993 4.0% 6.1 126 5.00% 4.00% 9.00% $0.1153
2067 6,317,816 631,782 379,069 252,713 4.0% 6.3 131 5.00% 4.00% 9.00% $0.1100
2068 6,570,528 657,053 394,232 262,821 4.0% 6.6 137 5.00% 4.00% 9.00% $0.1050
2069 6,833,349 683,335 410,001 273,334 4.0% 6.8 142 5.00% 4.00% 9.00% $0.1002
Part 1. Key Inputs
2020 2021 2022 2023 2024
Part 2. Forecast of Cash Flows During Period of Nonconstant Growth
Historical
2019 2020 2021 2022 2023 2024
Sales $3,000.0 $3,300.0 $3,597.0 $3,884.8 $4,156.7 $4,447.7
Operating costs 2,622.0 2,871.0 3,129.4 3,340.9 3,533.2 3,780.5
DEP = Depreciation 100.0 116.6 168.0 158.7 169.8 181.7
Net fixed assets $1,000.0 $1,080.0 $1,166.4 $1,259.7 $1,347.9 $1,442.2
Net oper. working capital (NOWC) 800.0 864.0 933.1 1,007.8 1,078.3 1,153.8
Total operating capital $1,800.0 $1,944.0 $2,099.5 $2,267.5 $2,426.2 $2,596.0
Net CAPEX = Change in net fixed assets 130.0 80.0 86.4 93.3 88.2 94.4
230.0 196.6 254.4 252.0 258.0 276.1
ΔNOWC 150.0 64.0 69.1 74.6 70.5 75.5
Part 3. Horizon Value and Intrinsic Value Estimation
Estimated Value at the Horizon, 2024
FCF2024 (1+gFCF)
Free Cash Flow (2025) $202.0
FCF2025
Horizon Value at 2024, HV2024 $3,366.7 WACC − gFCF
Forecasted Years
HV2024 =
CAPEX = Gross capital expenditures
= Net CAPEX + DEP
Forecasted Years
VALUING THE ENTIRE CORPORATION Part 1 of the following table sets forth the analyst’s assumptions for specific operating variables. These
values are then used, in Part 2, to project free cash flows from 2020 out to the “horizon year,” after which it is assumed that the 2024
FCF will grow at the constant rate gLR. The PV of the FCFs during the nonconstant growth period are then discounted at the WACC.
Finally, in Part 3, we find the sum of the nonconstant FCF PVs, then use the constant growth model to find the value of the firm‘s
Long-run FCF growth, gFCF 4.0%
Calculation of Firm’s Intrinsic Value
Sum of PVs of FCFs, 2020-2024 $474.7
PV of HV2024 2,090.5
MV of nonoperating assets 0.0
Total corporate value $2,565.2
SECTION 9-4 12/12/2018
SOLUTIONS TO SELF-TEST QUESTIONS
P0$40.00
3. If D1 = $2.00, g = 6%, and P0 = $40, what is the stock’s expected dividend yield, capital gains
yield, and total expected return for the coming year?
SECTION 9-5 12/12/2018
SOLUTIONS TO SELF-TEST QUESTIONS
D1$1.00
D1$1.00
g0%
rs11%
Payout 25%
rs12%
3a. Firm A is expected to pay a dividend of $1 at the end of the year. The required rate of
return is rs = 11%. Other things held constant, what would the stock’s price be if the growth
rate was 5%?
4b. What would its expected growth rate be if it paid out 75% of its earnings as dividends?
g5%
rs11%