Courtesy of CRC Press/Taylor & Francis Group
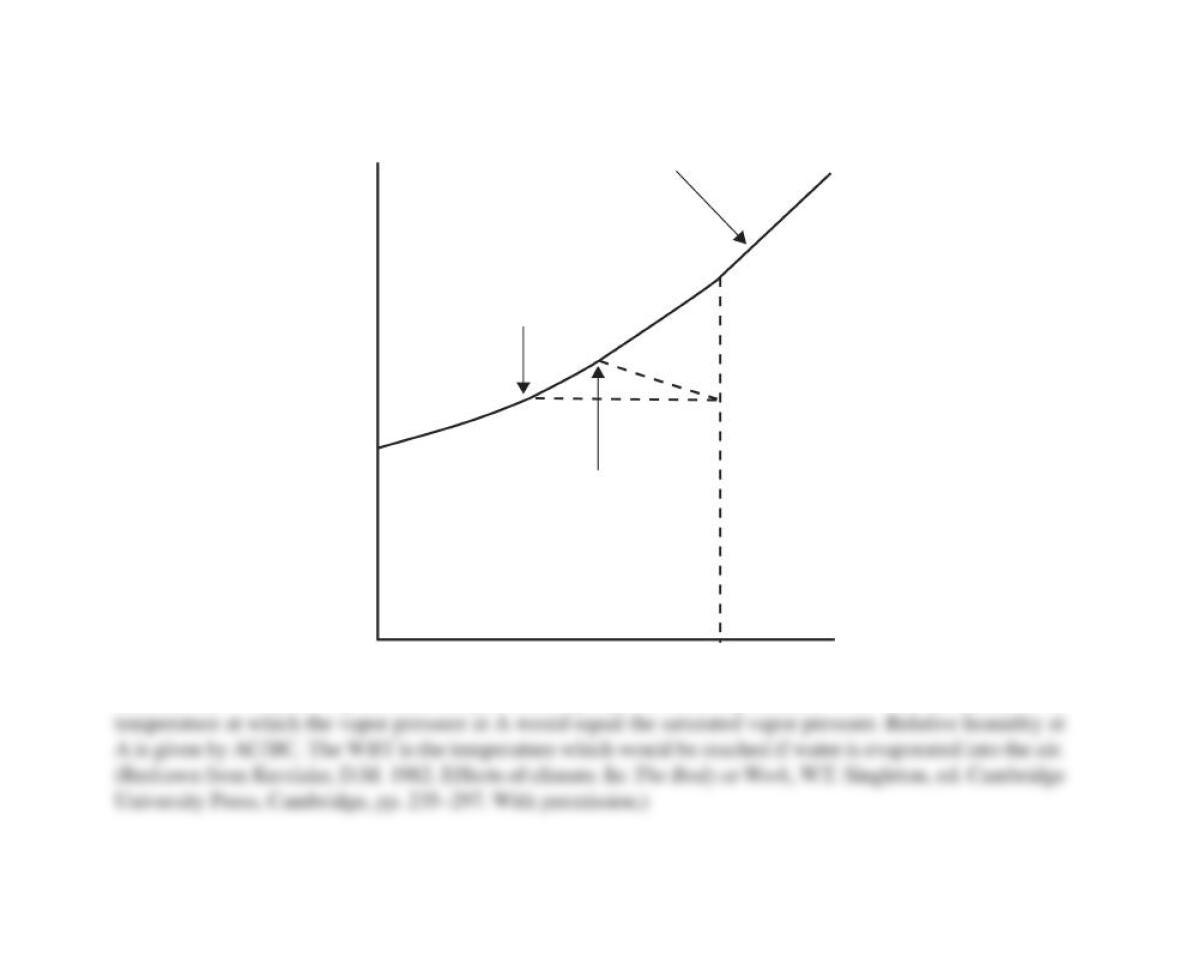
Temperature
C
Wet bulb
temperature
Dew point
Water vapor pressure
D
A
B
Saturated vapor pressure
FIGURE 9.1 Relationship between temperature, vapor pressure, dew point, and WBT. The dew point is the
009×001.eps
Courtesy of CRC Press/Taylor & Francis Group
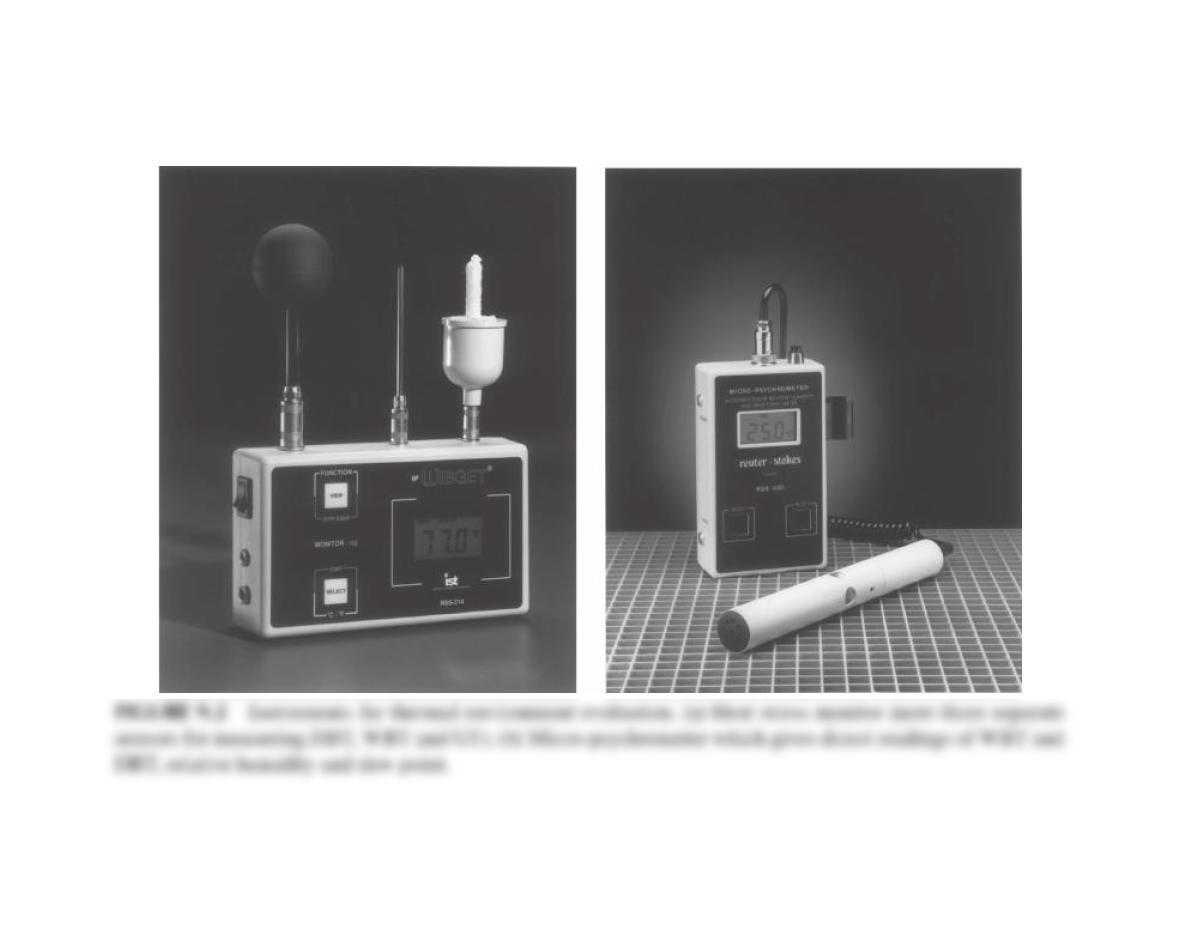
(a) (b)
009×002.eps
Courtesy of CRC Press/Taylor & Francis Group
25
0
20
40
60
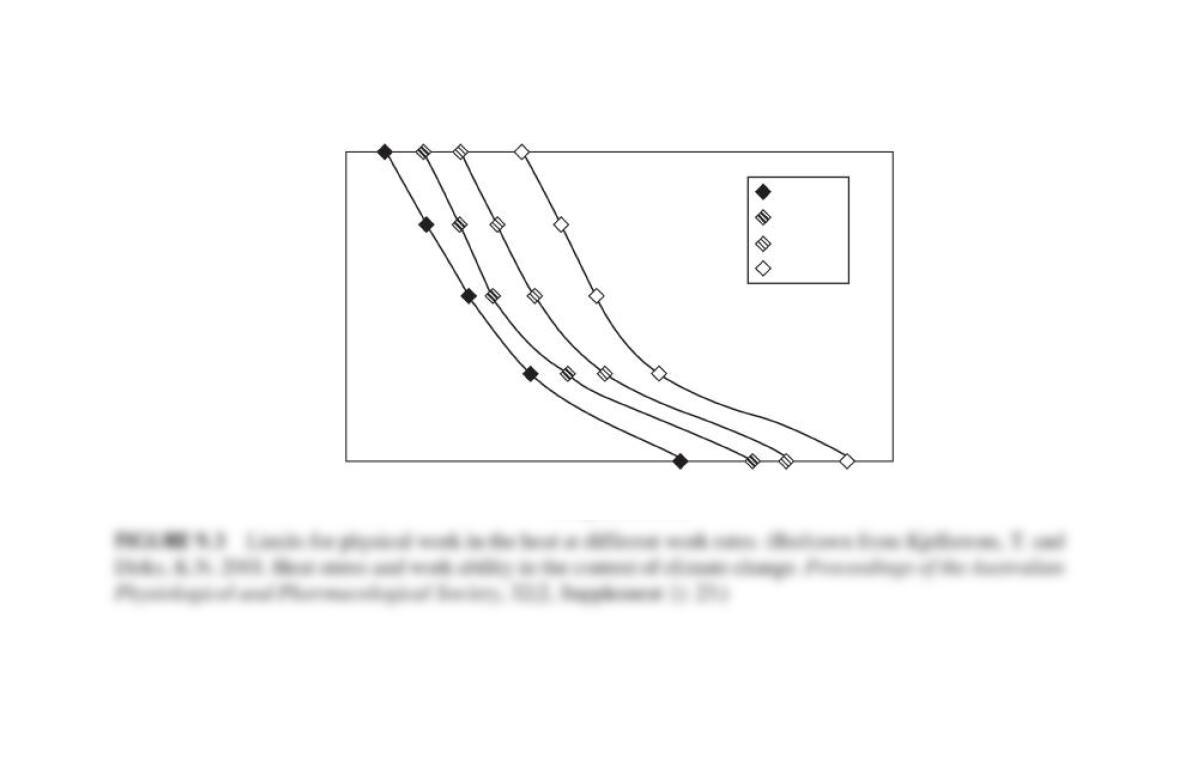
Work ability (%)
80
100
30 35
Temperature (°C)
40
500 W
400 W
300 W
200 W
009×003.eps
Courtesy of CRC Press/Taylor & Francis Group
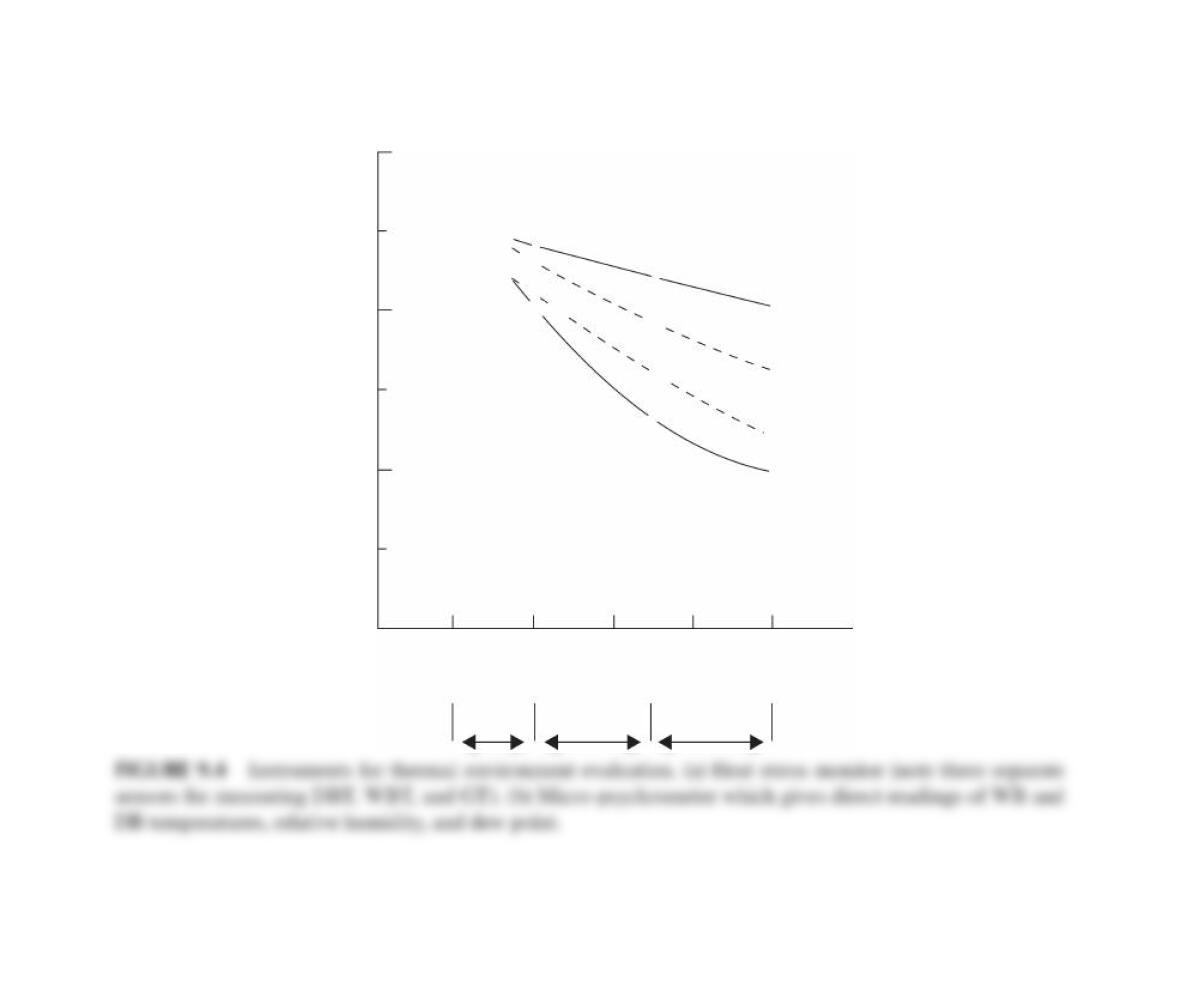
100
25
30
WBGT (°C)
35
32.2
31.4
30.6
30.0 29.4
31.1
30.0
27.9
25.9
25.0
26.7
28.0
d
c
b
a
200 300 400
Metabolic energy expenditure rates
kcal/h
Light
work
Moderate
work
Heavy
work
500
009×004.eps
Courtesy of CRC Press/Taylor & Francis Group
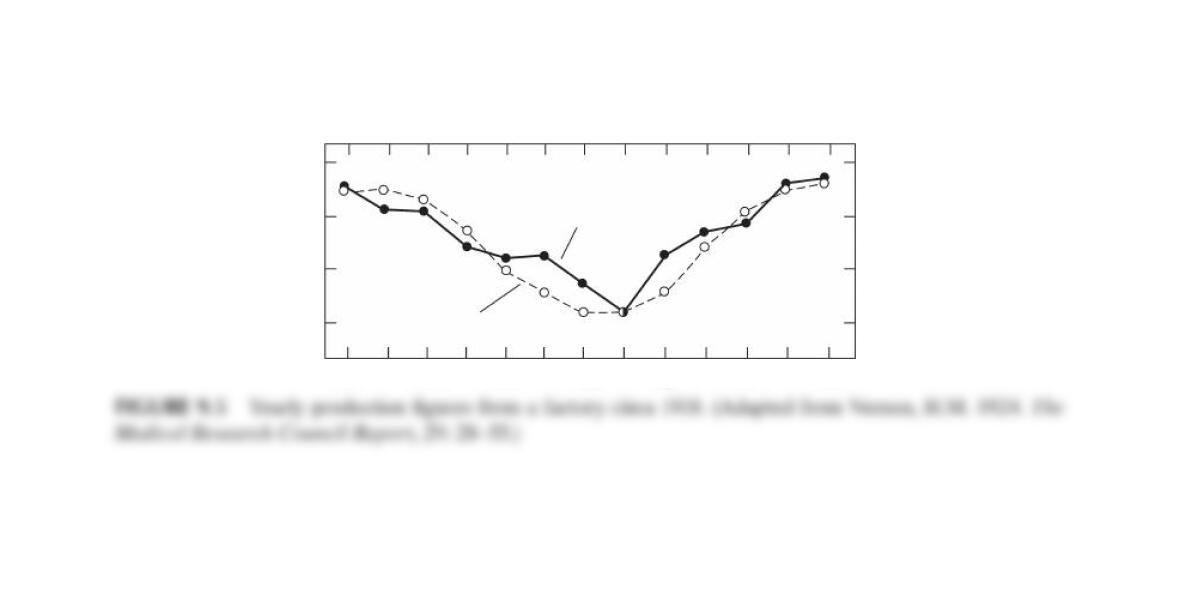
Jan.
94
98
102
106
Mar. May
Temperature
Output
Relative output
July Sept. Nov. Jan.
17°
12°
Temperature
7°
2°
009×005.eps
Courtesy of CRC Press/Taylor & Francis Group
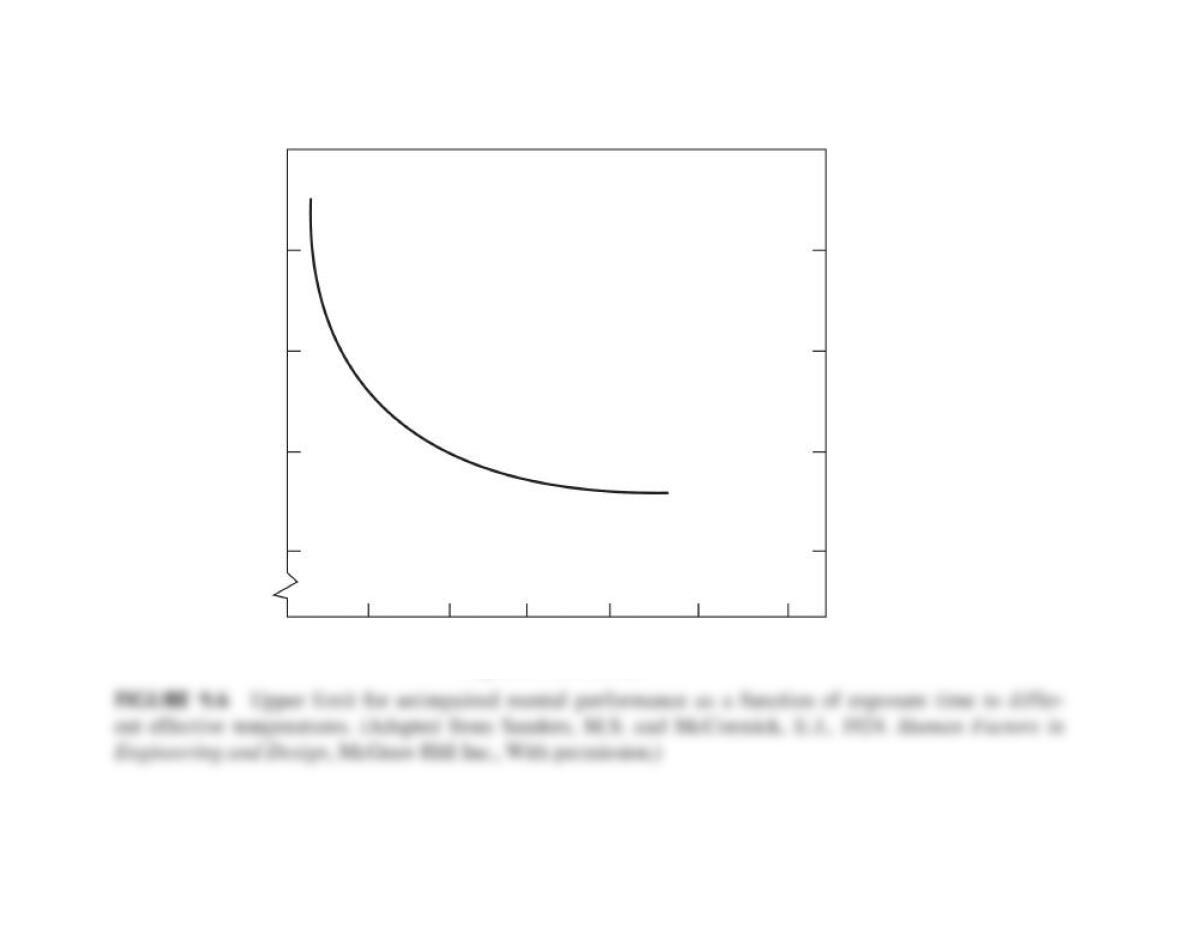
060 120 180 240 300 360
26.7
Effective temperature
32.2
37.8
43.4
48.9
Exposure time (min)
009×006.eps
Courtesy of CRC Press/Taylor & Francis Group
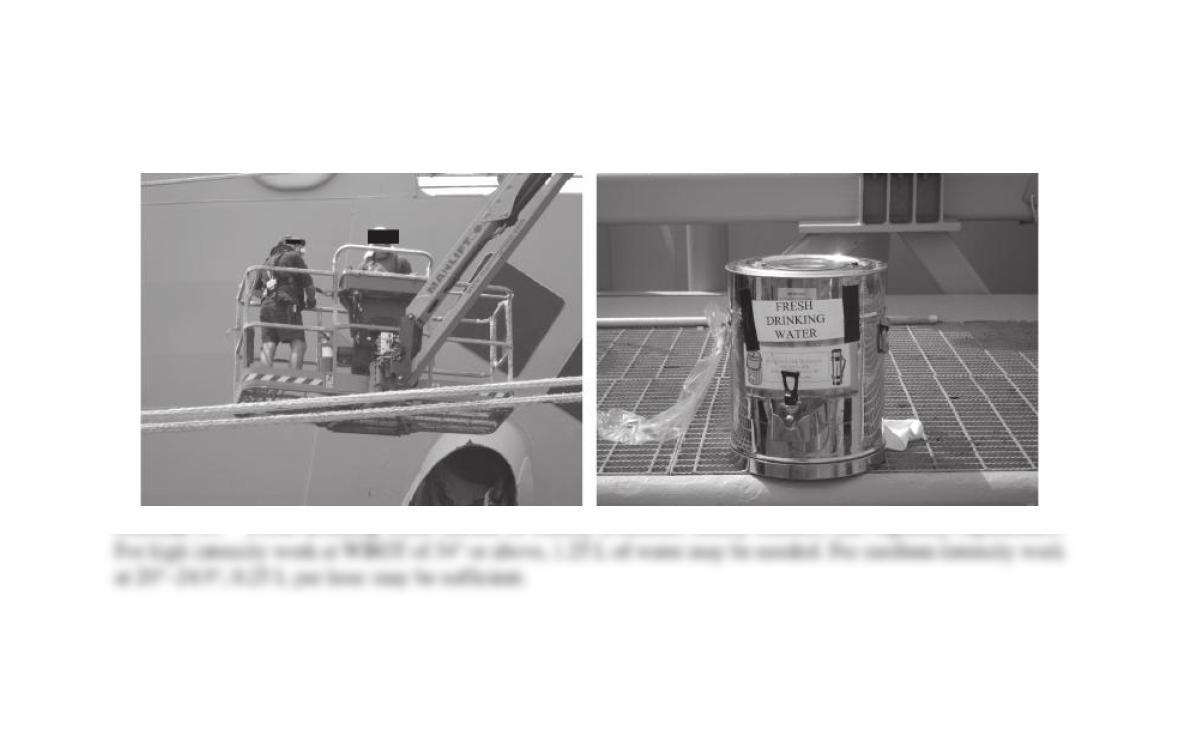
(a) (b)
FIGURE 9.7 Fresh drinking water should be readily available, clearly marked, and regularly replenished.
009×007.eps