
Chapter 8
Business Cycles: An Introduction
◼ Chapter Outline, Overview, and Teaching Tips
Chapter Outline
Business Cycle Basics
Business Cycle Illustration
Macroeconomic Variables and the Business Cycle
Real GDP and Its Components
Macroeconomics in the News: Leading Economic Indicators
Unemployment
A Brief History of U.S. Business Cycles
Pre–World War I
Time Horizons in Macroeconomics
Keynesian and Classical Views on Economic Fluctuations
The Short Run Versus the Long Run
Price Stickiness
Perfect Competition Versus Monopolistic Competition
Road Map for Our Study of Business Cycles
Chapter Overview and Teaching Tips
This chapter provides an introduction to Part Four of the book by first discussing the basic features of business
cycles and how key macroeconomic variables—real GDP and its components, unemployment, inflation,
interest rates, stock prices, and term and credit spreads—vary over the business cycle. Discussing the cyclical
movements of these variables with Figures 8.2 to 8.9 lets students know what data the aggregate demand-
82 Mishkin • Macroeconomics: Policy and Practice, Second Edition
◼ Answers to End of Chapter Review Questions and Problems
Answers to Review Questions
Business Cycle Basics
1. Business cycles are fluctuations in aggregate economic activity that follow a sequence of expansion,
peak, contraction, and trough. The period between a peak and a trough is a business cycle contraction
Macroeconomic Variables and the Business Cycle
2. The distinction is based on the direction of change in a variable’s value relative to changes in the
overall level of aggregate economic activity. Procyclical variables move in the same direction as
3. The distinction is based on the timing of directional changes in a variable’s value relative to business
cycle peaks and troughs. A variable whose value starts to rise before a business cycle trough and to
4. Real consumer spending: procyclical, coincident; real investment spending: procyclical, coincident;
unemployment: countercyclical, timing is uncertain; inflation: procyclical, lagging; S&P 500 Index:
A Brief History of U.S. Business Cycles
5. The “Great Inflation” was the period from the mid-1960s to the early 1980s when annual inflation
rates rose from an average of less than 2 percent to more than 15 percent and exhibited extremely

Chapter 8 Business Cycles: An Introduction 83
Time Horizons in Macroeconomics
6. Flexible prices and wages rise and fall in response to demand and supply shocks and move to new
7. In the long run, prices and wages are completely flexible and fully adjust to their long-run
equilibrium values. In the short run, prices and wages are sticky and do not fully adjust to long-run
8. Classical macroeconomists hold that prices and wages are flexible so that the economy adjusts
quickly to long-run equilibrium following demand and supply shocks. (In other words, the short run
is a very short period of time.) They advise that government policymakers, therefore, should focus
Price Stickiness
9. Classical macroeconomists treat economic actors as price takers who buy or sell standardized
products at prices determined in perfectly competitive markets. Given this market structure, prices
10. Menu costs refer to the costs a firm incurs when it changes its prices. These costs may include
printing new catalogs, price lists, or menus, informing salespeople of new prices, advertising to
inform customers of the new prices, and re-marking the prices of goods on shelves and in inventories.
Answers to Problems
Business Cycle Basics
1. a. There are two expansions according to this graph: (1) from January 1912 to January 1913, which
lasted 12 months, and (2) from December 1914 to August 1918, which lasted 44 months, or 3
2. This statement is not entirely correct. A contraction is a decrease in aggregate economic activity,
measured by changes in many economic indicators. The NBER Business Cycle Dating Committee
uses many sources of information to determine when the economy is experiencing a contraction or
84 Mishkin • Macroeconomics: Policy and Practice, Second Edition
3. a. Although home prices declined slightly before aggregate economic activity declined, home prices
decreased during the current contraction, suggesting this could be a cyclical variable. As of May
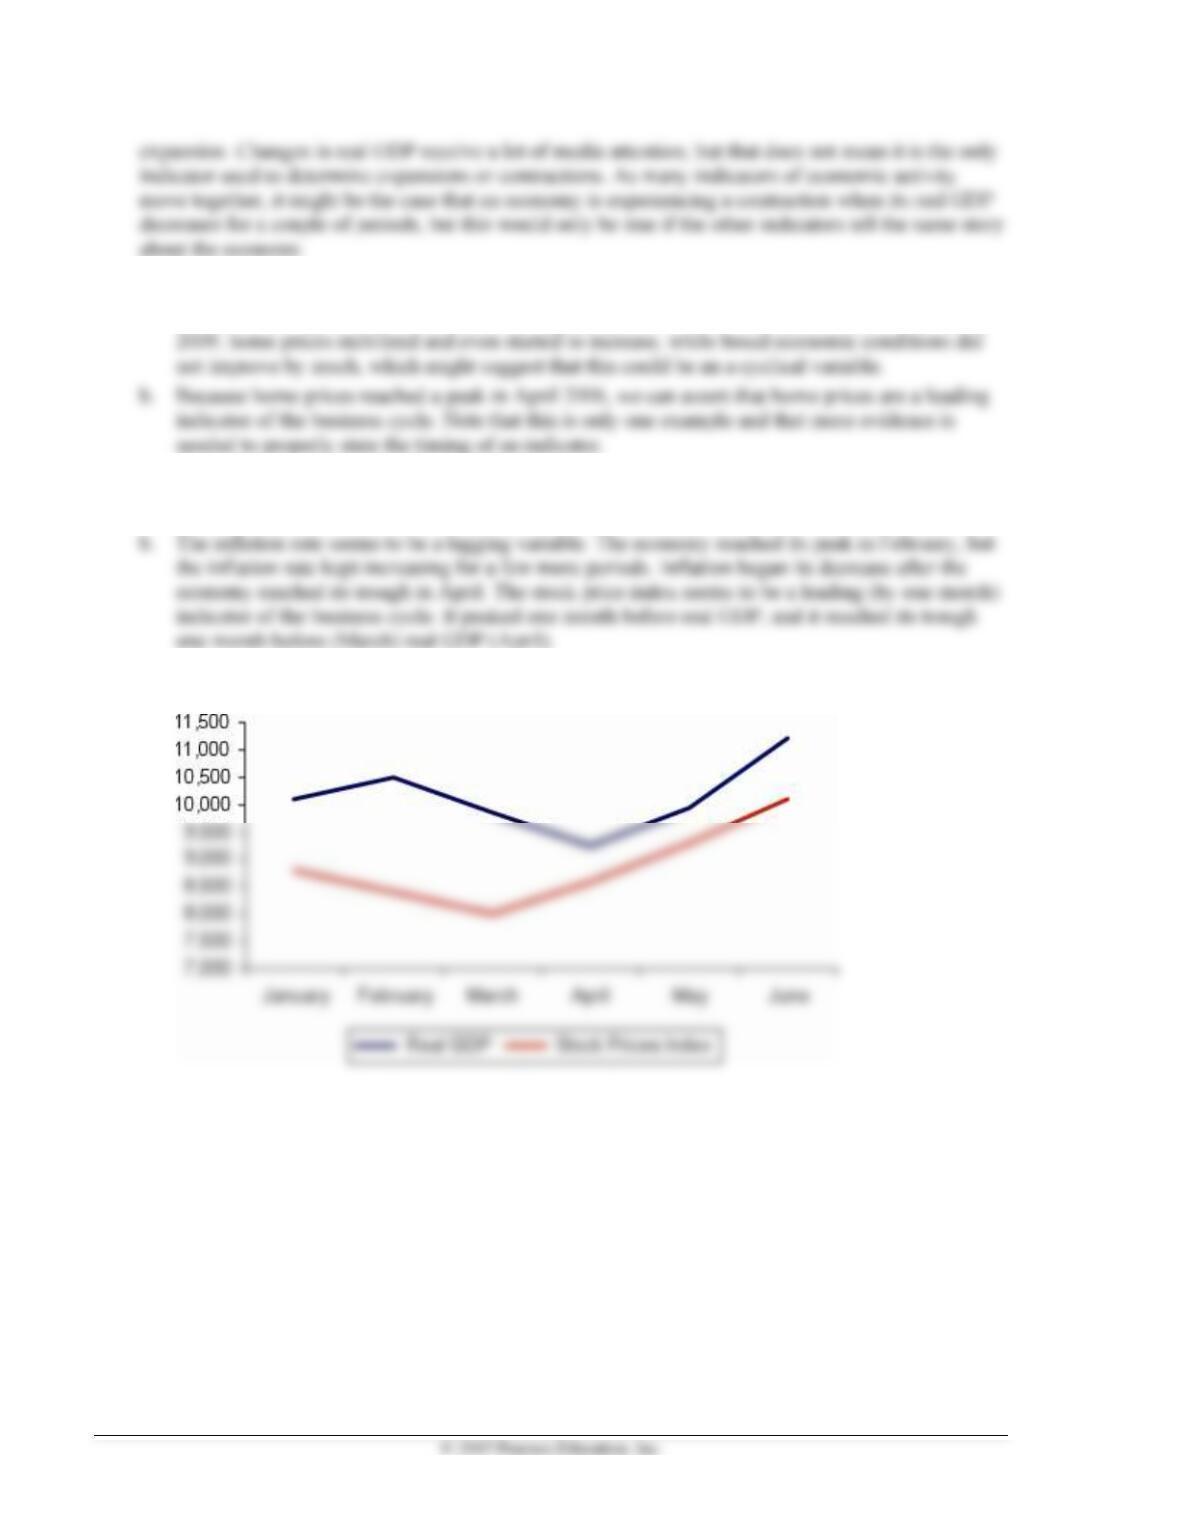
4. a. Considering only changes in real GDP, the economy reached its peak in February and reached its
trough in April.
5. a. Real GDP and stock prices index:
Chapter 8 Business Cycles: An Introduction 85
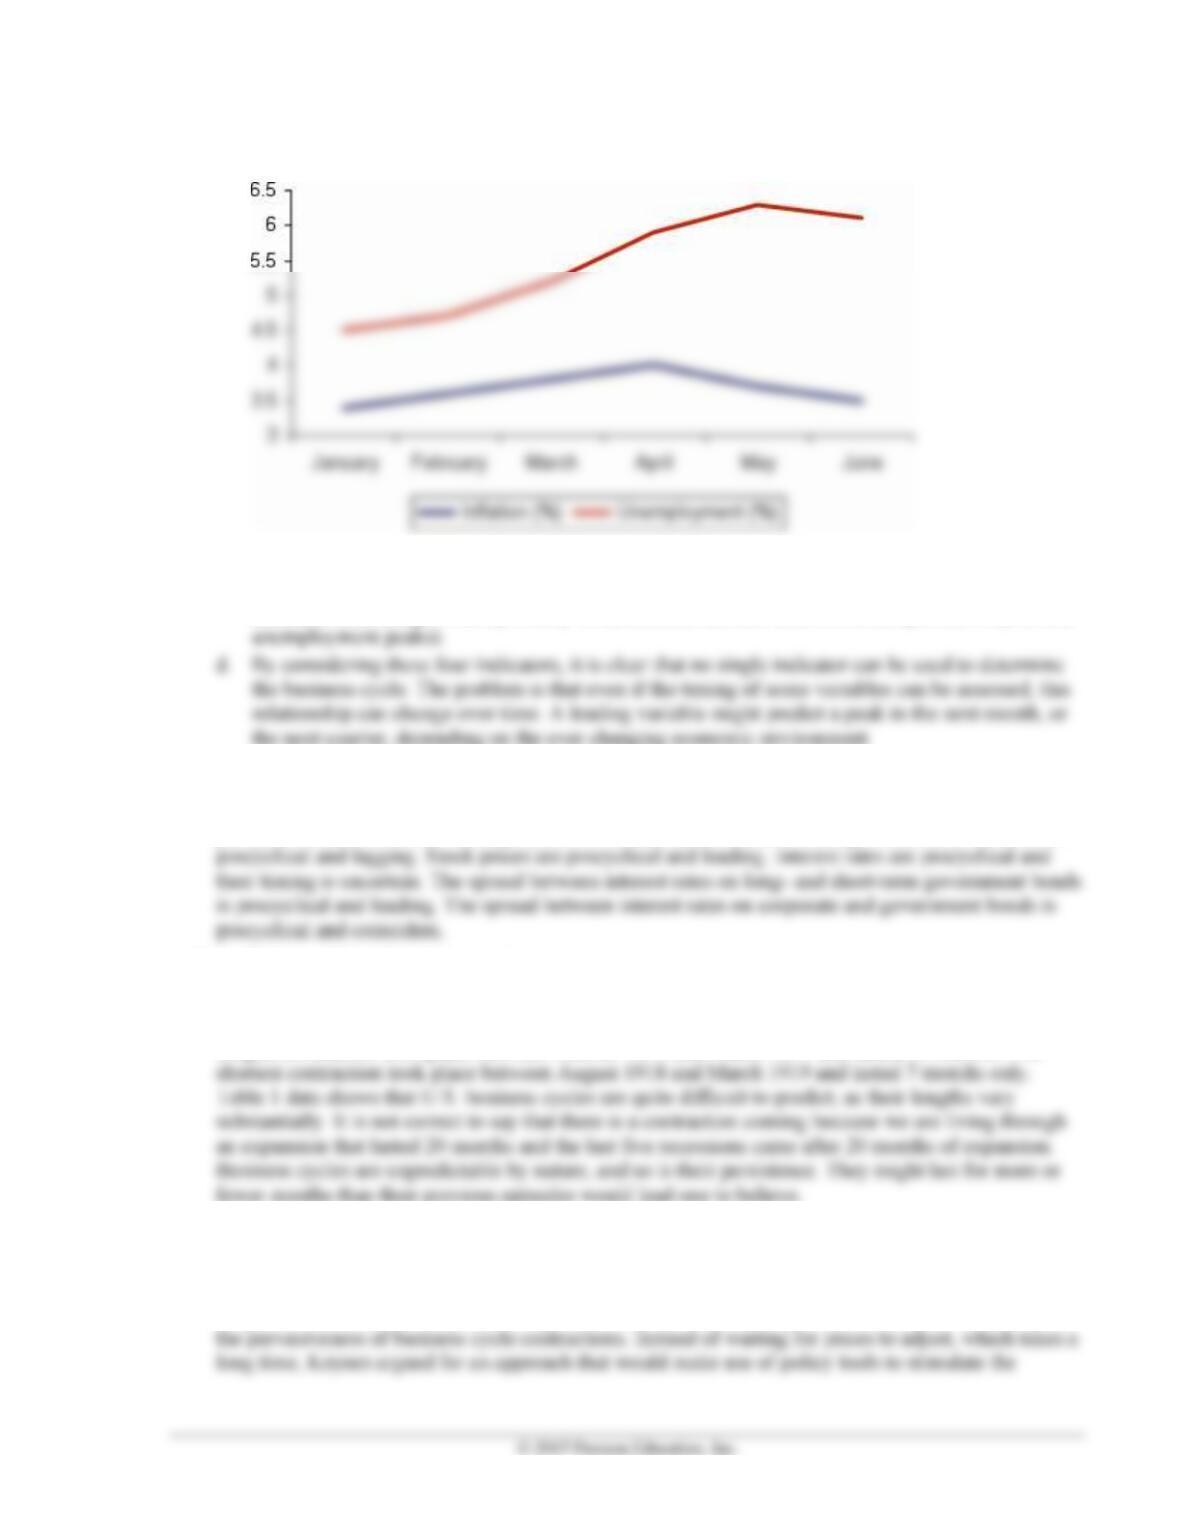
b. Unemployment and inflation rates:
c. Considering real GDP and the unemployment rate, it is not clear that the economy reached its
trough in April because the unemployment rate kept increasing after that period. Using other
indicators, the trough would probably be determined at some date between April and May (when
the next quarter, depending on the ever changing economic environment.
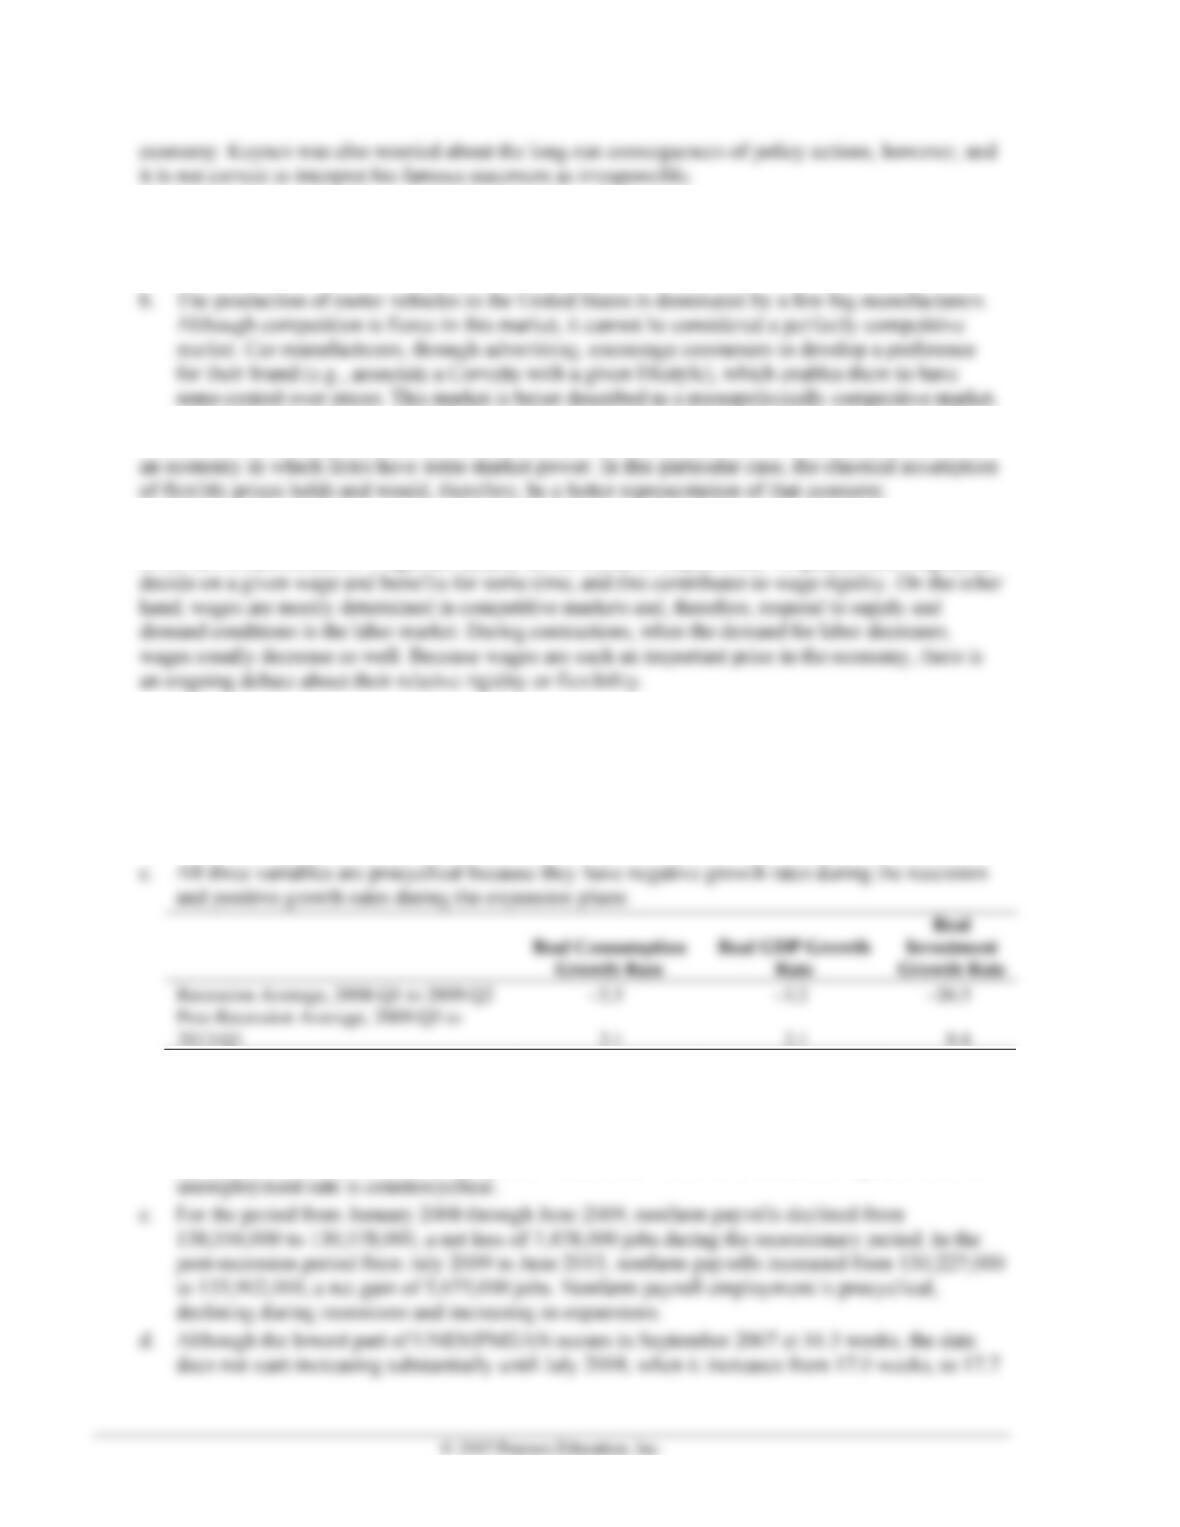
Macroeconomic Variables and the Business Cycle
6. Real GDP is procyclical and coincident. Consumer and investment spending also appear to be
procyclical and coincident. Unemployment is countercyclical and its timing is uncertain. Inflation is
A Brief History of U.S. Business Cycles
7. The longest expansion took place between March 1991 and March 2001 and lasted 120 months. The
shortest expansion took place between March 1919 and January 1920 and lasted 10 months only. The
longest contraction took place between October 1873 and March 1879 and lasted 65 months. The
fewer months than their previous episodes would lead one to believe.
Time Horizons in Macroeconomics
8. This statement is not correct. Keynes stated that we should primarily focus on short-run fluctuations
because it takes a long time for the economy to reach its long-run equilibrium. Waiting for such a
long time would be useless, Keynes argued, because there are policy tools that can be used to reduce
86 Mishkin • Macroeconomics: Policy and Practice, Second Edition
Price Stickiness
9. a. Dairy products are considered to be quite standardized. The market for dairy products is,
therefore, a pretty competitive market, in which buyers and sellers are price takers.
10. If an economy is composed of only competitive markets, then prices would be more flexible than in
11. There are a few aspects of wage determination that contribute to their relative stickiness, in particular
in the downward direction. Wages are usually set for a year or maybe more. Employers and employees
◼ Answers to Data Analysis Problems
1. a. The most recent recession, according to the National Bureau of Economic Research (NBER)
spanned 2008:Q1 through 2009:Q2.
b. See table below, for averages from 2008:Q1 through 2013:Q1.
2. a. The most recent recession, according to the NBER spanned January 2008 through June 2009.
b. From January 2008 to June 2009, the unemployment rate increased from 5.0 percent to 9.5
percent, an increase of 4.5 percentage points. From July 2009 through June 2013, the
unemployment rate fell from 9.5 percent to 7.6 percent, a decline of 1.9 percentage points. The
Chapter 8 Business Cycles: An Introduction 87
3. a. The most recent recession, according to the NBER, spanned January 2008 through June 2009.
b. The average of the consumer sentiment index is 63.6 during the recessionary period and 71.6
from July 2009 to January 2013. Consumer sentiment is procyclical, declining during recessions
and rising during expansions.
c. Industrial production declined from 100.5 in January 2008 to 83.8 in June 2009, a decrease of
16.6 percent during that period. After that, it increased from 84.5 in July 2009 to 99.0 in June
2013, and increase of 17.2 percent during that time. Industrial production is procyclical, declining
during recessions and rising during expansions.
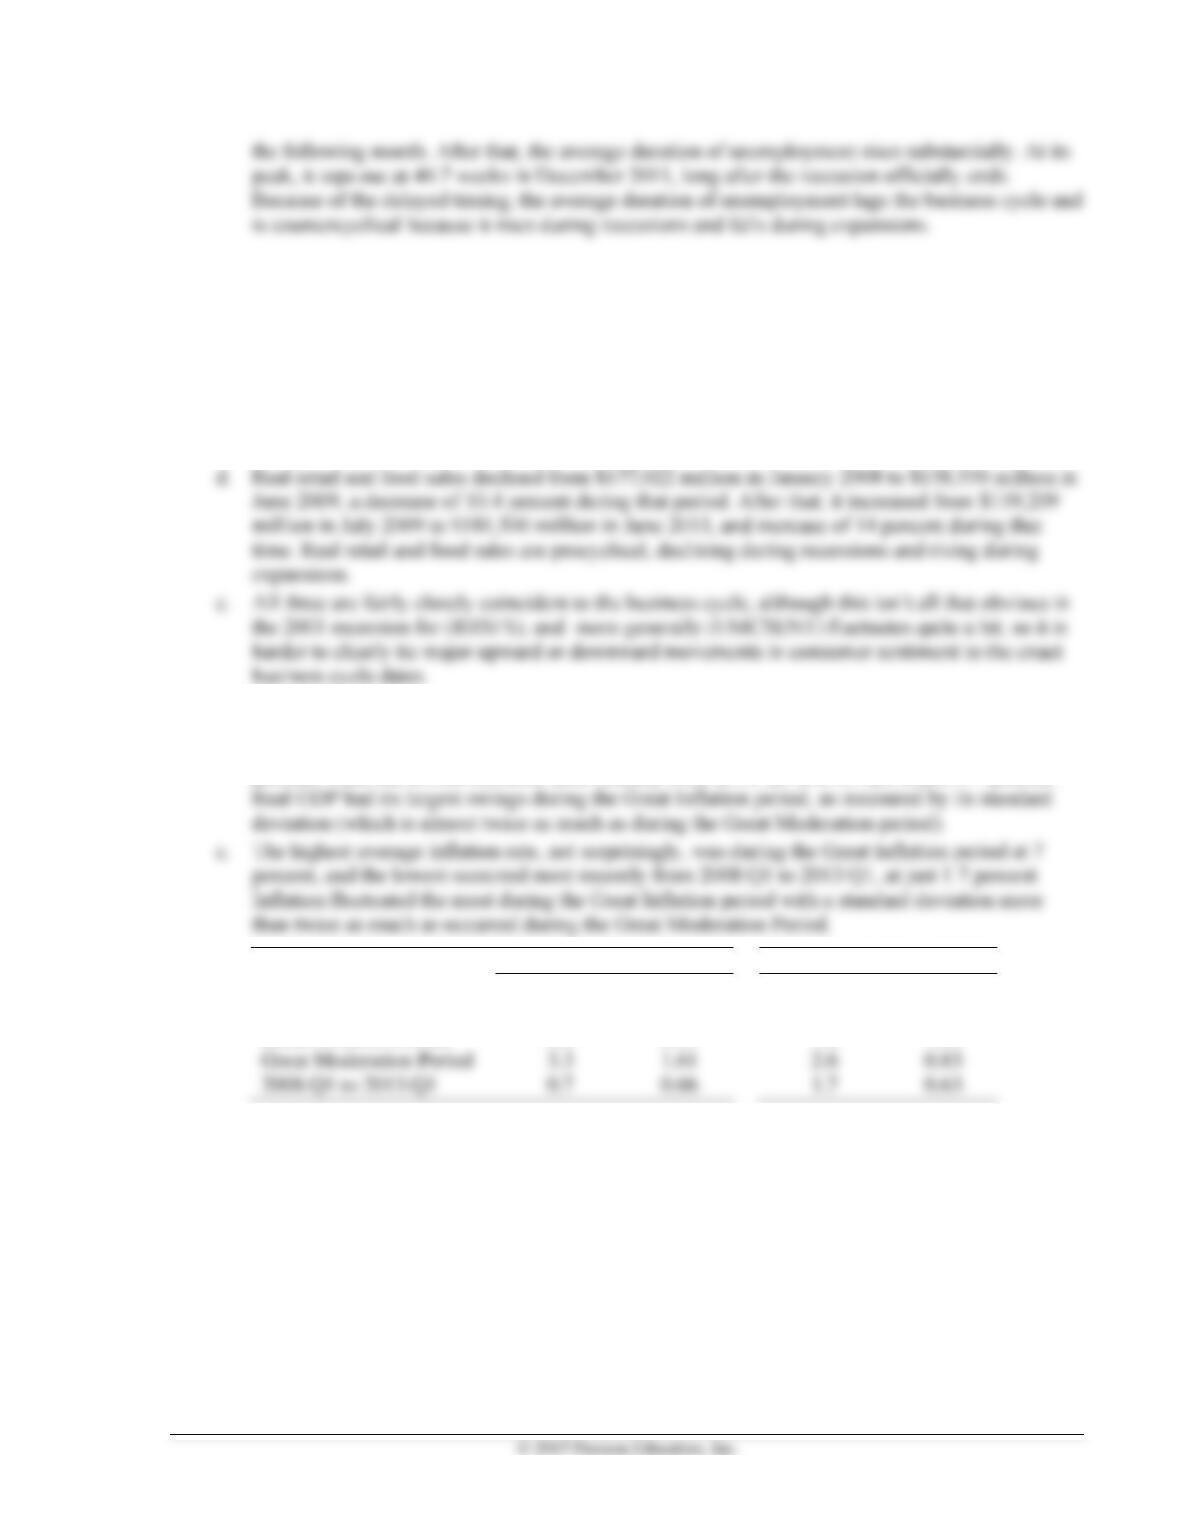
4. a. See table below.
b. The highest average real GDP growth occurred during the Great Moderation period at 3.3
percent, while the lowest occurred most recently from 2008:Q1 to 2013:Q1, at just 0.7 percent.
Real GDP Growth
Inflation Rate
Average
Standard
Deviation
Average
Standard
Deviation
Great Inflation Period
2.5
2.94
Great Moderation Period
3.3
1.61
2.6
0.83
7.0
1.93
◼ Data Sources, Related Articles, and Discussion Questions
A. For Information About Dating and Measurement of Business Cycles
Data Source
Federal Reserve Bank of St. Louis: http://research.stlouisfed.org/fred2/series/GDPCA?cid=106. Here you
can get access to a chart showing the evolution of real GDP. Note how during the shaded periods (i.e.,
recessions as determined by the NBER) real GDP either stagnated or decreased.

88 Mishkin • Macroeconomics: Policy and Practice, Second Edition
Related Article
Discussion Question
What are the consequences of a business cycle contraction for a college graduate?
Answer: The determination of a business cycle contraction depends on many indicators, all of them related
B. For Information About the Behavior of Macroeconomic Variables During
the Business Cycle and International Business Cycles
Data Source
The Conference Board: http://www.conference-board.org/data/bcicountry.cfm?cid=1. Follow the “press
release with graph and summary table” link to download a PDF file showing the latest changes in the
index of leading economic indicators (LEI).
Related Article
CNN, “Financial Crisis Dominates G-20 Agenda,” Monday, March 30, 2009:
Discussion Question
Business cycles now have the ability to propagate quite quickly across countries. What are the
implications for policymakers of this relatively new scenario?
Answer: The recent financial crisis that originated in the United States in 2007 reinforced the idea that