
CHAPTER 8
PRODUCTIVITY AND GROWTH
In this chapter, you will find:
Learning Outcomes
Chapter Outline with PowerPoint Script
Chapter Summary
Teaching Points (as on Prep Card)
Solutions to Problems Appendix
Experiential Assignments
INTRODUCTION
This chapter introduces productivity and growth as keys to economic prosperity, using the per-worker
LEARNING OUTCOMES
8-1 Describe how we measure labor productivity, and explain why is it important for a nation’s
standard of living.
If the population is continually increasing, an economy must produce more goods and services simply
8-2 Summarize the history of U.S. labor productivity changes since World War II, and explain why
these changes matter.
Since 1870, U.S. labor productivity growth has averaged 2.1 percent per year. The quality of labor
and capital is much more important than the quantity of these resources. Between World War II and
8-3 Evaluate the evidence that technological change increases the unemployment rate.
Technological change sometimes costs jobs in the short run when workers fail to adjust. Over time,
however, most displaced workers find other jobs, sometimes in new industries created by
competitors. But critics are wary of the government’s ability to pick the winning technologies of

Chapter 8 Productivity and Growth 110
the future.
CHAPTER OUTLINE WITH POWERPOINT SCRIPT
USE POWERPOINT SLIDES 2-6 FOR THE FOLLOWING SECTION
Theory of Productivity and Growth
Growth and the Production Possibilities Frontier
• Outward shift in the PPF caused by:
USE POWERPOINT SLIDES 7-9 FOR THE FOLLOWING SECTION
What Is Productivity? Ratio of total output to a specific measure of input.
Labor Productivity: Output per unit of labor, measured as real GDP divided by the hours of labor used to
produce the output
USE POWERPOINT SLIDES 10-14 FOR THE FOLLOWING SECTION
Per-Worker Production Function
• Relationship between the amount of capital per worker and the output per worker.
USE POWERPOINT SLIDES 15-17 FOR THE FOLLOWING SECTION
Productivity and Growth in Practice
• The U.S. produces about 150 times the per capita output of the world’s poorest countries
USE POWERPOINT SLIDES 18-23 FOR THE FOLLOWING SECTION
Education and Economic Development
U.S. Labor Productivity
• Small differences in productivity can make huge differences in the economy’s ability to produce and,
USE POWERPOINT SLIDES 24-25 FOR THE FOLLOWING SECTION
Output per Capita: real GDP divided by population indicates how much an economy produces on
average per resident.

Chapter 8 Productivity and Growth 111
Output per capita increases if:
1) Labor productivity increases for a given worker-population ratio
USE POWERPOINT SLIDES 26-28 FOR THE FOLLOWING SECTION
International Comparisons
• U.S. is at the top of other countries, with a per capita income 20% above second-ranked Canada.
USE POWERPOINT SLIDE 29 FOR THE FOLLOWING SECTION
Does Technological Change Lead to Unemployment?
• Some fear that if technological change reduces the labor needed to produce a given amount of output,
USE POWERPOINT SLIDES 30-31 FOR THE FOLLOWING SECTION
Research and Development
Improvements in technology arise from scientific discovery.
USE POWERPOINT SLIDE 32 FOR THE FOLLOWING SECTION
Industrial Policy: The idea that government, using taxes, subsidies, regulations, and coordination of the
private sector, can help nurture industries and technologies of the future to give domestic industries an
advantage over foreign competitors..
USE POWERPOINT SLIDES 33-35 FOR THE FOLLOWING SECTION
Do Economies Converge?
• Convergence theory: Developing countries can grow faster than advanced ones and should
eventually close the gap.
CHAPTER SUMMARY
If the population is continually increasing, an economy must produce more goods and services simply to
maintain its standard of living, as measured by output per capita. If output grows faster than the
population, the standard of living rises.

Chapter 8 Productivity and Growth 112
The per-worker production function shows the relationship between the amount of capital per worker in
the economy and the output per worker. As capital per worker increases, so does output per worker, but at
a decreasing rate. Technological change and improvements in the rules of the game shift the per-worker
production function upward, so more is produced for each ratio of capital per worker.
Among the seven major industrial market economies, the United States has experienced the third highest
growth rate in real GDP per capita over the last thirty years and most recently experienced the highest real
GDP per capita.
TEACHING POINTS
1. This chapter shifts from short-run stabilization concerns to the long-run goals and performance of
the economy. Central to the notion of successful growth is the idea of investment in capital,
2. Some students may be accustomed to thinking that technology replaces labor in the production
process. You should emphasize two important considerations. First, not all technology acts as a
3. It is probably important to mention that a better-educated (more highly skilled) labor force also
requires thrift on the part of society. Society must divert current resources to build educational

Chapter 8 Productivity and Growth 113
4. Students should be led through the discussion of the per-worker production function. The effects
on output per capita of both changes in the size of the labor force and the growth rate of productivity
5. In discussing the theory of convergence, it is important to emphasize the factors that may keep a
developing economy from converging with an industrial economy. Those factors include (1) higher
SOLUTIONS TO PROBLEMS APPENDIX
1. (Measuring Labor Productivity) How do we measure labor productivity? How do changes in
labor productivity affect the U.S. standard of living?
If the population is continually increasing, an economy must produce more goods and
2. (Growth and the PPF) Use the production possibilities frontier (PPF) to demonstrate economic
growth.
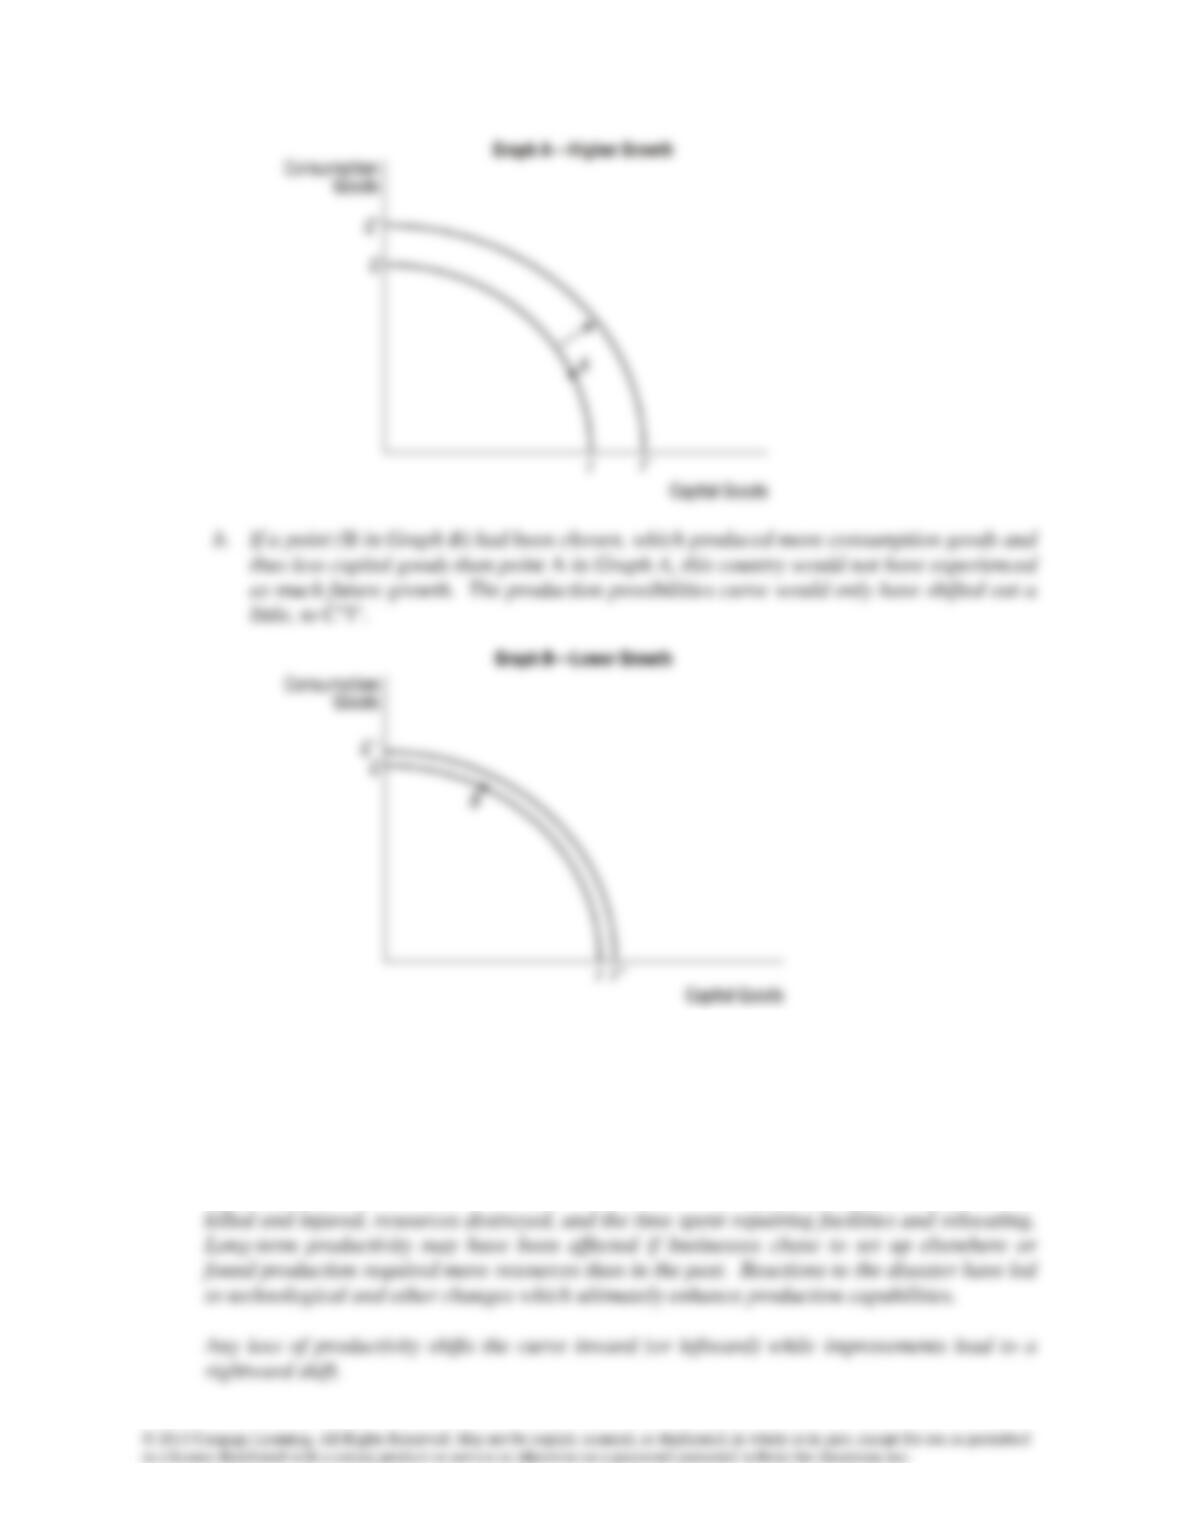
a. With consumption goods on one axis and capital goods on the other, show how the
combination of goods selected this period affects the PPF in the next period.
Chapter 8 Productivity and Growth 114
3. (Shifts in the PPF) Terrorist attacks foster instability and may affect productivity over the
short and long term. Do you think the September 11, 2001, terrorist attacks on the World
Trade Center and the Pentagon affected short- and/or long-term productivity in the United
States? Explain your response and show any movements in the PPF.
The attacks affected short-term productivity because production capabilities for some sectors,
especially financial services in the New York area, were negatively impacted by personnel
Chapter 8 Productivity and Growth 115
4. (Labor Productivity) Identify at least four definable periods of labor productivity growth
beginning right after World War II. During which periods was productivity growth lowest
and why? (Refer to Exhibit 6 in the chapter.)
Between World War II and 1973, labor productivity was strong, averaging 2.8 percent. Labor
productivity growth slowed between 1973 and 1982, in part because of spikes in energy
5. (Long-Term Productivity Growth) Suppose that two nations start out in 2012 with identical
levels of output per work hour—say, $100 per hour. In the first nation, labor productivity grows
by 1 percent per year. In the second, it grows by 2 percent per year. Use a calculator or a
spreadsheet to determine how much output per hour each nation will be producing 20 years
later, assuming that labor productivity growth rates do not change. Then, determine how much
each will be producing per hour 100 years later. What do your results tell you about the effects
of small differences in productivity growth rates?
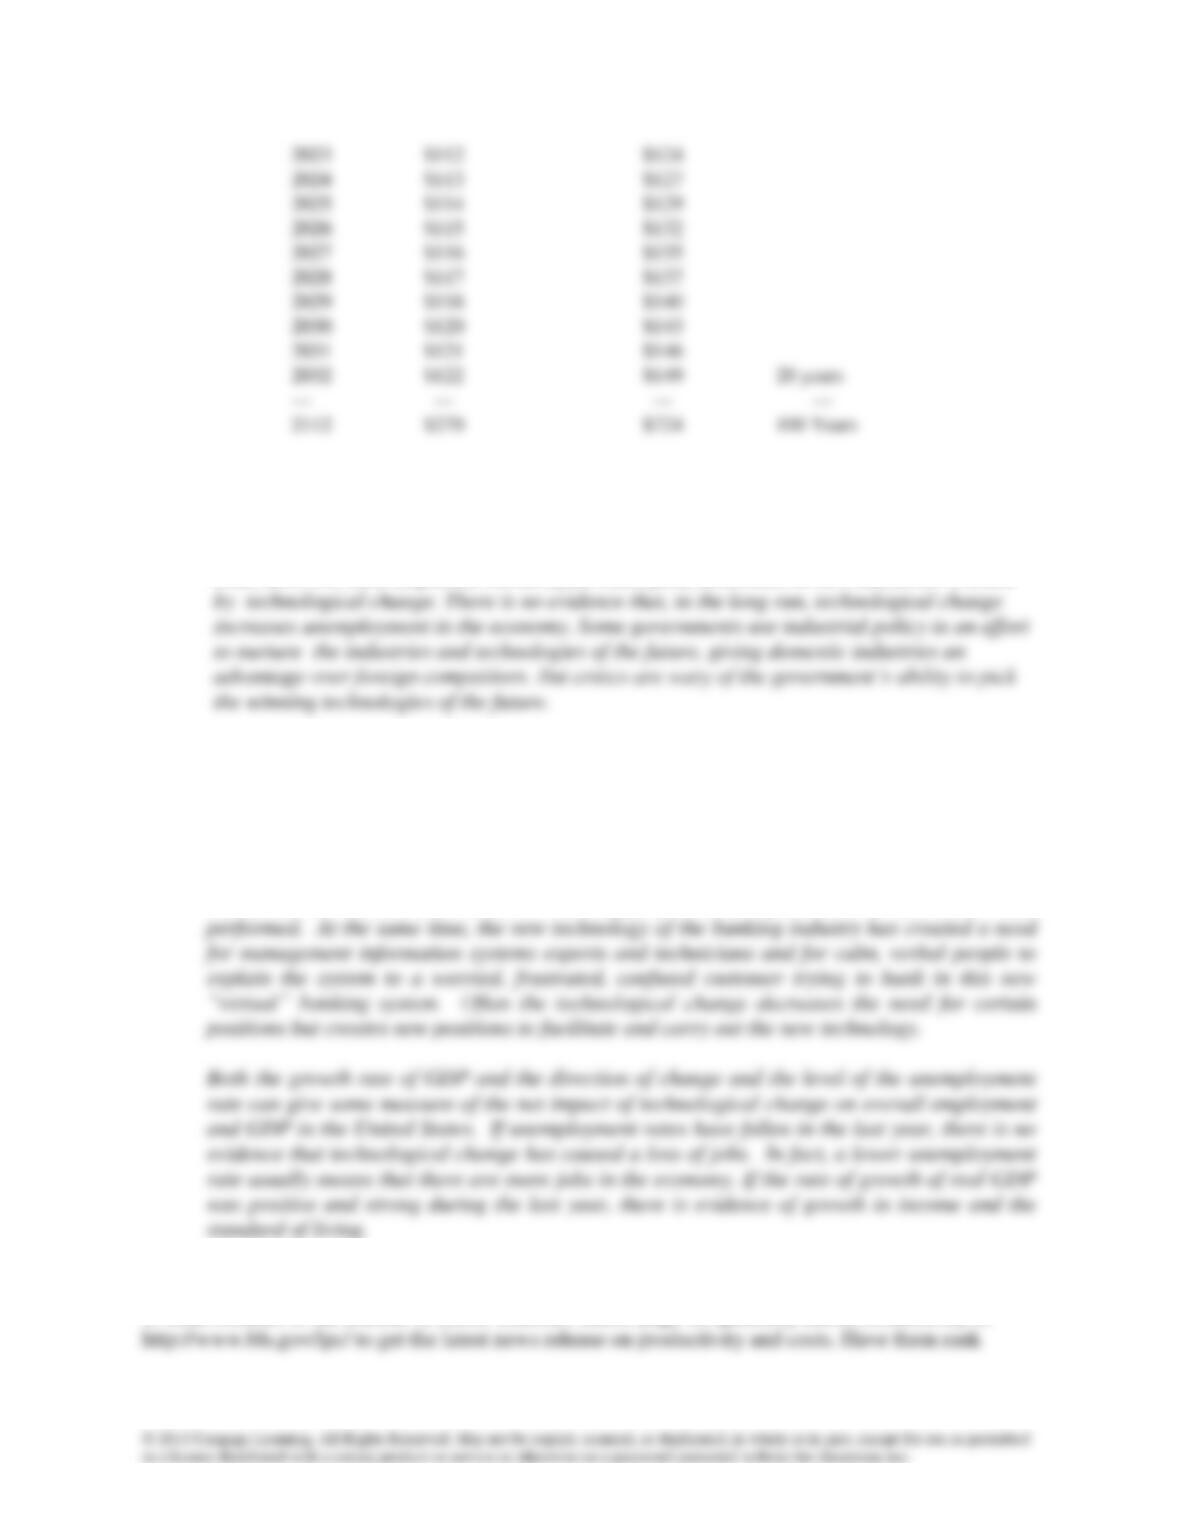
Over long periods, small differences in productivity growth rates have significant impacts on
the economy’s ability to produce and, therefore, on the standard of living. The following table
1% Rate of Growth
2% Rate of Growth
Year
in Output per Worker
in Output per Worker
2012
$100
$100
2013
$101
$102
2014
$102
$104
2015
$103
$106
2016
$104
$108
2017
$105
$110
2018
$106
$113
2019
$107
$115
2020
$108
$117
2021
$109
$120
2022
$110
$122
Chapter 8 Productivity and Growth 116
6. (Technological Change) Does technological change create unemployment? What’s the
evidence?
Technological change sometimes costs jobs in the short run when workers fail to adjust. Over
time, however, most displaced workers find other jobs, sometimes in new industries created
7. (Technological Change and Unemployment) What are some examples, other than those given
in the chapter, of technological change that has caused unemployment? And what are some
examples of new technologies that have created jobs? How do you think you might measure
the net impact of technological change on overall employment and GDP in the United States?
Technological change in the banking industry has reduced the need for bank tellers. ATM
machines, debit cards, and electronic banking perform most of the tasks a bank teller once
Experiential Assignments
1. Send students to the Bureau of Labor Statistics (BLS) page on Quarterly Labor Productivity at

Chapter 8 Productivity and Growth 117
2. The BLS also compiles international data on manufacturing productivity at
3. Technological change is an important driver of economic growth. Ask students to find a story