interactive activity
Chapter 8
Unemployment and
Inflation
1. Each month, usually on the first Friday of the month, the Bureau of Labor
Statistics releases the Employment Situation Summary for the previous month.
Go to www.bls.gov and find the latest report. On the Bureau of Labor Statis-
tics home page, at the top of the page, select the “Economic Releases” tab, find
“Latest Releases,” and select “Employment Situation.” You will find the Employ-
ment Situation Summary listed at the top. How does the current unemployment
rate compare to the rate one month earlier? How does the current unemploy-
ment rate compare to the rate one year earlier?
4.9%, unchanged from June 2016. Since July 2015, the unemployment rate has
fallen by 0.4 percentage points.
2. In general, how do changes in the unemployment rate vary with changes in
real GDP? After several quarters of a severe recession, explain why we might
3. In each of the following situations, what type of unemployment is Melanie
facing?

S-112 Chapter 8 Unemployment and InflatIon
4. Part of the information released in the Employment Situation Summary
concerns how long individuals have been unemployed. Go to www.bls.gov to find
the latest report. Use the same technique as in Problem 1 to find the Employ-
ment Situation Summary. Near the end of the Employment Situation, click on
table A-12, titled “Unemployed persons by duration of unemployment.” Use the
seasonally adjusted numbers to answer the following questions.
a. How many workers were unemployed less than 5 weeks? What percentage of
all unemployed workers do these workers represent? How do these numbers
compare to the previous month’s data?
b. How many workers were unemployed for 27 or more weeks? What percentage
of all unemployed workers do these workers represent? How do these numbers
compare to the previous month’s data?
c. How long has the average worker been unemployed (average duration, in
weeks)? How does this compare to the average for the previous month’s data?
5. A country’s labor force is the sum of the number of employed and unemployed
workers. The accompanying table provides data on the size of the labor force and
the number of unemployed workers for different regions of the United States.
Region
Labor force
(thousands)
Unemployed
(thousands)
July 2015 July 2016 July 2015 July 2016
Northeast 28,397 28,565 1,459 1,377
South 57,297 58,022 2,978 2,720
Midwest 34,489 34,996 1,627 1,585
West 36,949 37,543 2,099 1,985
Data from: Bureau of Labor Statistics.

Chapter 8 Unemployment and InflatIon S-113
a. Calculate the number of workers employed in each of the regions in July 2015
and July 2016. Use your answers to calculate the change in the total number of
workers employed between July 2015 and July 2016.
b. For each region, calculate the growth in the labor force from July 2015 to
July 2016.
c. Compute unemployment rates in the different regions of the country in
July 2015 and July 2016.
d. What can you infer about the fall in unemployment rates over this period?
5. a. The number of employed people equals the size of the labor force minus the
number of unemployed people, as shown in the accompanying table.
Region
Employed
(thousands) Change
(thousands)July 2015 July 2016
Northeast 26,938 27,187 249
b. The accompanying table shows the change in the size of the labor force during
the period July 2015 to July 2016.
Region
Growth in the labor force
(thousands)
Northeast –168
c. The unemployment rate is calculated as (Number of unemployed workers/
labor force) × 100, as shown in the accompanying table.
Region
Unemployment rate
July 2015 July 2016
Northeast 5.1% 4.8%
6. Access the Discovering Data exercise for Chapter 8 Problem 6 online to
answer the following questions.
a. What is the current federal minimum wage?
b. In what year was the federal minimum wage last increased?
c. What is the current value for the real minimum wage?
d. In what year was the real minimum wage the highest? The lowest?
Solution

S-114 Chapter 8 Unemployment and InflatIon
7. In which of the following cases is it more likely for efficiency wages to exist? Why?
8. How will the following changes affect the natural rate of unemployment?
8. a. If the government reduces the time during which an unemployed worker can
9. With its tradition of a job for life for most citizens, Japan once had a much
lower unemployment rate than that of the United States; from 1960 to 1995, the
unemployment rate in Japan exceeded 3% only once. However, since the crash of
Solution
Chapter 8 Unemployment and InflatIon S-115
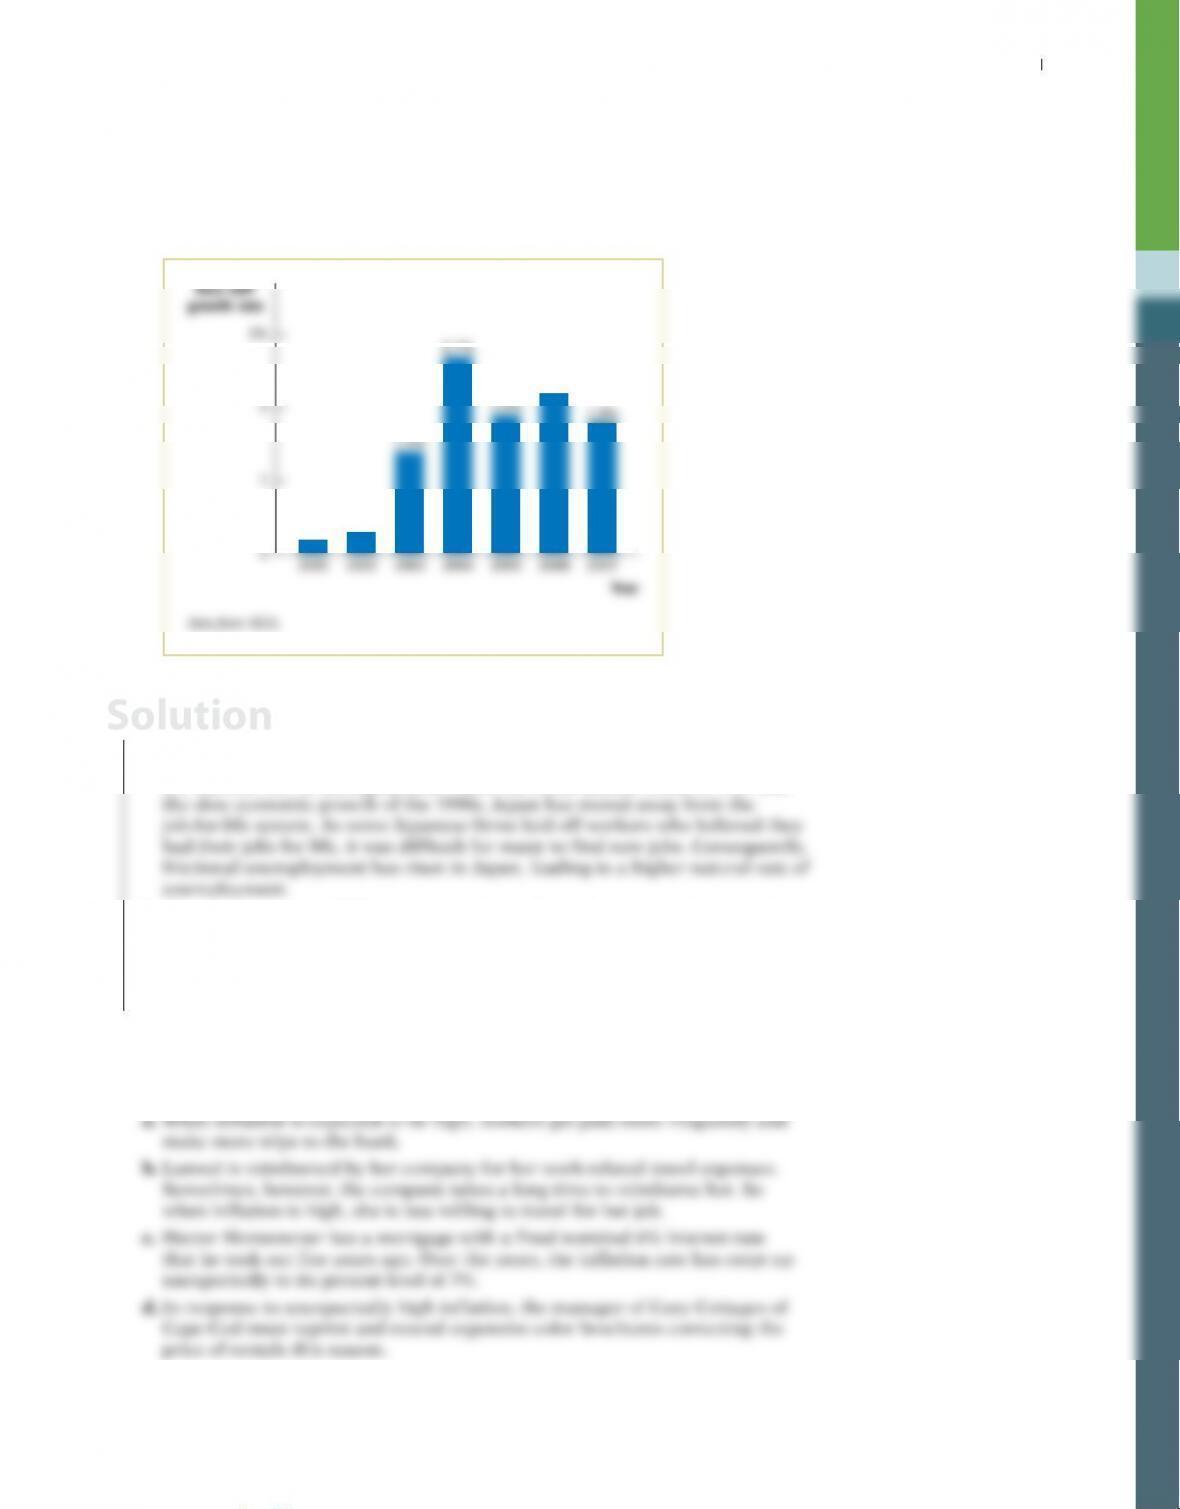
b. As the accompanying diagram shows, the rate of growth of real GDP has
picked up in Japan after 2001 and before the global economic crisis of
2007–2009. Explain the likely effect of this increase in real GDP growth on
the unemployment rate. Is the likely cause of the change in the unemployment
rate during this period a change in the natural rate of unemployment or a
change in the cyclical unemployment rate?
3%
2
1
0
Real GDP
g
rowth rate
0.2% 0.3%
1.4%
2.7%
1.9%
2.2%
1.8%
S-116 Chapter 8 Unemployment and InflatIon
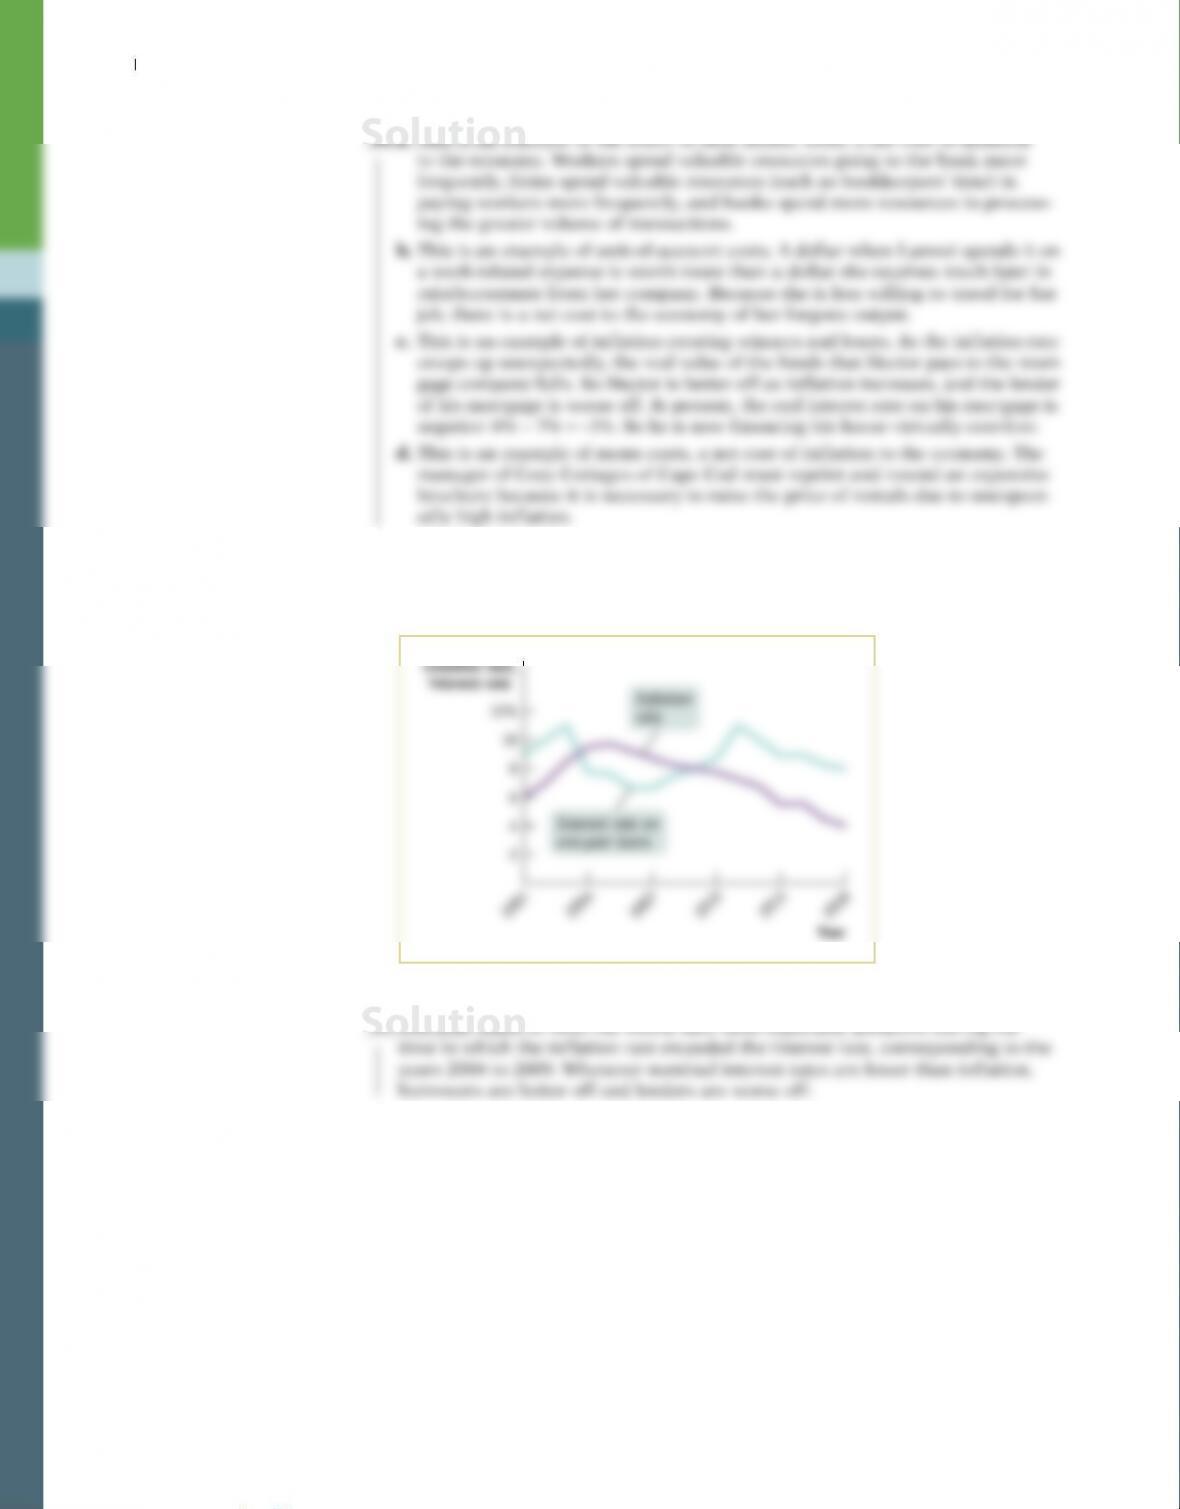
11. The accompanying diagram shows the interest rate on one-year loans and
inflation during 2001–2016 in the economy of Albernia. When would one-year
loans have been especially attractive and why?
Year
Inflation rate,
interest rate
12%
10
8
6
4
2
2013
2016
2001
2004
2007
2010
Interest rate on
one-year loans
Inflation
rate
11. One-year loans in Albernia would have been especially attractive during the
time in which the inflation rate exceeded the interest rate, corresponding to the
years 2004 to 2009. Whenever nominal interest rates are lower than inflation,
borrowers are better off and lenders are worse off.
Solution
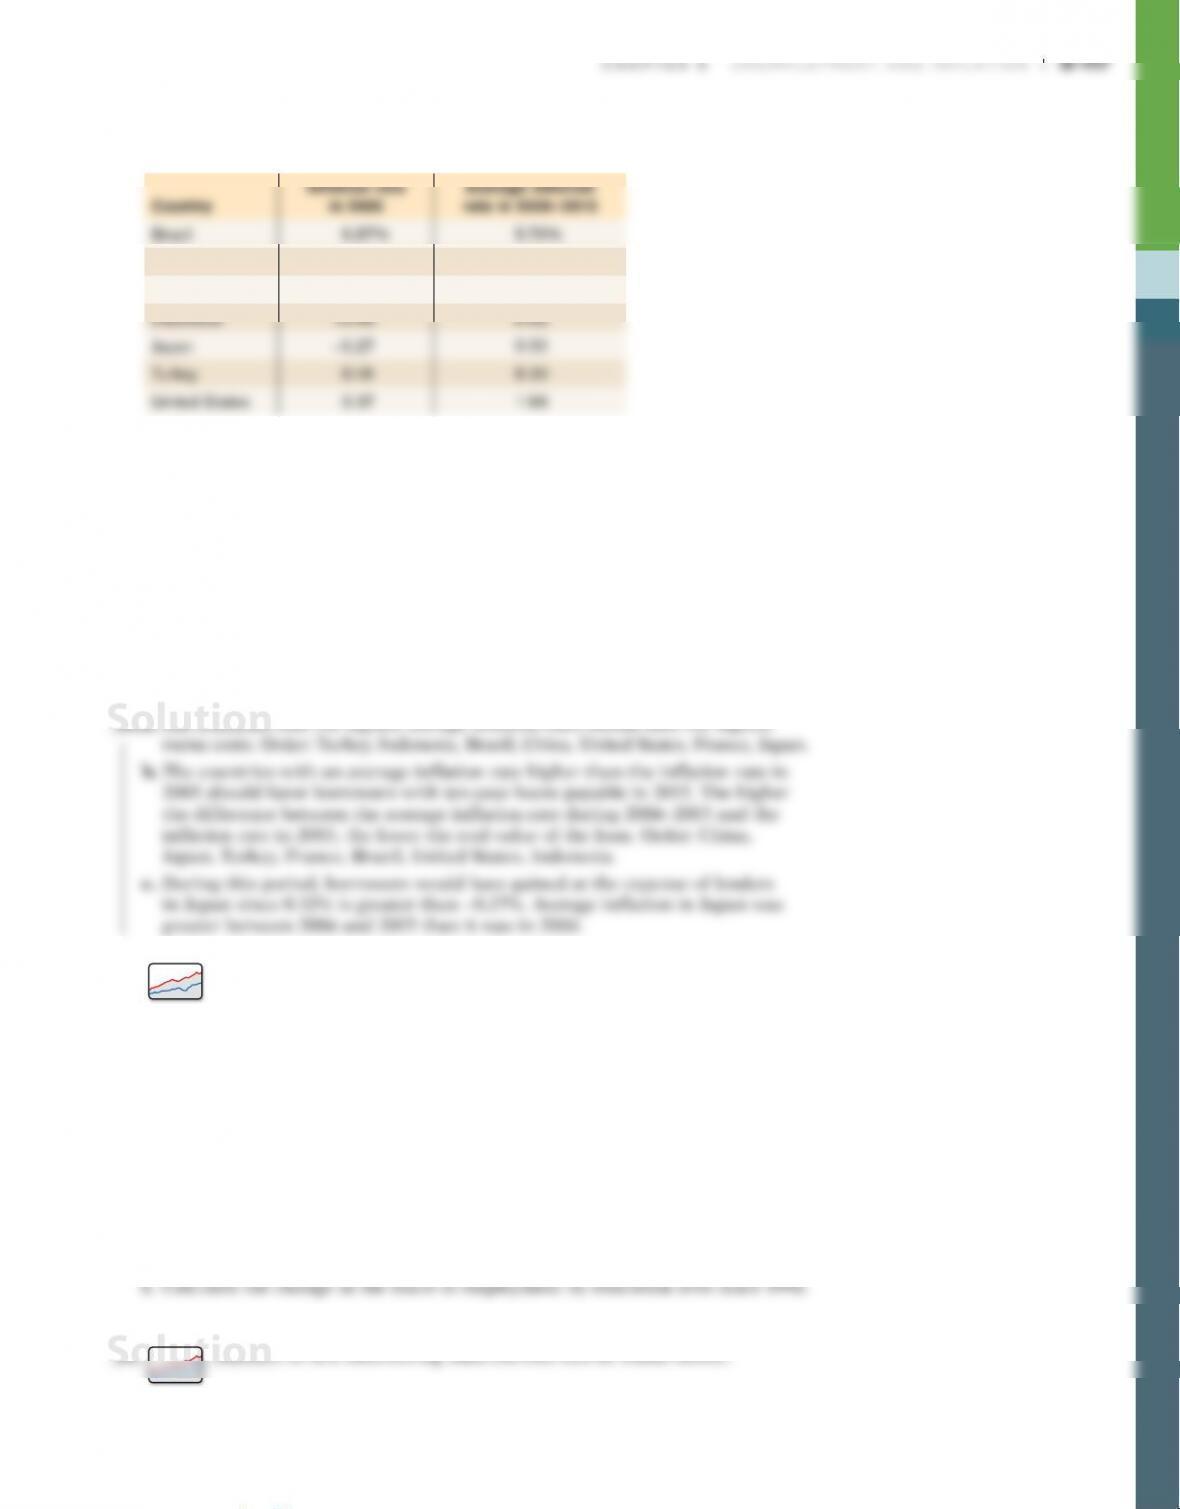
12. The accompanying table provides the inflation rate in the year 2005 and the
average inflation rate over the period 2006–2015 for seven different countries.
Inflation rate
Average inflation
China 1.82 2.89
France 1.90 1.47
Data from: IMF.
a. Given the expected relationship between average inflation and menu costs,
rank the countries in descending order of menu costs using average inflation
over the period 2006–2015.
b. Rank the countries in order of inflation rates that most favored borrowers
with ten-year loans that were taken out in 2005. Assume that the loans were
agreed upon with the expectation that the inflation rate for 2006 to 2015
would be the same as the inflation rate in 2005.
c. Did borrowers who took out ten-year loans in Japan gain or lose overall versus
lenders? Explain.
13. Access the Discovering Data exercise for Chapter 8 Problem 13 online to
answer the following questions.
a. What is the current level of employment for individuals without a high school
diploma?
b. How much has employment changed for high school graduates from 2007
through 2016?
c. Since 2007, which education group has experienced the largest increase in
employment?
d. Since the end of the Great Recession in 2009, how has employment changed
for the different education levels? Calculate the net gain (or loss) of jobs for
each category to answer.
e. What percent of the employed had a bachelor’s degree in January 1992? What
percent has a bachelor’s degree today?
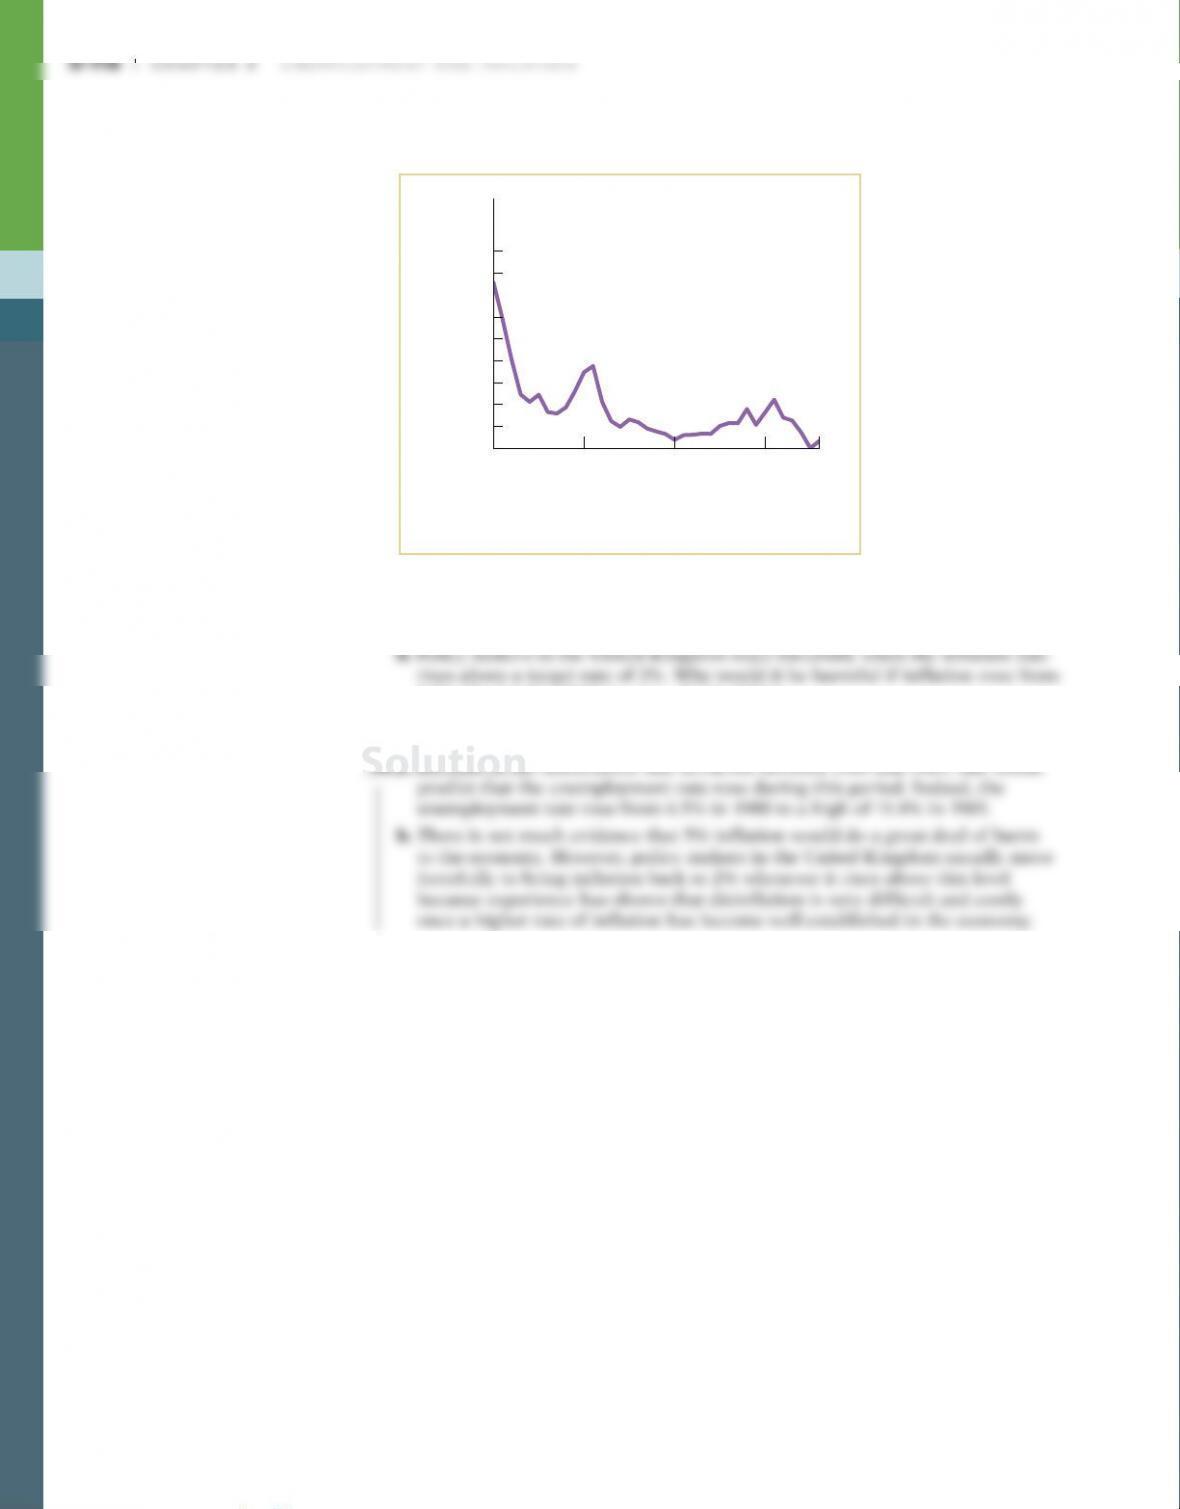
14. The accompanying diagram shows the inflation rate in the United Kingdom
from 1980 to 2016.
Inflation
rate
Year
1980 1990
2016
2000
2
2010
8
12
18%
4
6
10
14
16
Data from: Bank of England.
a. Between 1980 and 1985, policy makers in the United Kingdom worked to
lower the inflation rate. What would you predict happened to unemployment
between 1980 and 1985?
0.7% (the level in 2016) to, say, a level of 5%?
Chapter 8 Unemployment and InflatIon S-119
Solution
WORK IT OUT Interactive step-by-step help with solving this
problem can be found online.
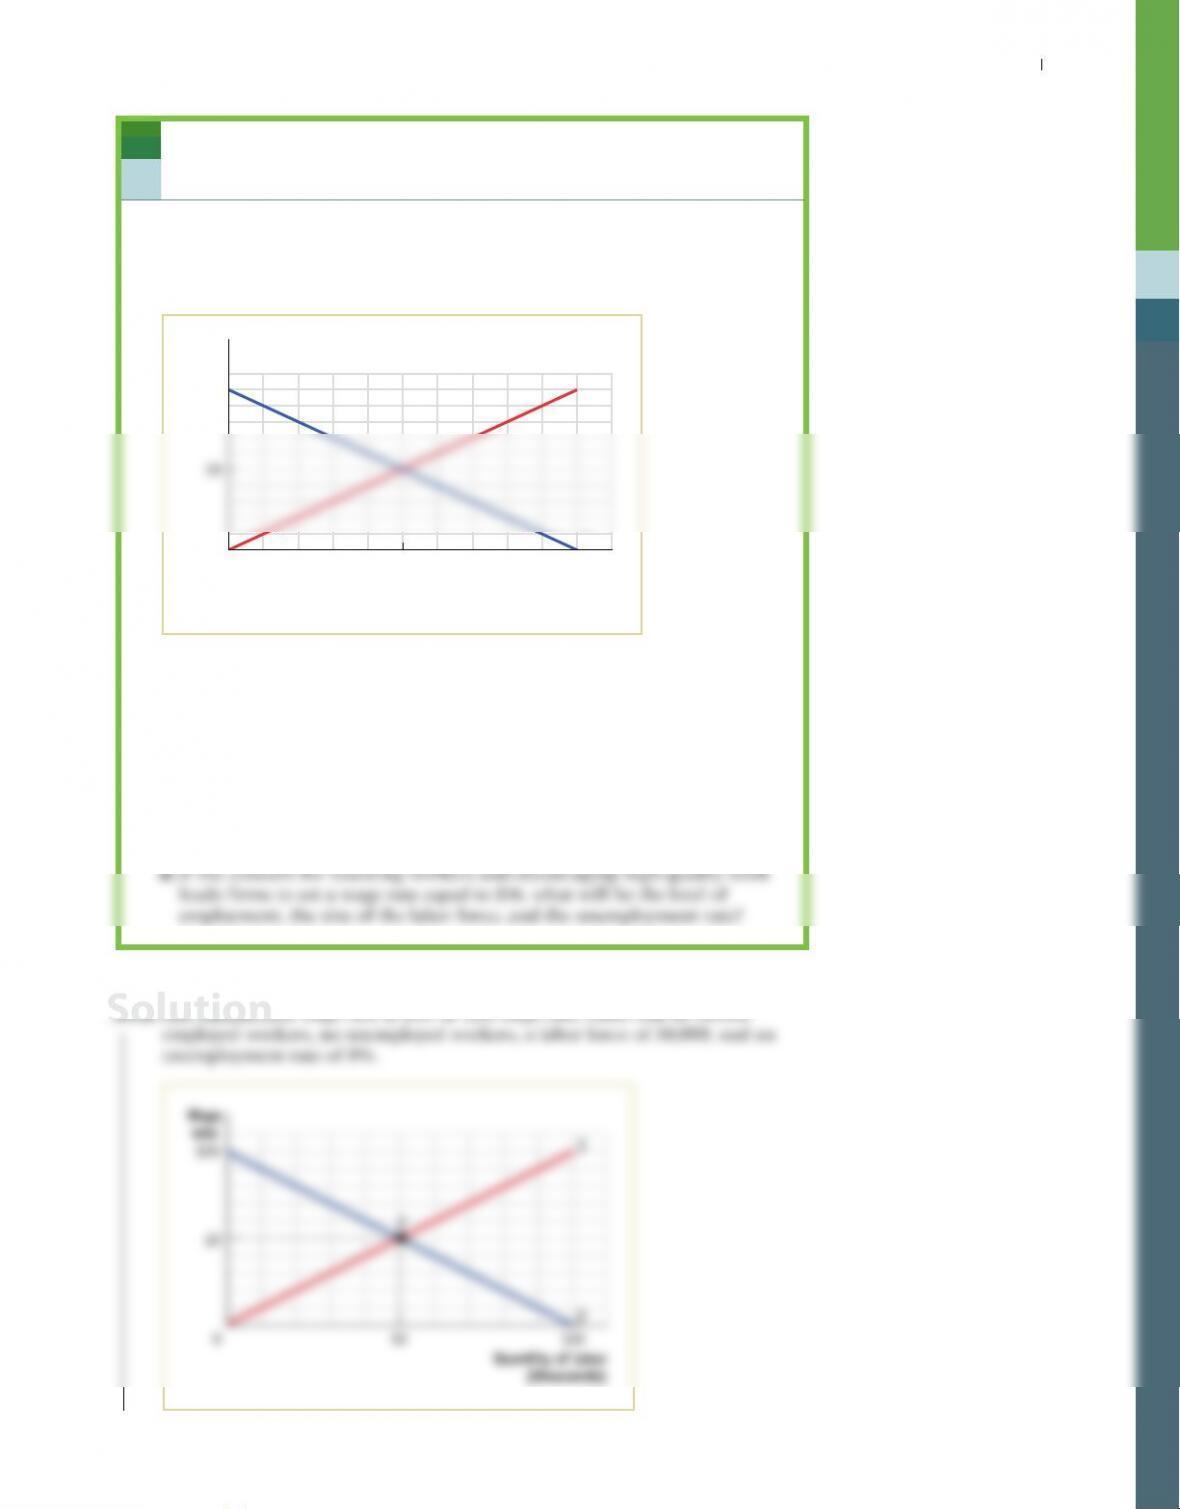
15. There is only one labor market in Profunctia. All workers have the same
skills, and all firms hire workers with these skills. Use the accompanying
diagram, which shows the supply of and demand for labor, to answer the fol-
lowing questions. Illustrate each answer with a diagram.
S
Wage
rate
$20
Quantity of
labor
(thousands)
50 100
D
0
a. What is the equilibrium wage rate in Profunctia? At this wage rate, what
are the level of employment, the size of the labor force, and the unemploy–
ment rate?
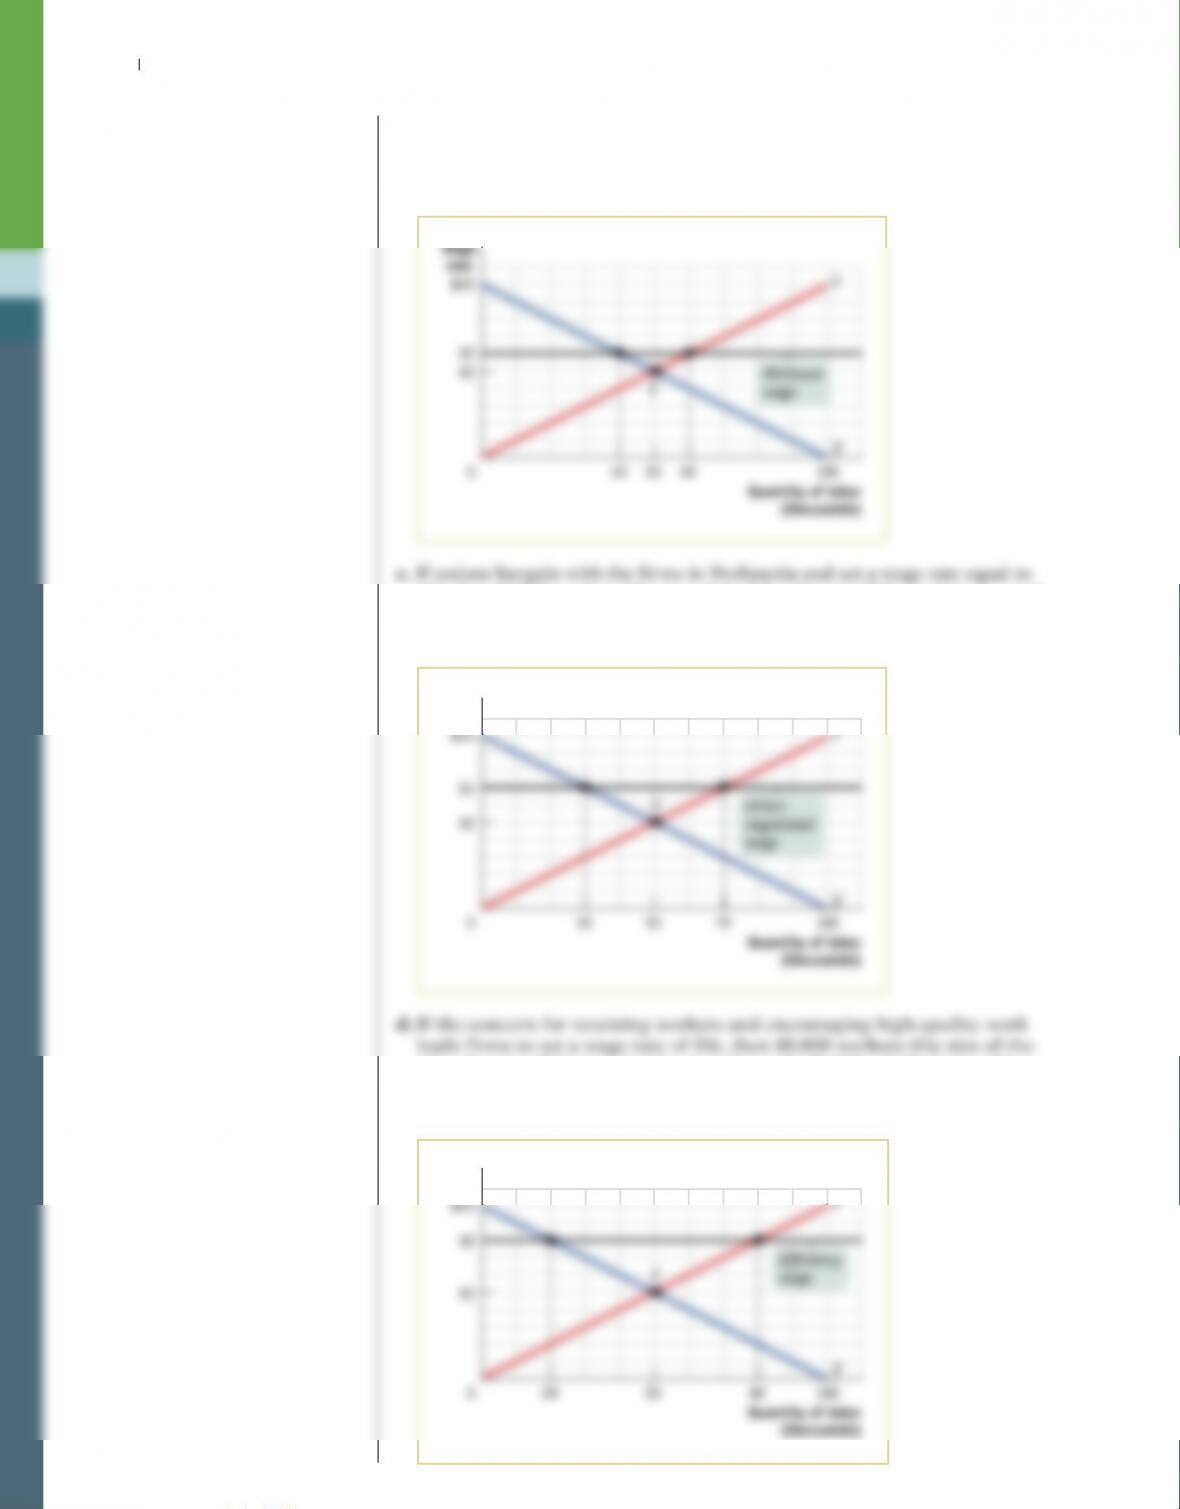
b. If the government of Profunctia sets a minimum wage equal to $12, what
will be the level of employment, the size of the labor force, and the unem–
ployment rate?
c. If unions bargain with the firms in Profunctia and set a wage rate equal
to $14, what will be the level of employment, the size of the labor force,
and the unemployment rate?
15. a. The equilibrium wage rate is $10. At this wage rate, there will be 50,000
50 1000
Quantity of labor
(thousands)
S-120 Chapter 8 Unemployment and InflatIon
b. If the government of Profunctia sets a minimum wage equal to $12, then
60,000 workers (the size of the labor force) will be looking for work but only
40,000 will find jobs. There will be 20,000 unemployed workers, and the
unemployment rate will be 33.3% ((20,000/60,000) × 100).
10
12
$20
Wage
rate
S
E
D
Minimum
wage
$14, then 70,000 workers (the size of the labor force) will be looking for work
but only 30,000 will find jobs. There will be 40,000 unemployed workers, and
the unemployment rate will be 57.1% ((40,000/70,000) × 100).
Wage
rate
labor force) will be looking for work but only 20,000 will find jobs. There
will be 60,000 unemployed workers, and the unemployment rate will be
75% ((60,000/80,000) × 100).
50 1000
Quantity of labor
(thousands)
10
Wage
rate
D
20 80