interactive activity
Chapter 8
International Trade
1. Both Canada and the United States produce lumber and footballs with constant
opportunity costs. The United States can produce either 10 tons of lumber and
no footballs, or 1,000 footballs and no lumber, or any combination in between.
Canada can produce either 8 tons of lumber and no footballs, or 400 footballs
and no lumber, or any combination in between.
a. Draw the U.S. and Canadian production possibility frontiers in two separate
diagrams, with footballs on the horizontal axis and lumber on the vertical axis.
b. In autarky, if the United States wants to consume 500 footballs, how much
lumber can it consume at most? Label this point A in your diagram. Similarly,
if Canada wants to consume 1 ton of lumber, how many footballs can it con-
sume in autarky? Label this point C in your diagram.
c. Which country has the absolute advantage in lumber production?
d. Which country has the comparative advantage in lumber production?
Suppose each country specializes in the good in which it has the comparative
advantage, and there is trade.
e. How many footballs does the United States produce? How much lumber does
Canada produce?
f. Is it possible for the United States to consume 500 footballs and 7 tons of lum–
ber? Label this point B in your diagram. Is it possible for Canada at the same
time to consume 500 footballs and 1 ton of lumber? Label this point D in your
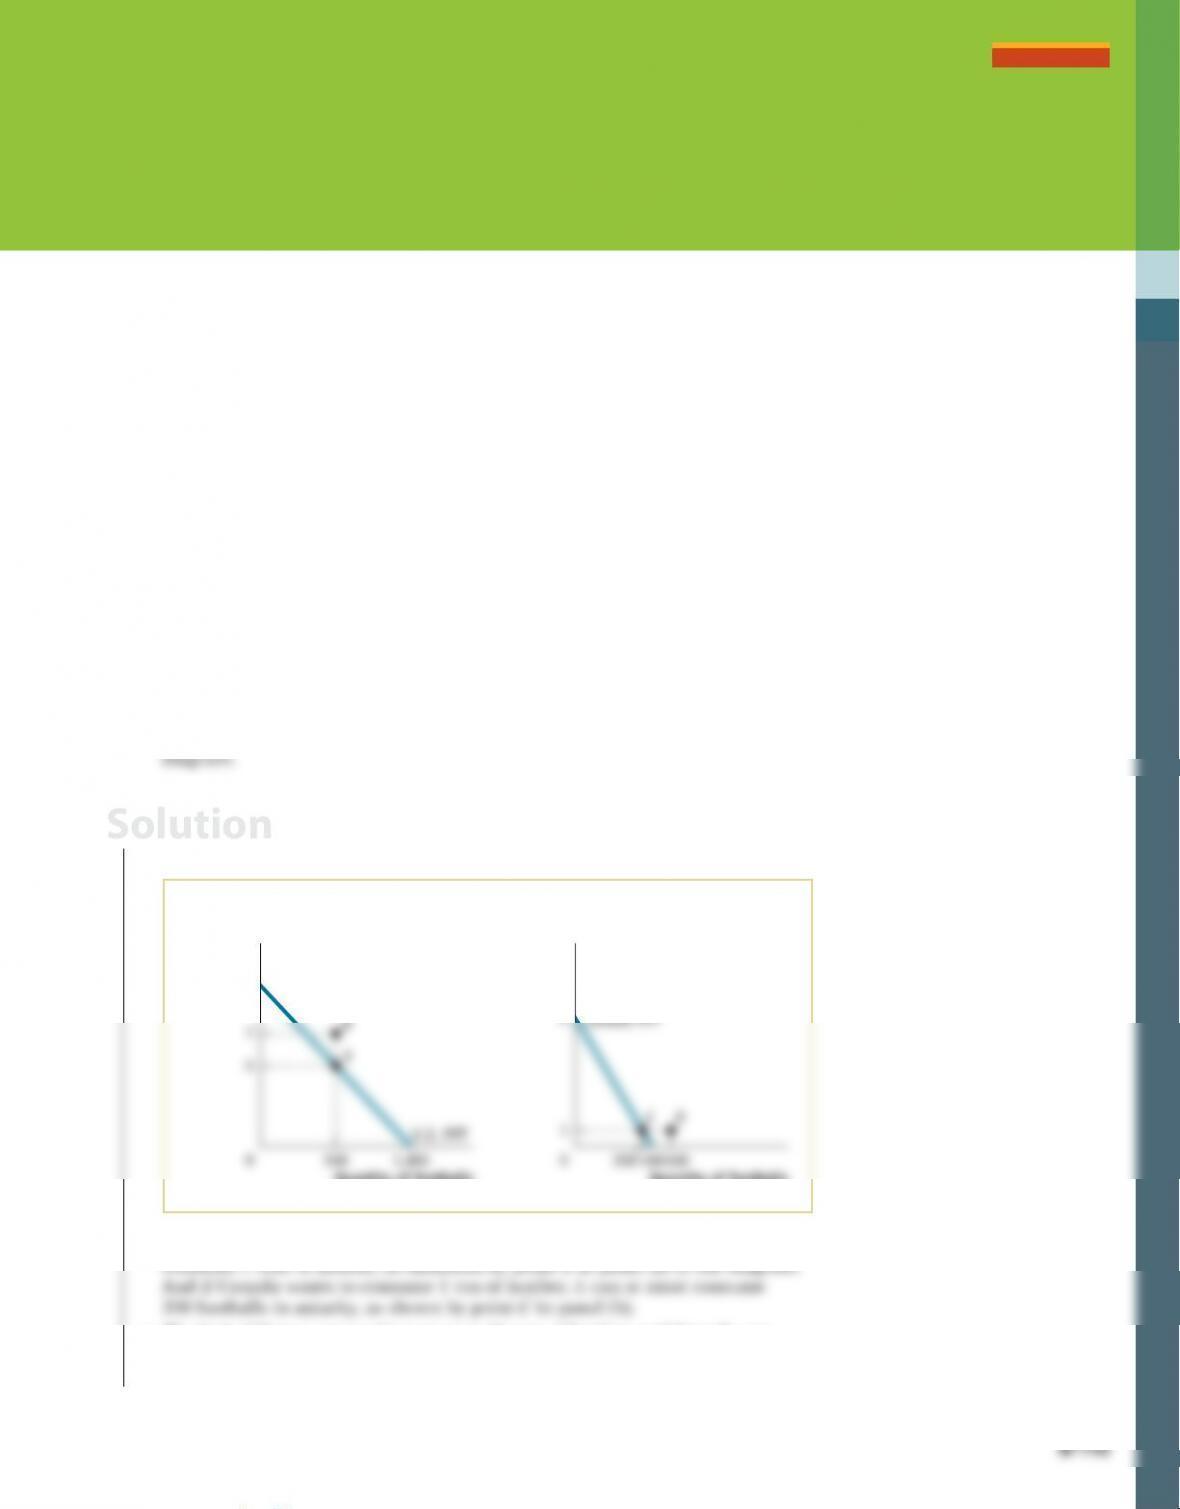
1. a. The two accompanying diagrams illustrate the U.S. and Canadian production
possibility frontiers.
(a) U.S. Production
Possibility Frontier
(b) Canadian Production
Possibility Frontier
10
8
Quantity
of
lumber
(tons)
Quantity of footballs
Quantity
of lumber
(tons)
Quantity of footballs
b. If the United States wants to consume 500 footballs, in autarky it can at most
consume 5 tons of lumber, as indicated by point A in panel (a) of the diagram.
c. The United States can produce at most 10 tons of lumber, and Canada can
produce at most 8 tons. So the United States has the absolute advantage in
lumber production.
Solution
S-116 Chapter 8 InternatIonal trade
d. In the United States, producing 1 additional ton of lumber means forgo–
ing production of 100 footballs: the opportunity cost of 1 ton of lumber
2. For each of the following trade relationships, explain the likely source of the
comparative advantage of each of the exporting countries.
3. According to data from the U.S. Census Bureau, since 2000, the value of U.S.
imports of men’s and boy’s apparel from China has more than tripled from a rel-
atively small $244 million in 2000 to $926 million in 2014. What prediction does
the Heckscher–Ohlin model make about the wages received by labor in China?
4. Shoes are labor-intensive and satellites are capital-intensive to produce. The
United States has abundant capital. China has abundant labor. According to the
Heckscher–Ohlin model, which good will China export? Which good will the
United States export? In the United States, what will happen to the price of labor
(the wage) and to the price of capital?
5. Before the North American Free Trade Agreement (NAFTA) gradually eliminated
import tariffs on goods, the autarky price of tomatoes in Mexico was below the
world price and in the United States was above the world price. Similarly, the
autarky price of poultry in Mexico was above the world price and in the United
States was below the world price. Draw diagrams with domestic supply and
demand curves for each country and each of the two goods. (You will need to
draw four diagrams, total.) As a result of NAFTA, the United States now imports
tomatoes from Mexico and the United States now exports poultry to Mexico.
How would you expect the following groups to be affected?
5. The four accompanying diagrams illustrate the U.S. and Mexican domestic
demand and supply curves.
Price of
tomatoes
Quantity
of tomatoes
(a) U.S. Tomato Imports (b) Mexican Tomato Exports
(c) U.S. Poultry Exports (d) Mexican Poultry Imports
Q1QUS C1
Price of
tomatoes
Quantity
of
tomatoes
A
Domestic
supply
demand
Domestic
demand
Domestic
demand
Imports
Q2
QM
C2
Q4QMC4
Domestic
supply
Domestic
Imports
Q3
QUS
C3
PUS
Exports
Domestic
supply
Domestic
demand
Price of
poultry
Quantity
of poultry
Price of
poultry
Quantity
of
poultry
Exports
Solution
S-118 Chapter 8 InternatIonal trade
a. As shown in panel (b), consumer surplus decreases in Mexico by the size of
area W as the price rises from PM to PW. As shown in panel (a), consumer sur-
plus increases in the United States by the size of the area A + B as the price
falls from PUS to PW.
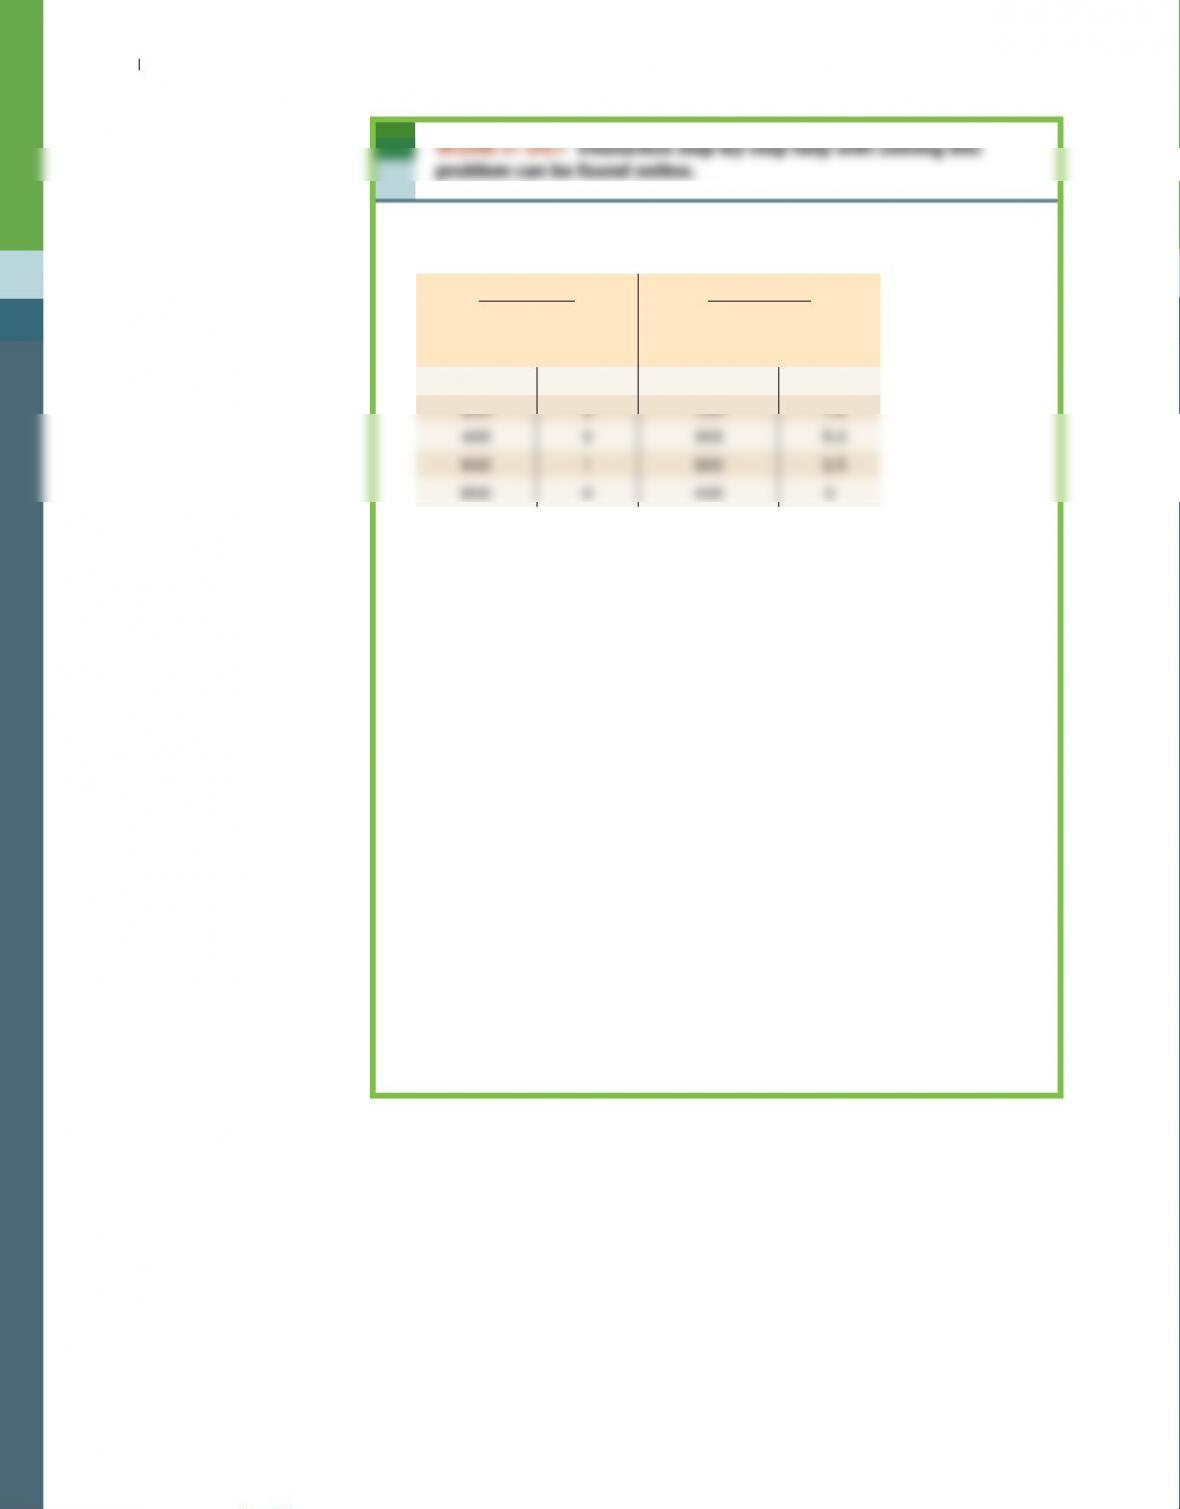
6. The accompanying table indicates the U.S. domestic demand schedule and
domestic supply schedule for commercial jet airplanes. Suppose that the world
price of a commercial jet airplane is $100 million.
Price of jet
(millions)
Quantity of jets
demanded
Quantity of
jets supplied
$120 100 1,000
110 150 900
70 350 500
60 400 400
50 450 300
40 500 200
a. In autarky, how many commercial jet airplanes does the United States
produce, and at what price are they bought and sold?
b. With trade, what will the price for commercial jet airplanes be? Will the
United States import or export airplanes? How many?
6. a. In autarky, the equilibrium price will be $60 million, and 400 airplanes will
Solution
7. The accompanying table shows the U.S. domestic demand schedule and domestic
supply schedule for oranges. Suppose that the world price of oranges is $0.30
per orange.
Price of
orange
Quantity of
oranges demanded
(thousands)
Quantity of
oranges supplied
(thousands)
$1.00 211
0.80 6 9
0.60 10 7
0.40 14 5
0.20 18 3
a. Draw the U.S. domestic supply curve and domestic demand curve.
b. With free trade, how many oranges will the United States import or export?
Suppose that the U.S. government imposes a tariff on oranges of $0.20 per
orange.
c. How many oranges will the United States import or export after introduction
of the tariff?
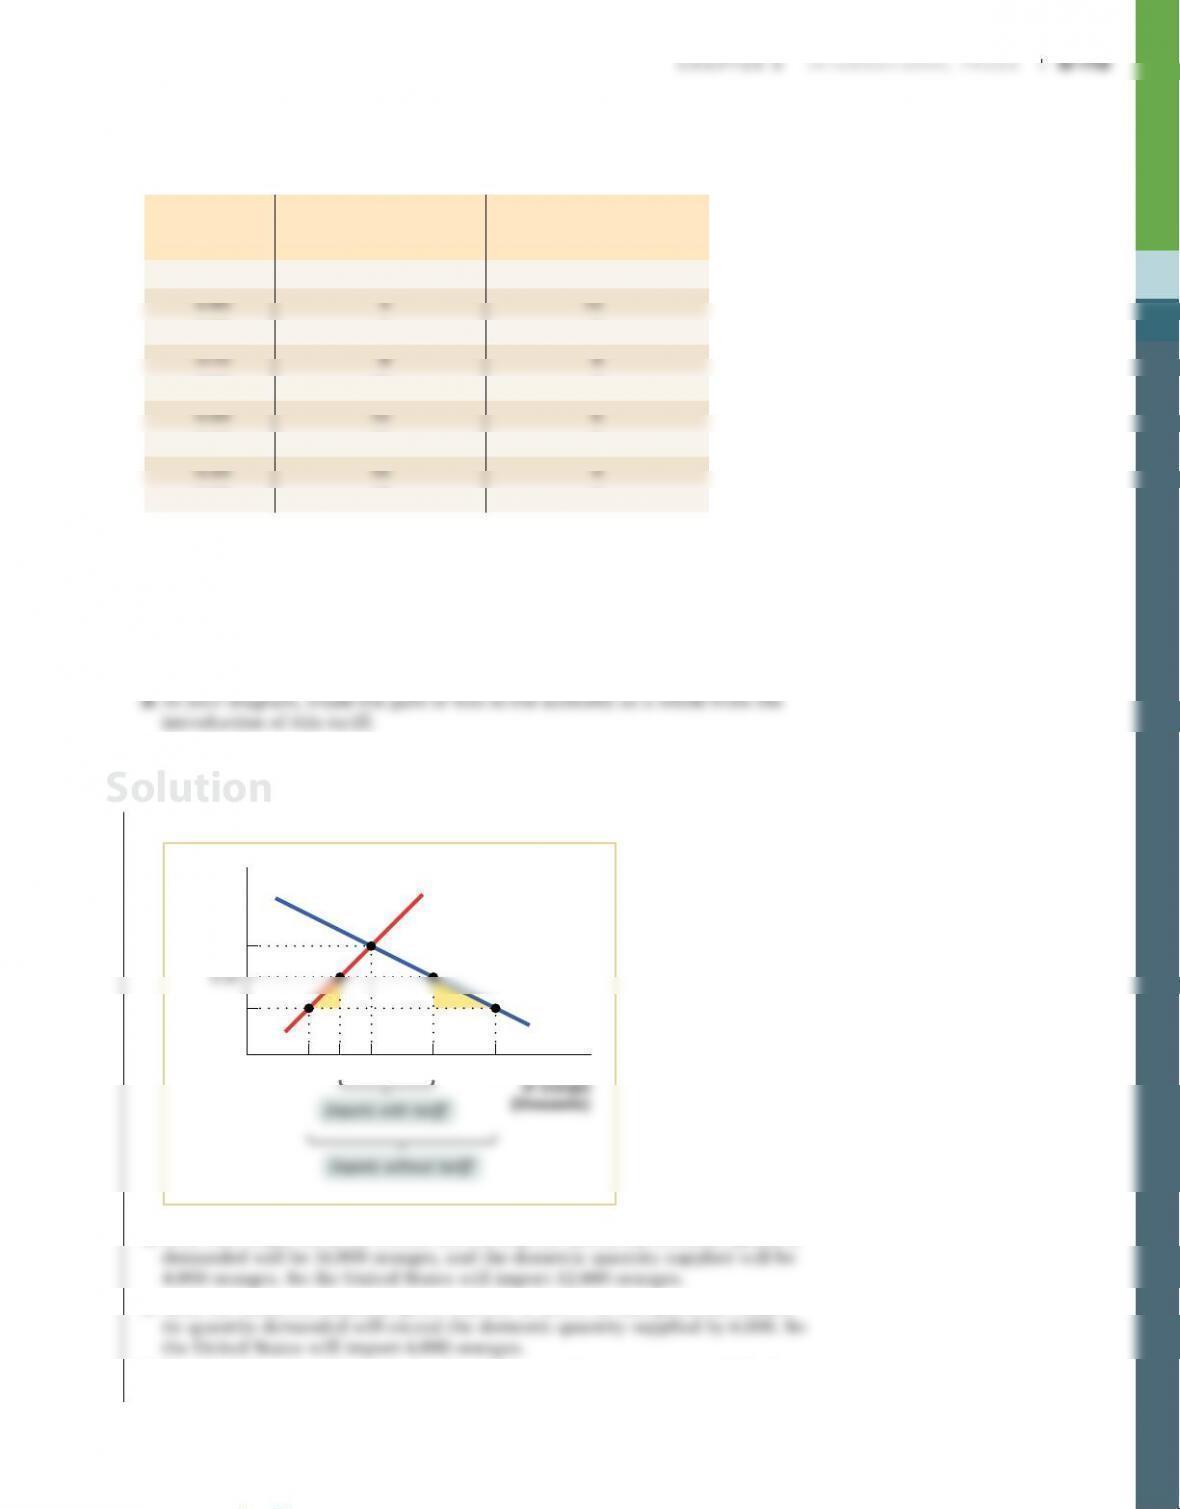
7. a. The U.S. domestic supply and demand curves are illustrated in the accompa-
nying diagram.
161264 8
$0.70
0.30
0
Price of
orange
Quantity
Domestic
supply
Domestic
demand
Imports without tariff
Imports with tariff
b. With free trade, the price will be the world price, $0.30, the domestic quantity
c. With the tariff, the domestic price will rise to $0.50. At that price, the domes–
d. The shaded areas indicate the deadweight loss to the economy as a whole due
to the tariff.
Solution
S-120 Chapter 8 InternatIonal trade
8. The U.S. domestic demand schedule and domestic supply schedule for oranges
was given in Problem 7. Suppose that the world price of oranges is $0.30. The
United States introduces an import quota of 3,000 oranges and assigns the quota
rents to foreign orange exporters.
a. Draw the domestic demand and supply curves.
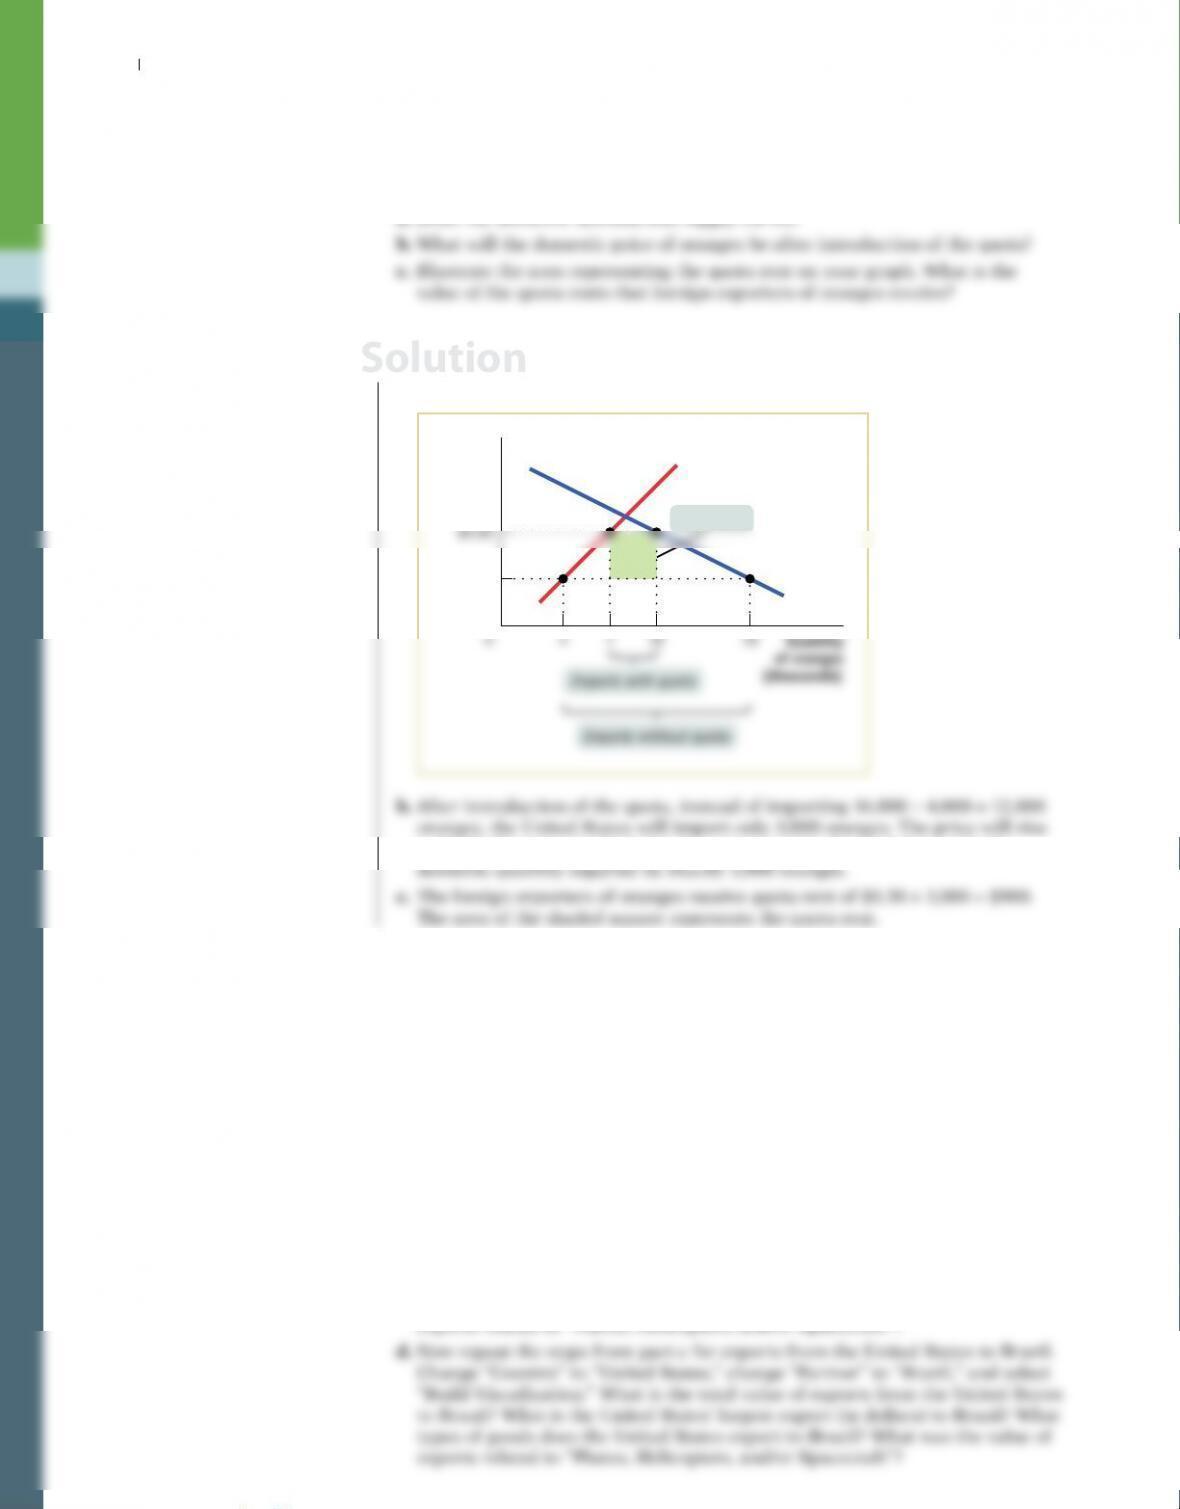
8. a. The domestic demand and domestic supply curves are shown in the accompa-
nying diagram.
$0.60
0.30
Price of
orange
of or
anges
(thousands)
Domestic
supply
Domesti
c
demand
Imports without quota
Imports with quota
Quota rent
to $0.60, the price at which the domestic quantity demanded exceeds the
9. The Observatory of Economic Complexity (OEC) is a data visualization
that models international trade data among countries. Go to the website at
atlas.media.mit.edu to answer the following questions.
a. Start by selecting “Countries” and enter “United States” in the search bar. In
2014, what was the largest exported good (in dollars) for the United States?
What was the value of exports for “Planes, Helicopters, and/or Spacecraft”?
What was the largest imported good for the United States?
b. Repeat the steps above for Brazil. In 2014, what was the largest exported good
for Brazil? What was the value of exports for “Planes, Helicopters, and/or
Spacecraft”? What was the largest imported good for Brazil?
c. On the left sidebar click on the link “Explore on Visualization Page.” On the
new page, in the left sidebar select “Exports,” under “Country” select “Brazil,”
under “Partner” select “United States,” and then “Build Visualization.” What
is the total value of Brazilian exports to the United States? What is Brazil’s
largest exported good (in dollars) compared to the United States? What type of
goods does Brazil generally export to the United States? What is the value of
exports related to “Planes, Helicopters, and/or Spacecraft”?
Solution
9. a. In 2014, “Refined Petroleum” accounted for approximately 7.1% (or
$103 billion) of all U.S. exports, the largest exported good for the United
States. The United States exported $53.2 billion in “Planes, Helicopters, and/
or Spacecraft,” which was approximately 3.7% of all U.S. exports. The largest
or Spacecraft” was the second largest exported item from Brazil to the United
States, making up 7.2% (or $1.98 billion) of all Brazilian exports to the United
States. Embraer, located in Brazil, manufactures a popular small regional jet
used by commercial airlines and private plane owners througout the world.
d. The United States exported $35.1 billion of goods to Brazil in 2014 and
“Refined Petroleum” was the largest exported item at 14% (or $5.05 billion) of
10. Comparative advantage creates an opportunity for less productive economies
like Bangladesh to trade with more productive economies like the United States.
Using the OEC website from Problem 9, how much did Bangladesh export to
the United States? What was its largest export to the United States? In general,
what type of goods did Bangladesh export to the United States?
10. In 2014, Bangladesh exported $5.23 billion to the United States, and 28% of
11. Once again, using the OEC website from Problems 9 and 10, identify which
country has a comparative advantage for each of the following goods. For each
good, include the country’s share of global exports and the total dollar value of
Solution
Solution
S-122 Chapter 8 InternatIonal trade
d. Côte d’Ivoire (The Ivory Coast) was the largest exporter of cocoa beans. There–
12. Over the past five years the United States has become the world’s largest pro–
ducer of natural gas. But gas producers have struggled to find methods to liq-
uefy natural gas so that it can be exported across the Atlantic. Enter Cheniere
Energy, a Houston-based natural gas company that has developed a natural gas
export terminal located on the Sabine Pass leading into the Gulf of Mexico. The
terminal will give U.S. companies access to markets all over the world.
a. Explain how the development of a natural gas export terminal will affect the
market for natural gas in the United States.
d. How will the exporting of natural gas from the United States to Europe affect
consumers and producers in both places?
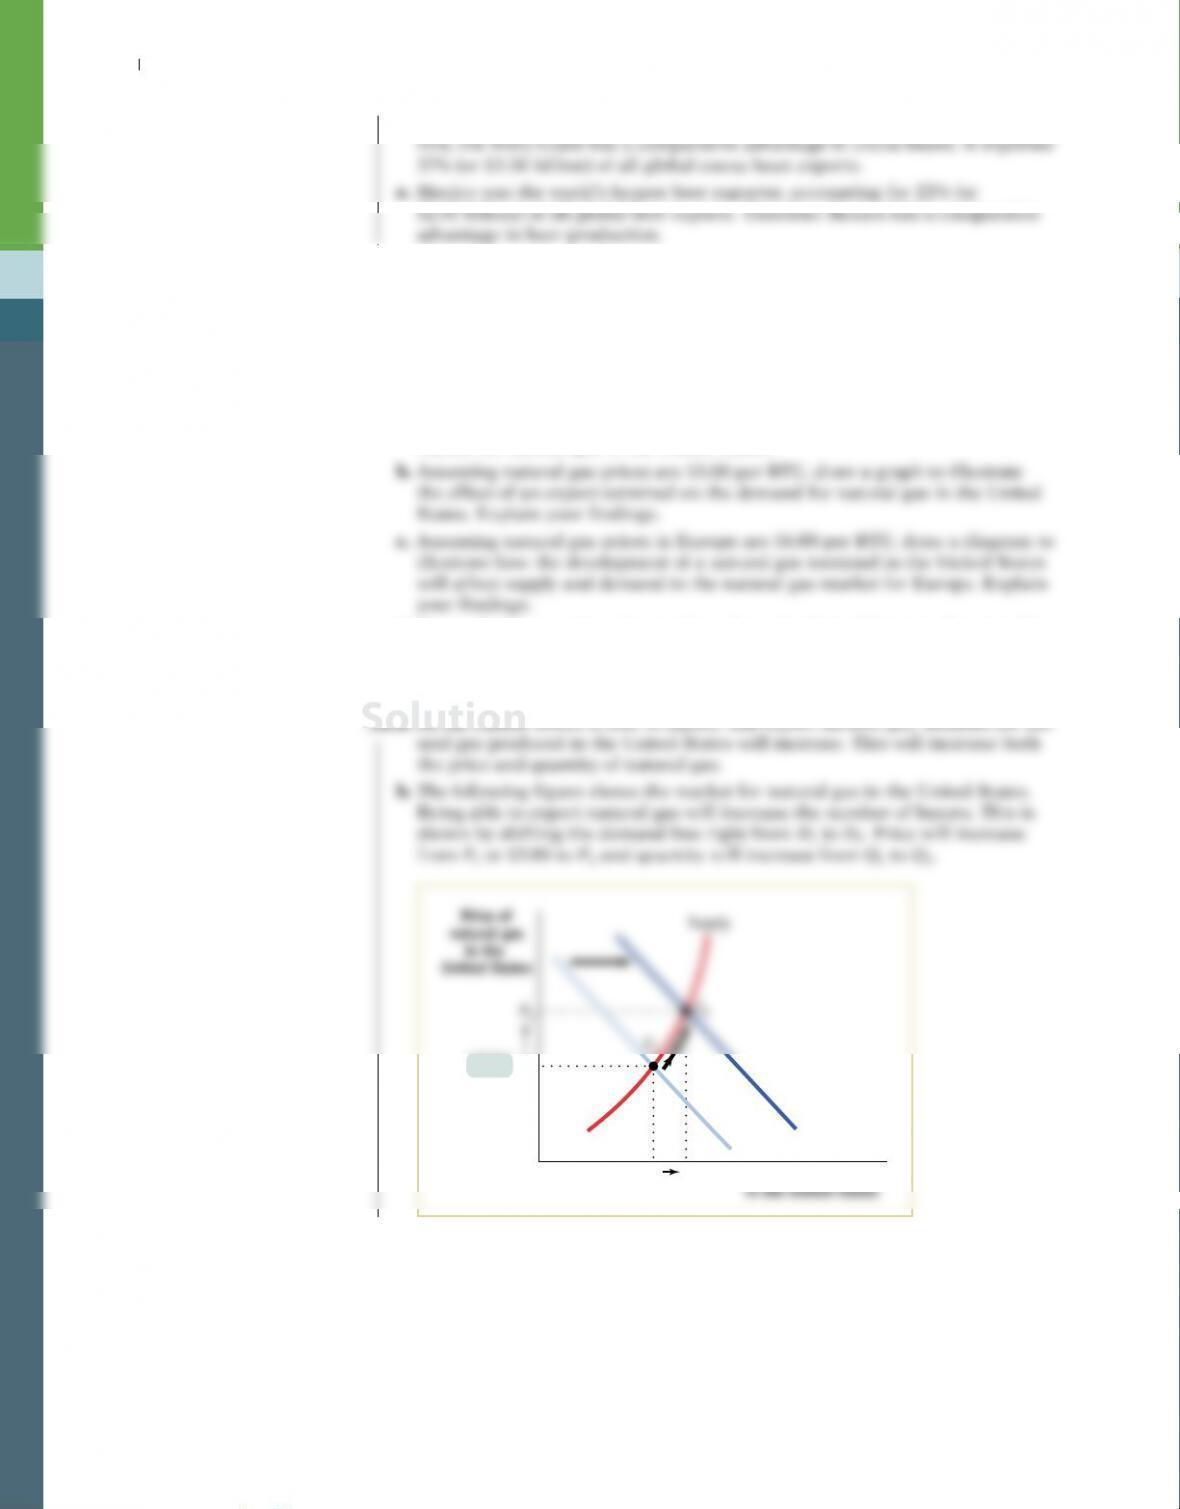
12. a. As the United States is able to liquefy and export natural gas, demand for nat–
Quantity of natural gas
in the United States
Q1Q2
Price of
natural gas
in the
United States
Supply
E1
D1
D2
P1
$3.00
Solution
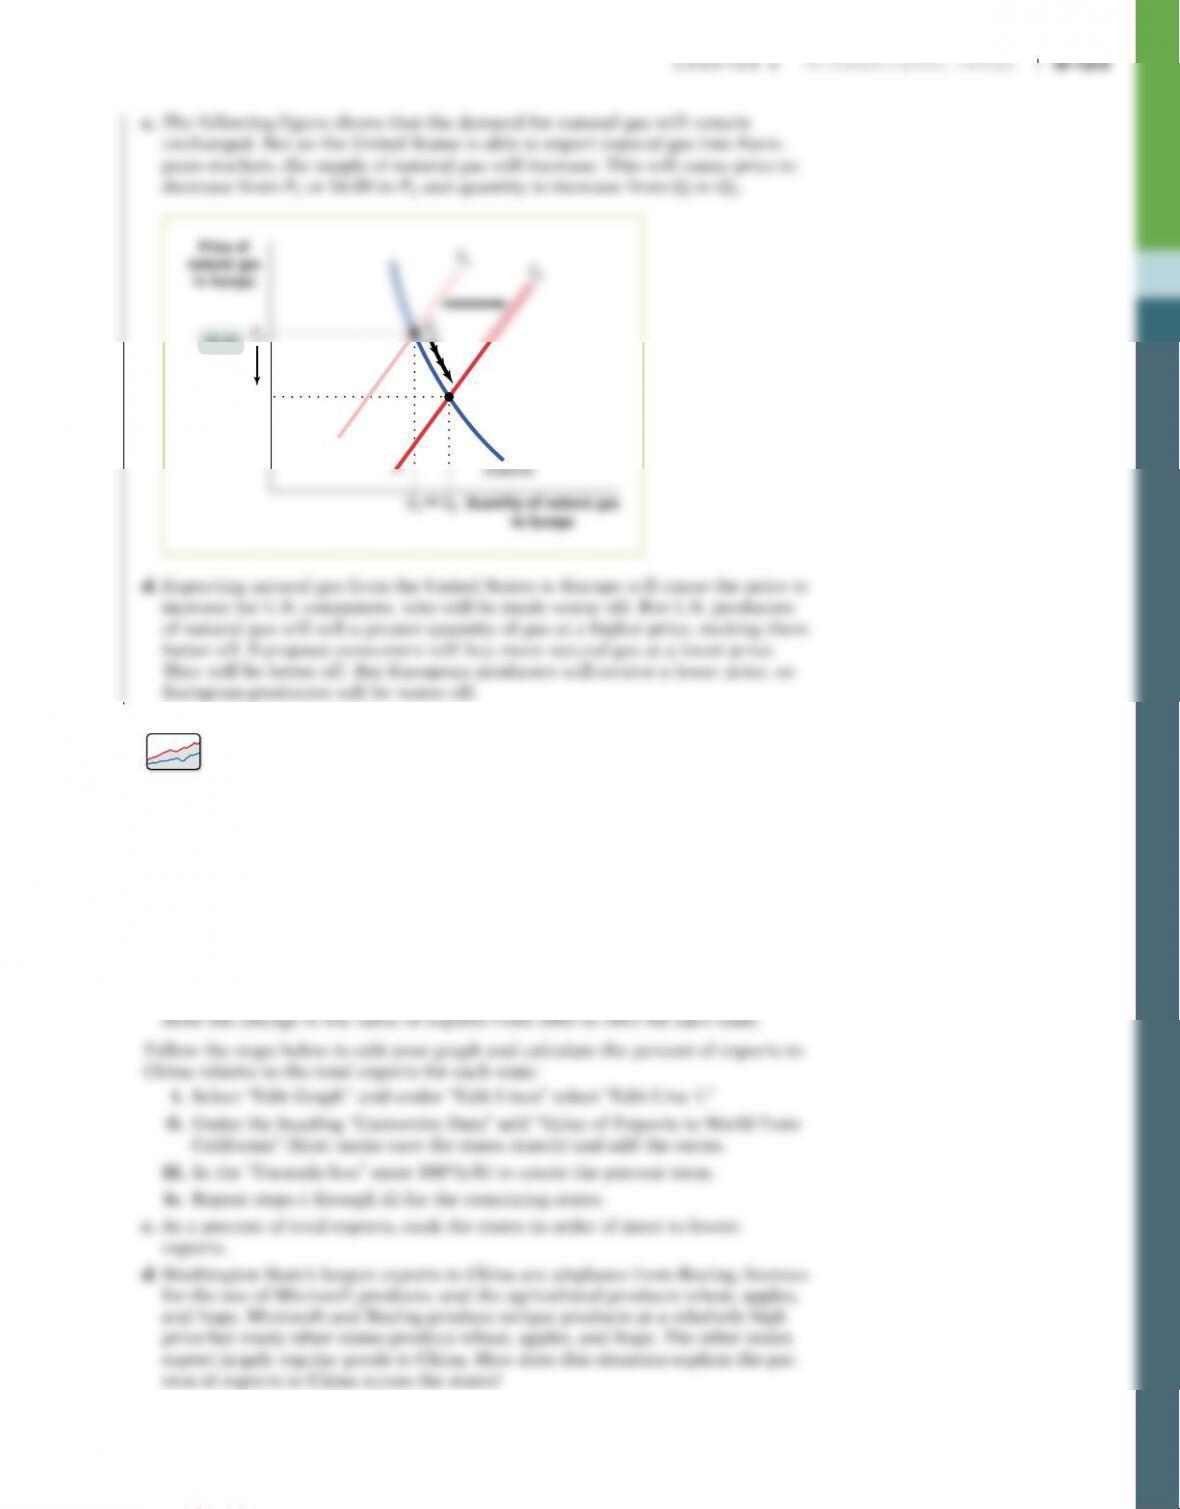
Demand
Quantity of natural gas
in Europe
Q1Q2
E2
P2
$6.00
13. For this Discovering Data exercise, use FRED (fred.stlouisfed.org) to
create a graph comparing exports from California, Florida, Michigan,
Pennsylvania, and Washington to China. In the search bar enter “Value of
exports to China from California” and select the subsequent series. Follow the
steps below to add the remaining states:
i. Select “Edit Graph,” under “Add Line” enter “Value of exports to China
from Florida,” then select “Add data series.”
ii. Repeat step i for Michigan, Pennsylvania, and Washington.
iii. In the date bar start the graph with 2002-01–01.
a. As of 2012, which two states exported the most goods to China? What were the
dollar values of those exports? Which three states exported the least to China?
b. How did exports to China change from 2002 to 2012? Construct a table to
S-124 Chapter 8 InternatIonal trade
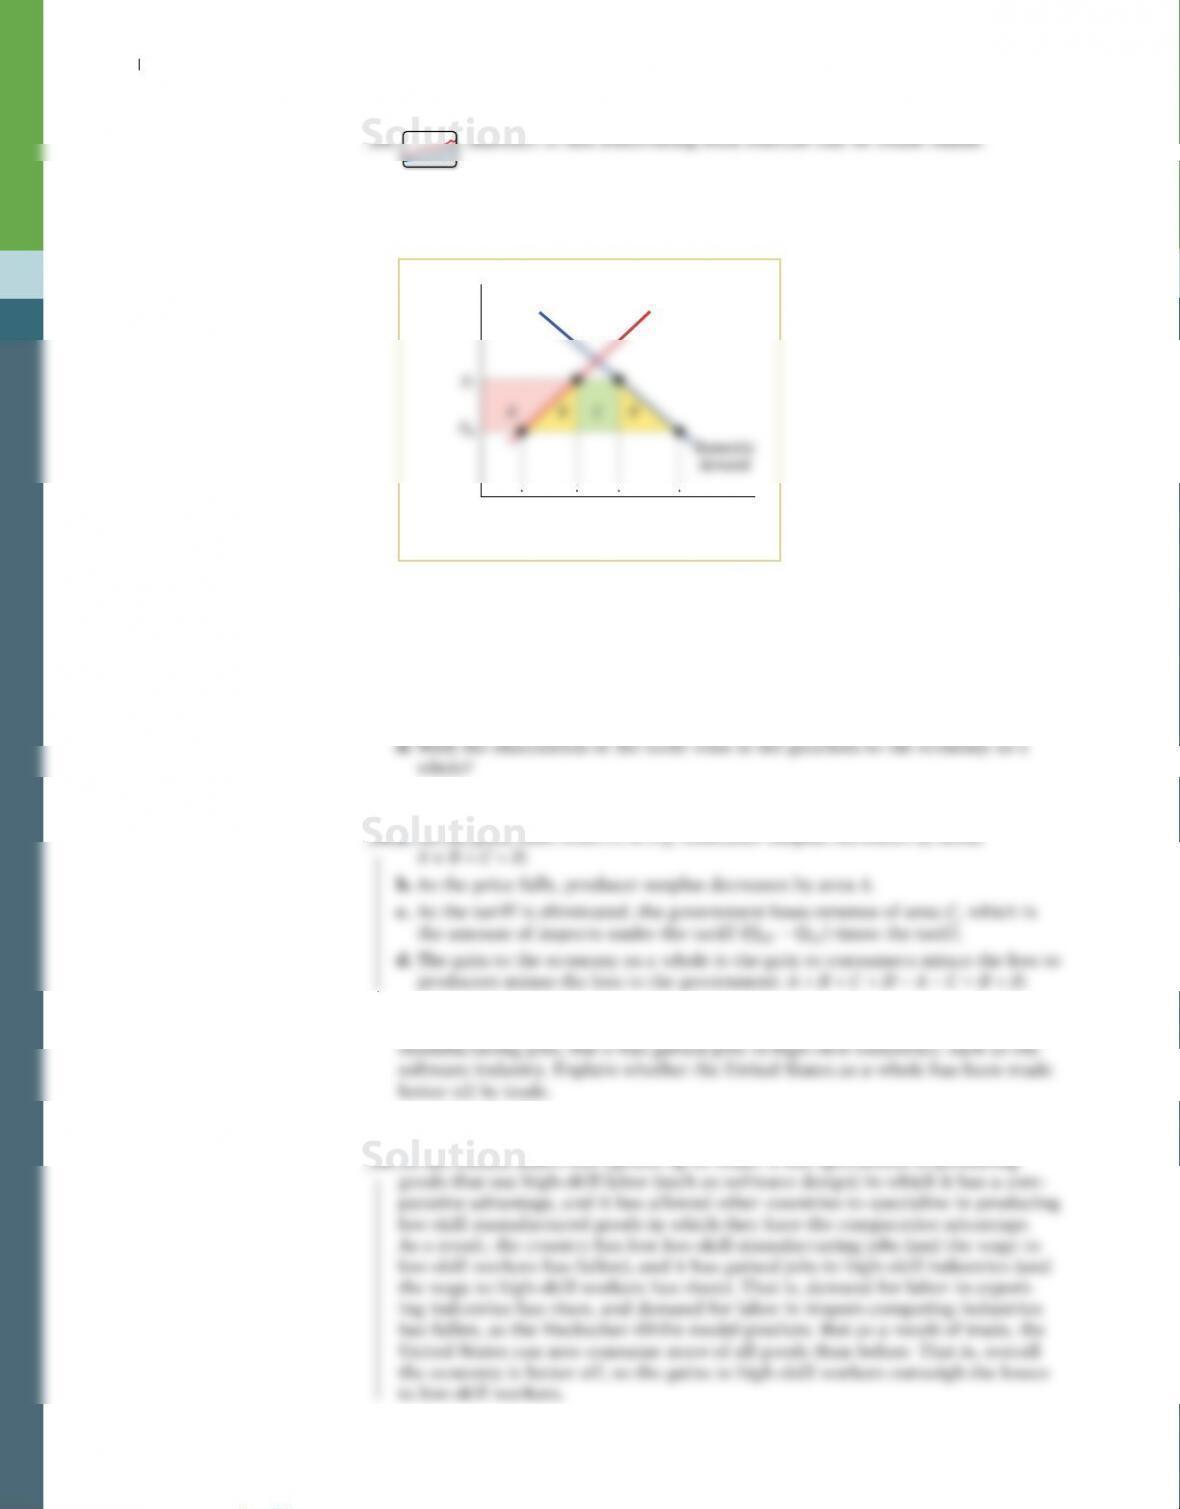
14. The accompanying diagram illustrates the U.S. domestic demand curve and
domestic supply curve for beef.
Domestic
supply
Q QST QDT Q
D
QS
Price of
beef
Quantity of beef
PW
The world price of beef is PW. The United States currently imposes an import tar-
iff on beef, so the price of beef is PT. Congress decides to eliminate the tariff. In
terms of the areas marked in the diagram, answer the following questions.
a. With the elimination of the tariff what is the gain/loss in consumer surplus?
b. With the elimination of the tariff what is the gain/loss in producer surplus?
c. With the elimination of the tariff what is the gain/loss to the government?
15. As the United States has opened up to trade, it has lost many of its low-skill
16. The United States is highly protective of its agricultural (food) industry, imposing
17. In World Trade Organization (WTO) negotiations, if a country agrees to reduce
trade barriers (tariffs or quotas), it usually refers to this as a concession to other
countries. Do you think that this terminology is appropriate?
18. Producers in import-competing industries often make the following argument:
“Other countries have an advantage in production of certain goods purely
because workers abroad are paid lower wages. In fact, American workers are
much more productive than foreign workers. So import-competing industries
need to be protected.” Is this a valid argument? Explain your answer.
18. Even if American workers were better at producing everything than are foreign
Solution
S-126 Chapter 8 InternatIonal trade
19. Assume Saudi Arabia and the United States face the production possibilities
for oil and cars shown in the accompanying table.
Saudi Arabia United States
Quantity of Quantity Quantity of oil Quantity
oil (millions of cars (millions of of cars
of barrels) (millions) barrels) (millions)
0 4 0 10.0
a. What is the opportunity cost of producing a car in Saudi Arabia? In the
United States? What is the opportunity cost of producing a barrel of oil in
Saudi Arabia? In the United States?
b. Which country has the comparative advantage in producing oil? In
producing cars?
c. Suppose that in autarky, Saudi Arabia produces 200 million barrels of
oil and 3 million cars; and suppose that the United States produces
300 million barrels of oil and 2.5 million cars. Without trade, can Saudi
Arabia produce more oil and more cars? Without trade, can the United
States produce more oil and more cars?
Suppose now that each country specializes in the good in which it has the
comparative advantage, and the two countries trade. Also assume that for
each country the value of imports must equal the value of exports.
d. What is the total quantity of oil produced? What is the total quantity of
cars produced?
e. Is it possible for Saudi Arabia to consume 400 million barrels of oil and
5 million cars and for the United States to consume 400 million barrels of
oil and 5 million cars?
f. Suppose that, in fact, Saudi Arabia consumes 300 million barrels of oil
and 4 million cars and the United States consumes 500 million barrels
of oil and 6 million cars. How many barrels of oil does the United States
import? How many cars does the United States export? Suppose a car
costs $10,000 on the world market. How much, then, does a barrel of oil
cost on the world market?
19. a. In Saudi Arabia, 1 million cars can be produced by giving up production of
200 million barrels of oil. So the opportunity cost of 1 car in Saudi Arabia is
200 barrels of oil. The opportunity cost of 2.5 million cars in the United States
b. Since the opportunity cost of producing oil is lower in Saudi Arabia, it has the
comparative advantage in oil production. And since the opportunity cost of
producing cars is lower in the United States, it has the comparative advantage
in car production.
c. In autarky, Saudi Arabia cannot produce both more oil and more cars. If
Saudi Arabia produces 200 million barrels of oil and 3 million cars, it is on its
Solution