Mishkin • Instructor’s Manual for The Economics of Money, Banking, and Financial Markets, Twelfth Edition 109
Chapter 8
ANSWERS TO QUESTIONS
1. For each of the following countries, identify the single most important (largest) and least
important (smallest) source of external funding: United States; Germany; Japan; Canada.
Comment on the similarities and differences among the countries’ funding sources.
For each country, the largest (most important) is listed first, and smallest (least important) is
2. How can economies of scale help explain the existence of financial intermediaries?
Financial intermediaries can take advantage of economies of scale and thus lower
3. Explain why dating can be considered a method to solve the adverse selection problem.
When a couple dates, they are (explicitly or implicitly) extracting information about the
4. Why are financial intermediaries willing to engage in information collection activities when
investors in financial instruments may be unwilling to do so?
Investors in financial instruments who engage in information collection face a free-rider
problem, which means other investors may be able to benefit from their information without
5. Suppose you go to your local bank, intending to buy a certificate of deposit with your
savings. Explain why you would not offer a loan, at an interest rate that is higher than the
rate the bank pays on certificates of deposit (but lower than the rate the bank charges for car
loans), to the next individual who enters the bank and applies for a car loan.
During your visit at the bank, you will probably realize that you will receive an annual
interest rate of 1% or 2% if you buy a certificate of deposit, while an individual asking for a
6. Suppose you are applying for a mortgage loan. The loan officer tells you that if you get the
loan, the bank will keep the house title until you pay back the loan. Which problem of
asymmetric information is the bank trying to solve?
7. Suppose you have data about two groups of countries, one with efficient legal systems and
the other with slow, costly, and inefficient legal systems. Which group of countries would you
expect to exhibit higher living standards?
One would expect the group of countries with more efficient legal systems to exhibit higher
8. Which relationship would you expect to exist between measures of corruption and living
standards at the country level? Explain by which channel corruption might affect living
standards.
One would expect corruption measures to be negatively correlated with living standards.
9. Would you be more willing to lend to a friend if she had put all of her life savings into her
business than you would be if she had not done so? Why?
10. What steps can the government take to reduce asymmetric information problems and help the
financial system function more smoothly and efficiently?
The government can produce information about borrowers and provide it to investors free of
11. How can asymmetric information problems lead to a bank panic?
Even though banks are well suited to overcome the adverse selection and moral hazard
12. In December 2001, Argentina announced it would not honor its sovereign (government-
issued) debt. Many investors were left holding Argentinean bonds priced at a fraction of their
previous value. A few years later, Argentina announced it would pay back 25% of the face
value of its debt. Comment on the effects of information asymmetries on government bond
markets. Do you think investors are currently willing to buy bonds issued by the government
of Argentina?
Information asymmetries are also present in government bond markets. Usually investors
resort to many information sources about the characteristics of particular governments to
13. How does the free-rider problem aggravate adverse selection and moral hazard problems in
financial markets?
The free-rider problem means that private producers of information will not obtain the full
14. Suppose that in a given bond market, there is currently no information that can help potential
bond buyers to distinguish between bonds. Which bond issuers have an incentive to disclose
information about their companies? Explain why.
The issuer of a good quality (low risk) bond would have an incentive to disclose information,
15. How do standardized accounting principles help financial markets work more efficiently?
Standardized accounting principles make profit verification easier, thereby reducing adverse
16. Which problem of asymmetric information are prospective employers trying to solve when
they ask applicants to go through a job interview. Is that the end of the information
asymmetry?
When prospective employers ask job applicants to go through a job interview, they are trying
to solve the adverse selection problem. Prospective employers want to know more about
17. How can the existence of asymmetric information provide a rationale for government
regulation of financial markets?
Because there is asymmetric information and the free-rider problem, not enough information
18. “The more collateral there is backing a loan, the less the lender has to worry about adverse
selection.” Is this statement true, false, or uncertain? Explain your answer.
19. Explain how the separation of ownership and control in American corporations might lead to
poor management.
The separation of ownership and control creates a principal-agent problem. The managers (the
20. Many policymakers in developing countries have proposed the implementation of a system of
deposit insurance similar to the system that exists in the United States. Explain why this
might create more problems than solutions in the financial system of a developing country.
Although it might seem a good idea to “copy and paste” regulatory frameworks that ensure
21. Gustavo is a young doctor who lives in a country with a relatively inefficient legal and
financial system. When Gustavo applied for a mortgage, he found that banks usually
required collateral for up to 300% of the amount of the loan. Explain why banks might
require that much collateral in such a financial system. Comment on the consequences of
such a system for economic growth.
Financial intermediaries operating in countries with relatively weak property rights and legal
systems usually require a lot of collateral when making loans. The rationale for that behavior is
ANSWERS TO APPLIED PROBLEMS
For Problems 22–25, use the fact that the expected value of an event is a probability weighted
average, the sum of each possible outcome multiplied by the probability of the event occurring.
22. You are in the market for a used car and decide to visit a used car dealership. You know that
the Blue Book value of the car you are looking at is between $20,000 and $24,000. If you
believe the dealer knows as much about the car as you do, how much are you willing to pay?
Why? Assume that you care only about the expected value of the car you will buy and that the
car values are symmetrically distributed.
You are willing to pay the average price. If the distribution of car values is symmetric, you

23. Refer to Problem 22. Now you believe the dealer knows more about the car than you do.
How much are you willing to pay? Why? How can this asymmetric information problem be
resolved in a competitive market?
You are willing to pay the average price up front: $22,000. However, the dealer will know
24. You wish to hire Ron to manage your Dallas operations. The profits from the operations
depend partially on how hard Ron works, as follows.
Profit Probabilities
Profit = $10,000 Profit = $50,000
Lazy 60% 40%
Hard worker 20% 80%
If Ron is lazy, he will surf the Internet all day, and he views this as a zero cost opportunity.
However, Ron views working hard as a “personal cost” valued at $1,000. What fixed
percentage of the profits should you offer Ron? Assume Ron cares only about his expected
payment less any “personal cost.”
Let P be the percent of profits you pay Ron. If Ron is lazy, his expected payment is
To induce Ron to work hard, you need
42, 000 1, 000 26, 000
PP

25. You own a house worth $400,000 that is located on a river. If the river floods moderately, the
house will be completely destroyed. Moderate flooding happens about once every 50 years. If
you build a seawall, the river would have to flood heavily to destroy your house, and such
heavy flooding happens only about once every 200 years. What would be the annual
premium for a flood insurance policy that offers full insurance? For a policy that pays only
75% of the home value, what are your expected costs with and without a seawall? Do the
different policies provide an incentive to be safer (i.e., to build the seawall)?
With full insurance:
Without a seawall, the expected loss is
The insurance company will charge the expected loss as a premium. Your expected cost
under either scenario each year is the premium.
With partial insurance:
Without a seawall, the expected loss is
The insurance company will charge the expected loss as a premium. Your expected cost each
year is:
Without a seawall:
Unfortunately, neither insurance policy is better nor worse. Although the premiums under the
Mishkin • Instructor’s Manual for The Economics of Money, Banking, and Financial Markets, Twelfth Edition 117
ANSWERS TO DATA ANALYSIS PROBLEMS
1. Go to the St. Louis Federal Reserve FRED database and find data on the percent of value of
loans secured by collateral for all commercial and industrial loans (ESANQ) and the net
percentage of domestic banks tightening standards for commercial and industrial loans to
large and middle-market firms (DRTSCILM). Download the data into a spreadsheet.
a. Calculate the average, over the most recent four quarters and the four quarters prior to
that, for the bank standards indicator and the “percent of loans secured by collateral”
indicator. Do these averages behave as you would expect?
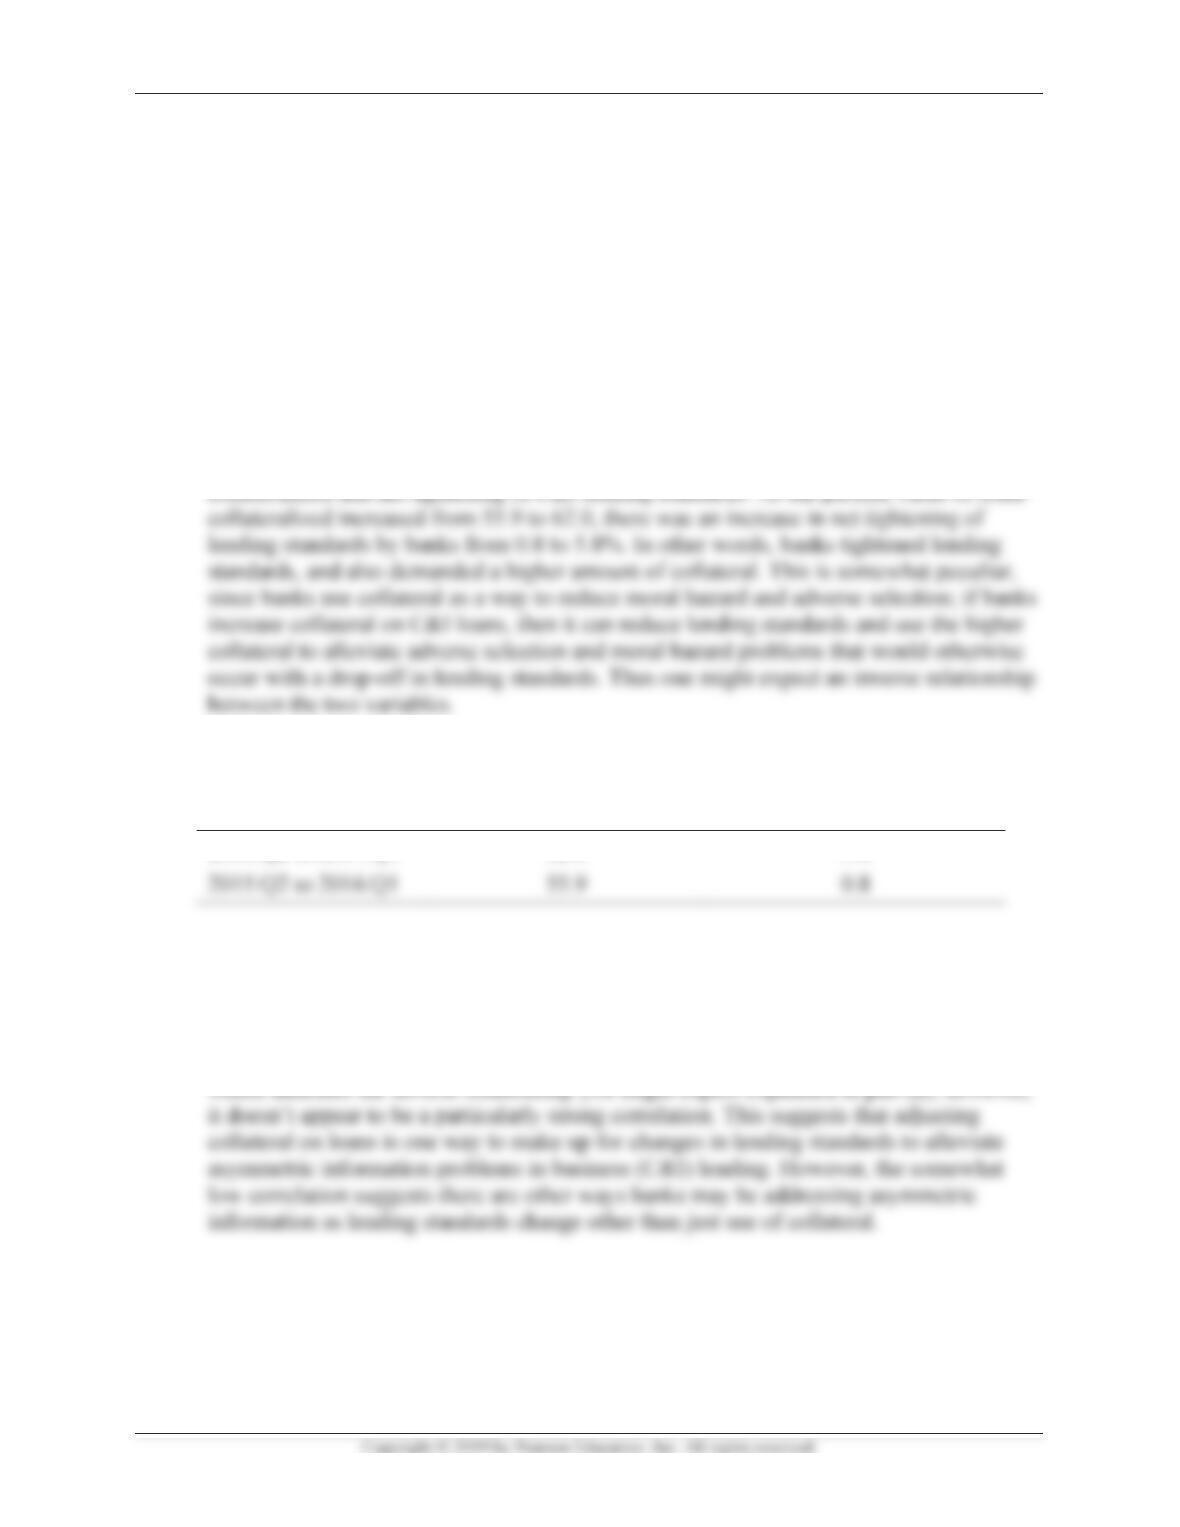
See summary table below for the periods of 2016:Q2 to 2017:Q1 and 2015:Q2 to
2016:Q1. There seems to be an direct relationship between percent value of loans
Percent Value of C&I
Loans Collateralized,
Average
Net Tightening of C&I
Lending Standards,
Average
2016:Q2 to 2017:Q1 62.0 5.8
b. Use the Data Analysis tool in Excel to calculate the correlation coefficient for the two
data series from 1997:Q3 to the most recent quarter of data available. What can you
conclude about the relationship between collateral and bank C&I lending standards? Is
this result consistent with efforts to reduce asymmetric information?
The correlation coefficient between the two indicators from 1997:Q2 to 2017:Q1is –0.24,
2. Go to the St. Louis Federal Reserve FRED database and find data on net worth of
households (TNWBSHNO) and the net percentage of domestic banks tightening standards for
prime mortgage loans (DRTSPM). Adjust the units setting for the net worth indicator to
“Percent Change from Year Ago,” and download the data into a spreadsheet.
a. Calculate the average, over the most recent four quarters and the four quarters prior to
that, for the bank standards indicator and the “percent change in net worth” indicator.
Do these averages behave as you would expect?
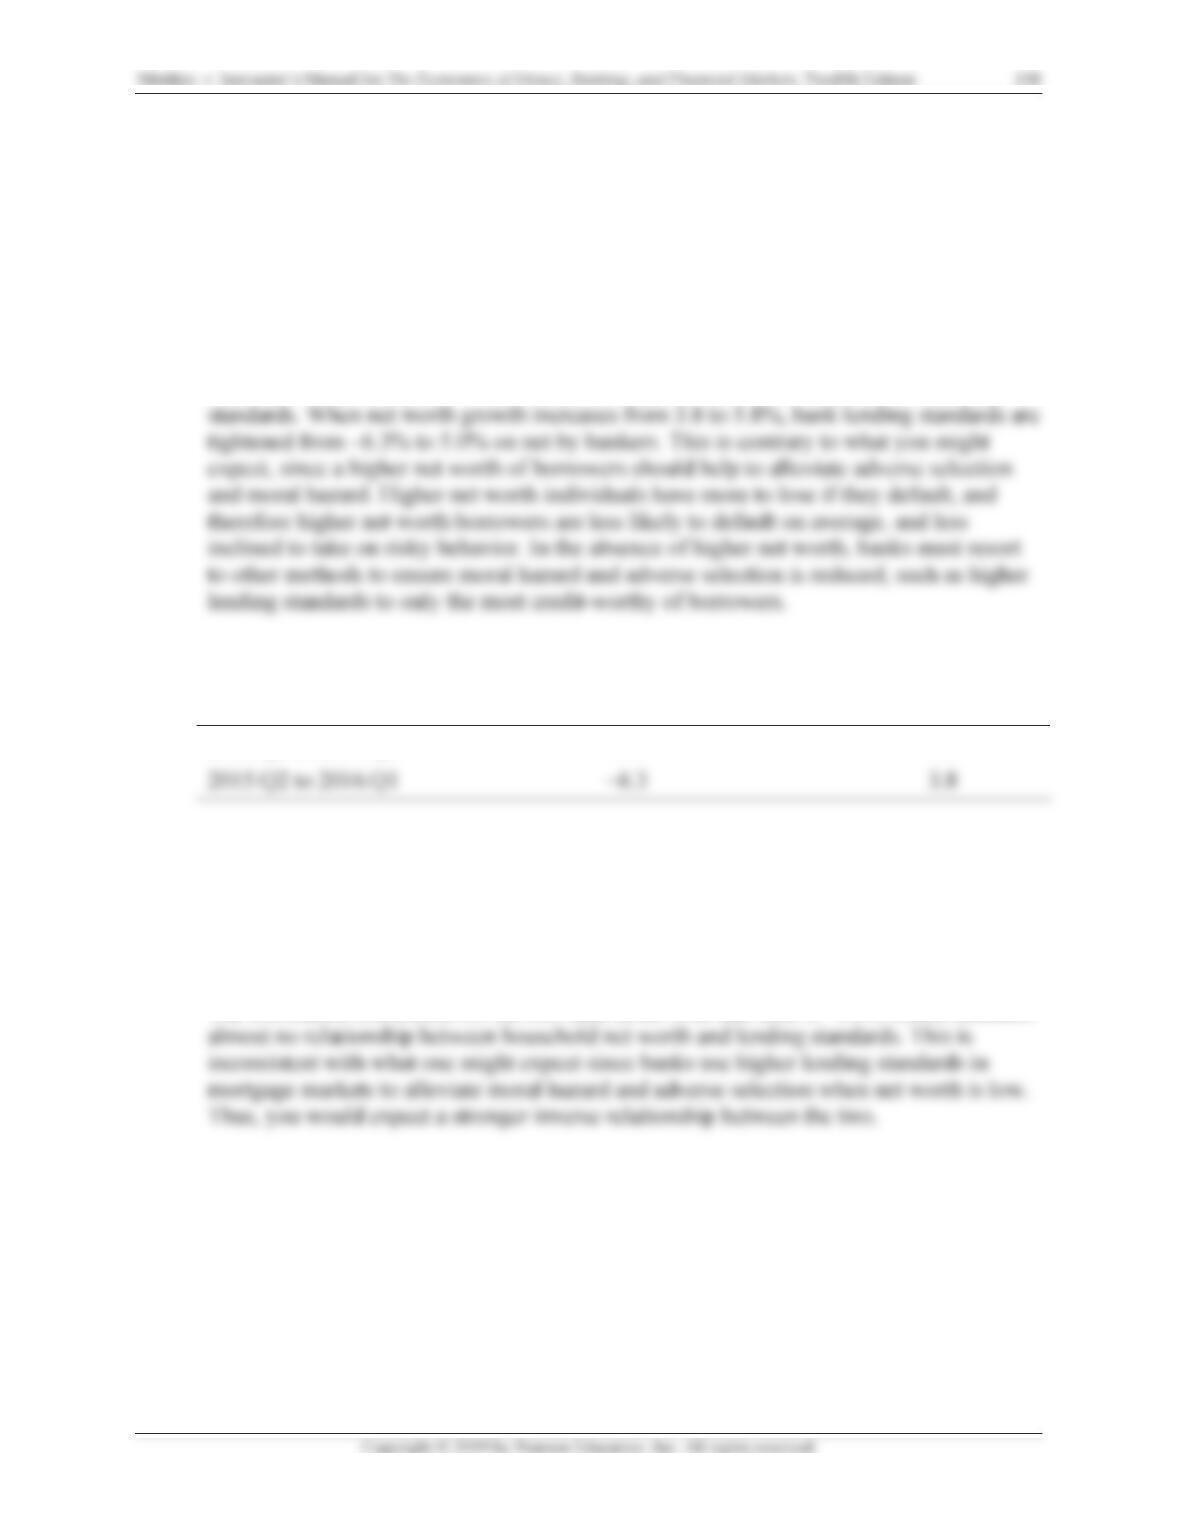
See summary table below for the periods of 2016:Q2 to 2017:Q1 and 2015:Q2 to
2016:Q1. There seems to be a direct relationship between net worth and bank lending
Net Tightening of Auto Lending
Standards, Average
Net Worth Average
Growth Rate
2016:Q2 to 2017:Q1 5.0 5.8
b. Use the Data Analysis tool in Excel to calculate the correlation coefficient for the two
data series from 2007:Q3 to the most recent quarter of data available. What can you
conclude about the relationship between the net worth of households and bank mortgage
lending standards? Is this result consistent with efforts to reduce asymmetric
information?
The correlation coefficient for the two data series over that time is –0.09, which indicates