CHAPTER 8
Income Disparity among Countries
and Endogenous Growth
KEY IDEAS IN THIS CHAPTER
1. The Solow growth model predicts that in the long run all countries have the same
2. Empirical evidence, however, is at odds with such a prediction. The absence of
3. The endogenous growth model with human capital predicts there can be unlimited
4. According to the endogenous growth model, government policies can alter the rate of
5. In the endogenous growth model, per capita incomes do not converge across rich and
poor countries, even if countries are identical in every way except initial levels of
human capital.
NEW IN THE FOURTH EDITION
2. All data and graphs have been updated.
3. New end-of-chapter problems have been added.
TEACHING GOALS
The Solow model of economic growth provides several testable hypotheses about
differences in growth experiences across countries. Identical countries should have
identical long run growth rates and standards of living. Therefore identical countries
should converge to the same levels of capital per worker and income per worker.
Chapter 8: Income Disparity among Countries and Endogenous Growth
Differences in equilibrium growth paths require differences in savings rates, population
growth rates, and levels of technology. While differences in savings rates and population
growth rates may account for some differences in the equilibrium levels of income per
worker, such differences cannot account for the often dramatic differences we observe in
living standards throughout the world. The Solow model predicts that, given the same
technology, the poorer countries should be catching up to the richer countries. This
prediction is at odds with the facts. For the Solow model to explain persistent, dramatic
differences in living standards, we need to believe that poorer countries face significant
barriers to the adoption of new technologies.
CLASSROOM DISCUSSION TOPICS
There is a substantial body of economic analysis that focuses on so-called rent-seeking
activities. Loosely speaking, rent seeking refers to the allocation of resources away from
productive activities and redirecting resources towards gaining a larger share of what has
already been produced. Encourage students to come up with examples in which groups
attempt to block the introduction of new technologies. Can such activities be privately
profitable even while they are socially wasteful?
Students are naturally quite self-interested in issues about the role of government in
education. Should primary and secondary education be primarily a responsibility of
government? What about government aid to higher education? I like to point to the
hypothesis that private markets efficiently allocate educational resources. In the context
of the endogenous growth model, is it likely that society will find the best growth path?
Are there human capital externalities that might lead to underinvestment in education?
Are capital market failures in the student loan market important? Are questions of equity
more important than issues of efficiency?
Economic models discussed in the last chapter and in this chapter highlight growth that
comes about because of changes in the inputs of capital and labour or in productivity.
There are many noneconomic factors which affect economic growth. Entrepreneurial
spirit and political stability are two such factors. In most places where growth has been
rapid, each of these has been available. Growth usually requires people to break out of
their old ways—to follow new methods or use new materials. If growth came about only
Instructor’s Manual for Macroeconomics, Fourth Canadian Edition
Political stability is almost an absolute requirement for economic advance. The breakup
of the former Yugoslavia and the ensuing war dramatically affected production. It is
OUTLINE
1. Convergence of Growth Experiences
a) Predictions of the Solow model
i) Identical Technologies
ii) Technological Differences
b) Convergence: Theory and Evidence
i) Convergence in Rich Countries
2. Endogenous Growth: A Model of Human Capital Accumulation
a) Human Capital
i) Nonrivalry
ii) Efficiency Units of Labour
iii) Constant Returns to Scale
Chapter 8: Income Disparity among Countries and Endogenous Growth
TEXTBOOK QUESTION SOLUTIONS
Problems
1. Differences in population growth rates may account for differences in the equilibrium
levels of capital per worker and output per worker across otherwise identical
2. a) First, we need to solve for the steady state quanity of capital per worker, k*,
which solves
(*) ( ) *szf k n d k=+ ,
so,
c) With a doubling in total factor productivity (TFP), income per worker more than
3. An increase in the marginal product of efficiency unit of labour increases the real
4. Government activity in the endogenous growth model.
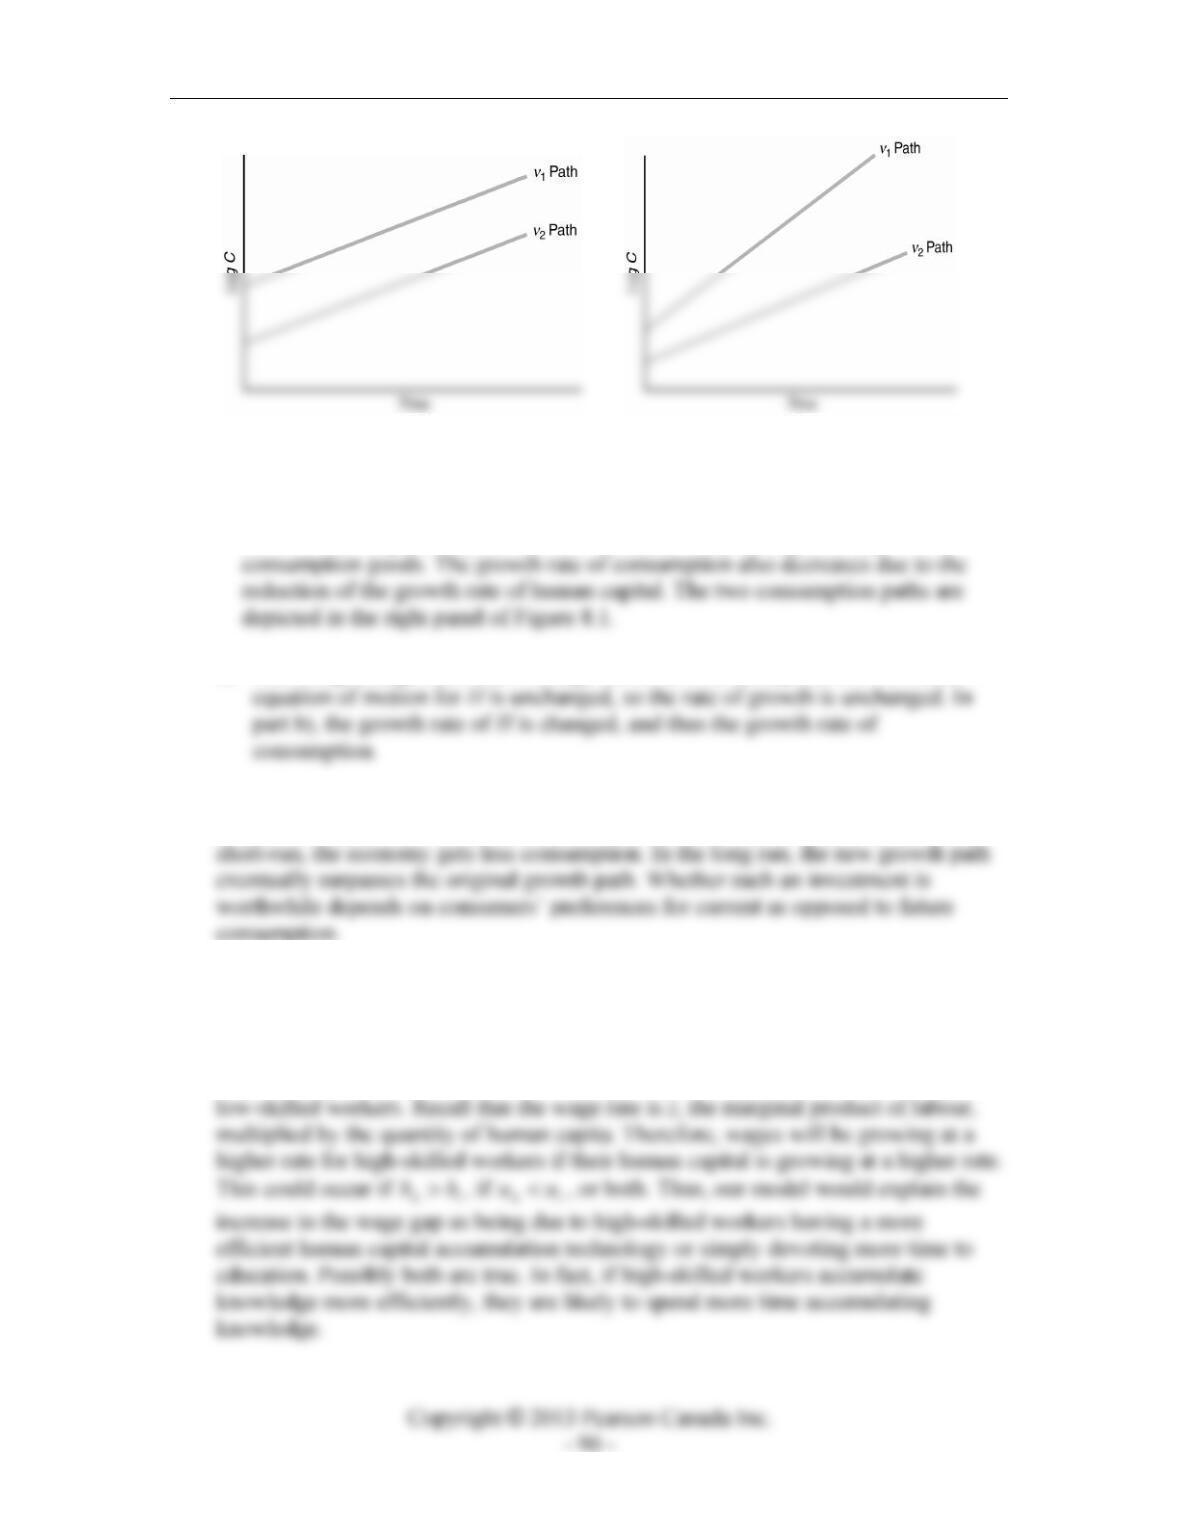
a) The equation of motion for the economy is now given by:
‘(1 )Hb uvH=−− .
A change in v, holding u + v constant, has no effect on the path of H.
Instructor’s Manual for Macroeconomics, Fourth Canadian Edition
Figure 8.1
b) Holding u constant, an increase in v reduces the growth rate of human capital. The
level of consumption falls as workers are taken away from producing
c) Offsetting changes in u and v change the level of consumption. However, the
5. The one-time expenditure lowers the growth path of consumption with no change in
the growth rate. The increase in b increases the growth rate of the economy. In the
6. The model, modified in this way, then predicts that that human capital for the high
skilled grows at the rate 1)1( −− hh ub , and human capital for the low skilled grows
at the rate 1)1( −− ll ub . What we have observed in the United States is that the
wages of high-skilled workers have been growing at a higher rate than the wages of
7. a) Income per capita and real wages will be higher in the rich country, as total factor
productivity is higher there, but growth rates of income per capita will be the
same in both countries, as b and u are the same in both countries.
e) The model has the property that the welfare of each individual is independent of
how many other individuals there are in the economy, so it is best here for
everyone to migrate to where TFP is highest. As a model of immigration, there are
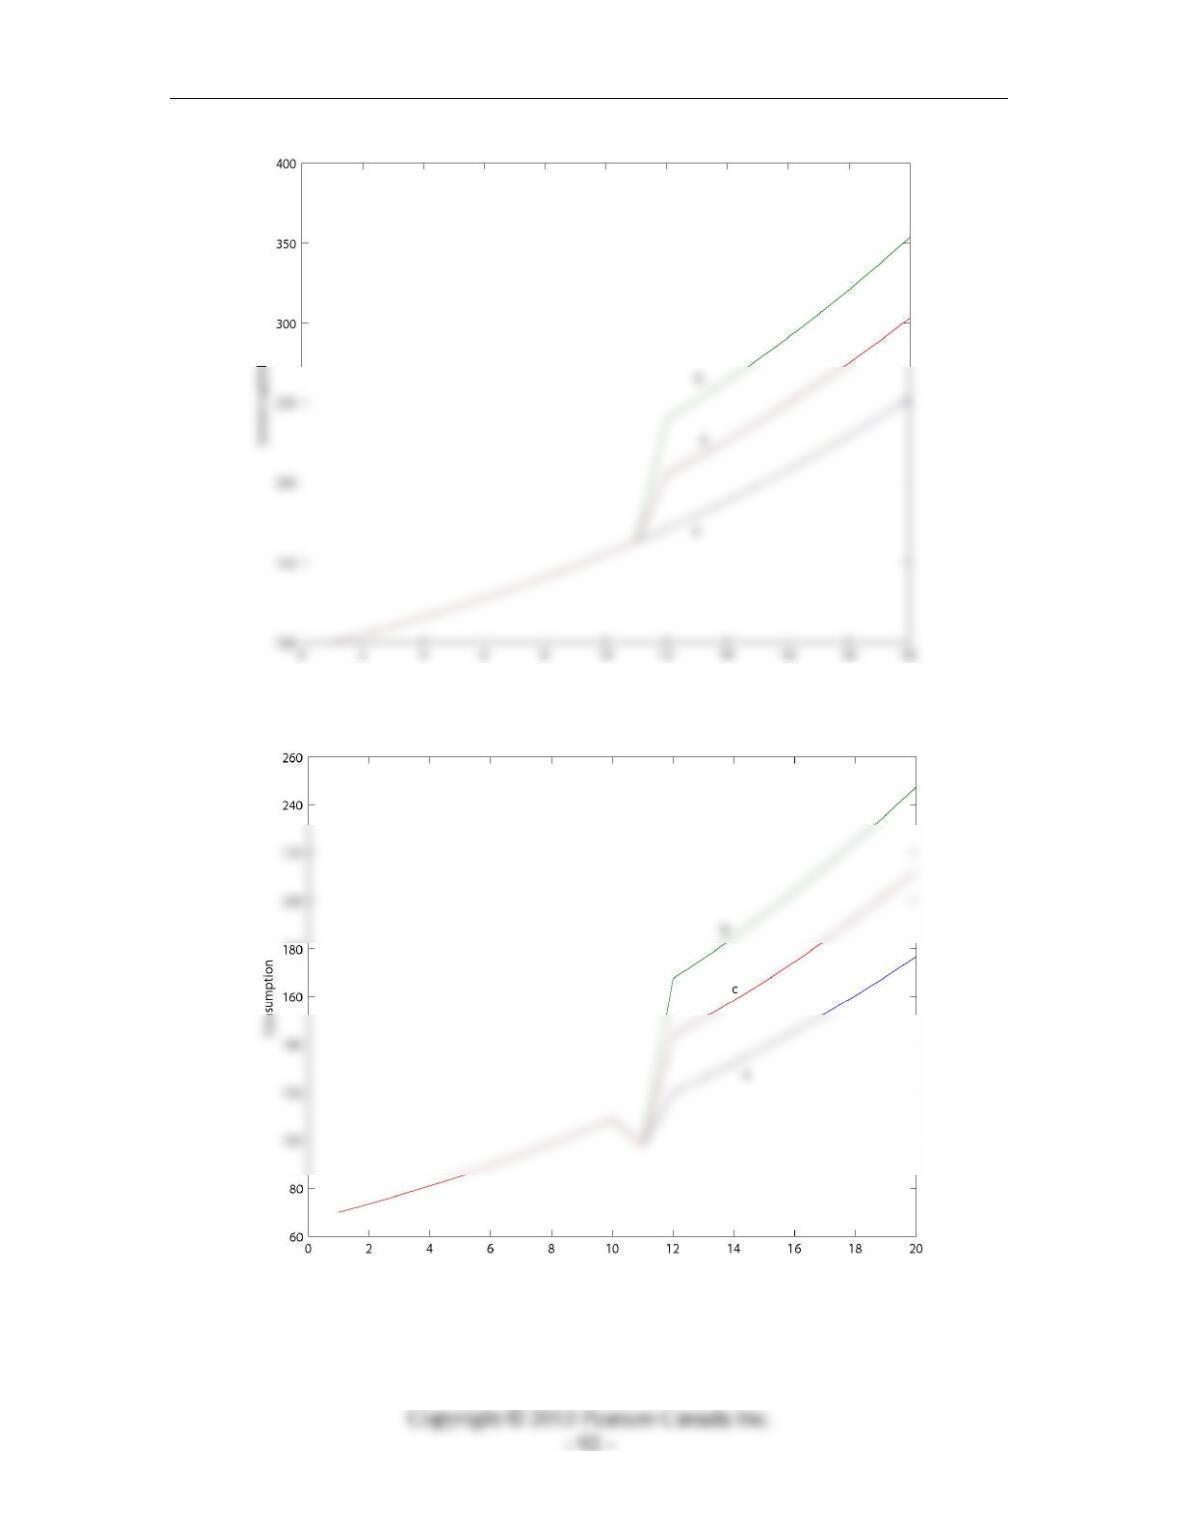
8. We start with H = 100 in period 1, and then human capital evolves according to
‘ (1 )Hb usH
=−−
with consumption satisfying C = zuH. Assume that z = 1, and that u = .7 and s = .05
for periods 1, 2,…, 10 and periods 12, 13,…,20. We consider alternative scenarios for
period 11. For part (a), u = .6 and s = .15, so that unemployment increases
Instructor’s Manual for Macroeconomics, Fourth Canadian Edition
Figure 8.2
Figure 8.3