
Chapter 8: Risk and Rates of Return
Integrated Case
199
tax–exempt bonds, they would be truly riskless, but all actual
securities are exposed to some type of risk.
A. (2) Why are High Tech’s returns expected to move with the economy,
whereas Collections’ are expected to move counter to the economy?
Answer: [Show S8-7 here.] High Tech’s returns move with, hence are
positively correlated with, the economy, because the firm’s sales, and
B. Calculate the expected rate of return on each alternative and fill in the
blanks on the row for
r
ˆ
in the previous table.
Answer: [Show S8-8 and S8-9 here.] The expected rate of return,
r
ˆ
, is
expressed as follows:
r
ˆ

200
Integrated Case
Chapter 8: Risk and Rates of Return
C. You should recognize that basing a decision solely on expected
returns is appropriate only for risk–neutral individuals. Because your
client, like most people, is risk-averse, the riskiness of each
alternative is an important aspect of the decision. One possible
measure of risk is the standard deviation of returns.
(1) Calculate this value for each alternative and fill in the blank on the
row for in the table.
Answer: [Show S8-10 and S8-11 here.] The standard deviation is calculated as
follows:
Chapter 8: Risk and Rates of Return
Integrated Case
201
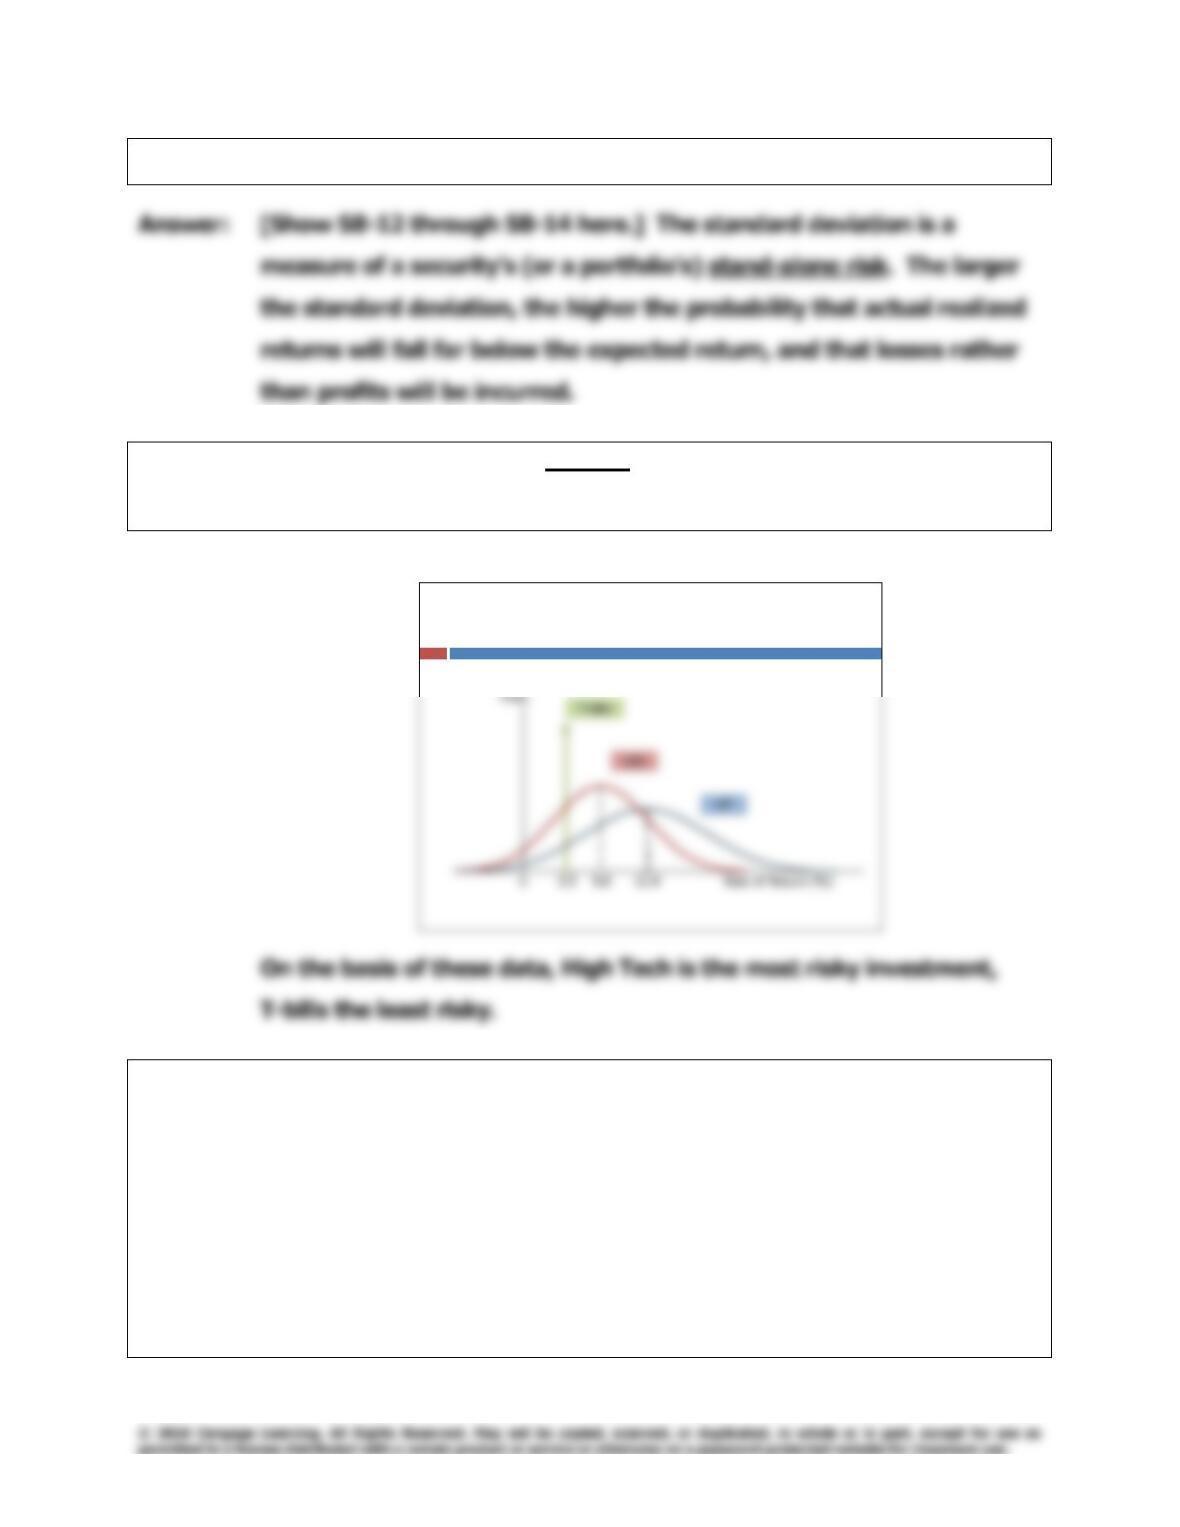
C. (2) What type of risk is measured by the standard deviation?
C. (3) Draw a graph that shows roughly the shape of the probability
distributions for High Tech, U.S. Rubber, and T-bills.
Answer:
Comparing Standard Deviations
D. Suppose you suddenly remembered that the coefficient of variation
(CV) is generally regarded as being a better measure of stand-alone
risk than the standard deviation when the alternatives being
considered have widely differing expected returns. Calculate the
missing CVs and fill in the blanks on the row for CV in the table.
Does the CV produce the same risk rankings as the standard
deviation? Explain.

202
Integrated Case
Chapter 8: Risk and Rates of Return
Answer: [Show S8-15 through S8-18 here.] The coefficient of variation (CV) is
a standardized measure of dispersion about the expected value; it
shows the amount of risk per unit of return.
E. Suppose you created a two-stock portfolio by investing $50,000 in
High Tech and $50,000 in Collections.
(1) Calculate the expected return (
p
r
ˆ
), the standard deviation (p), and
the coefficient of variation (CVp) for this portfolio and fill in the
appropriate blanks in the table.
Answer: [Show S8-19 through S8-22 here.] To find the expected rate of return
on the two-stock portfolio, we first calculate the rate of return on the
Chapter 8: Risk and Rates of Return
Integrated Case
203
Alternatively, we could apply this formula,
204
Integrated Case
Chapter 8: Risk and Rates of Return
E. (2) How does the riskiness of this two-stock portfolio compare with the
riskiness of the individual stocks if they were held in isolation?
Answer: [Show S8-23 through S8-27 here.] Using either or CV as our stand-
Optional Question
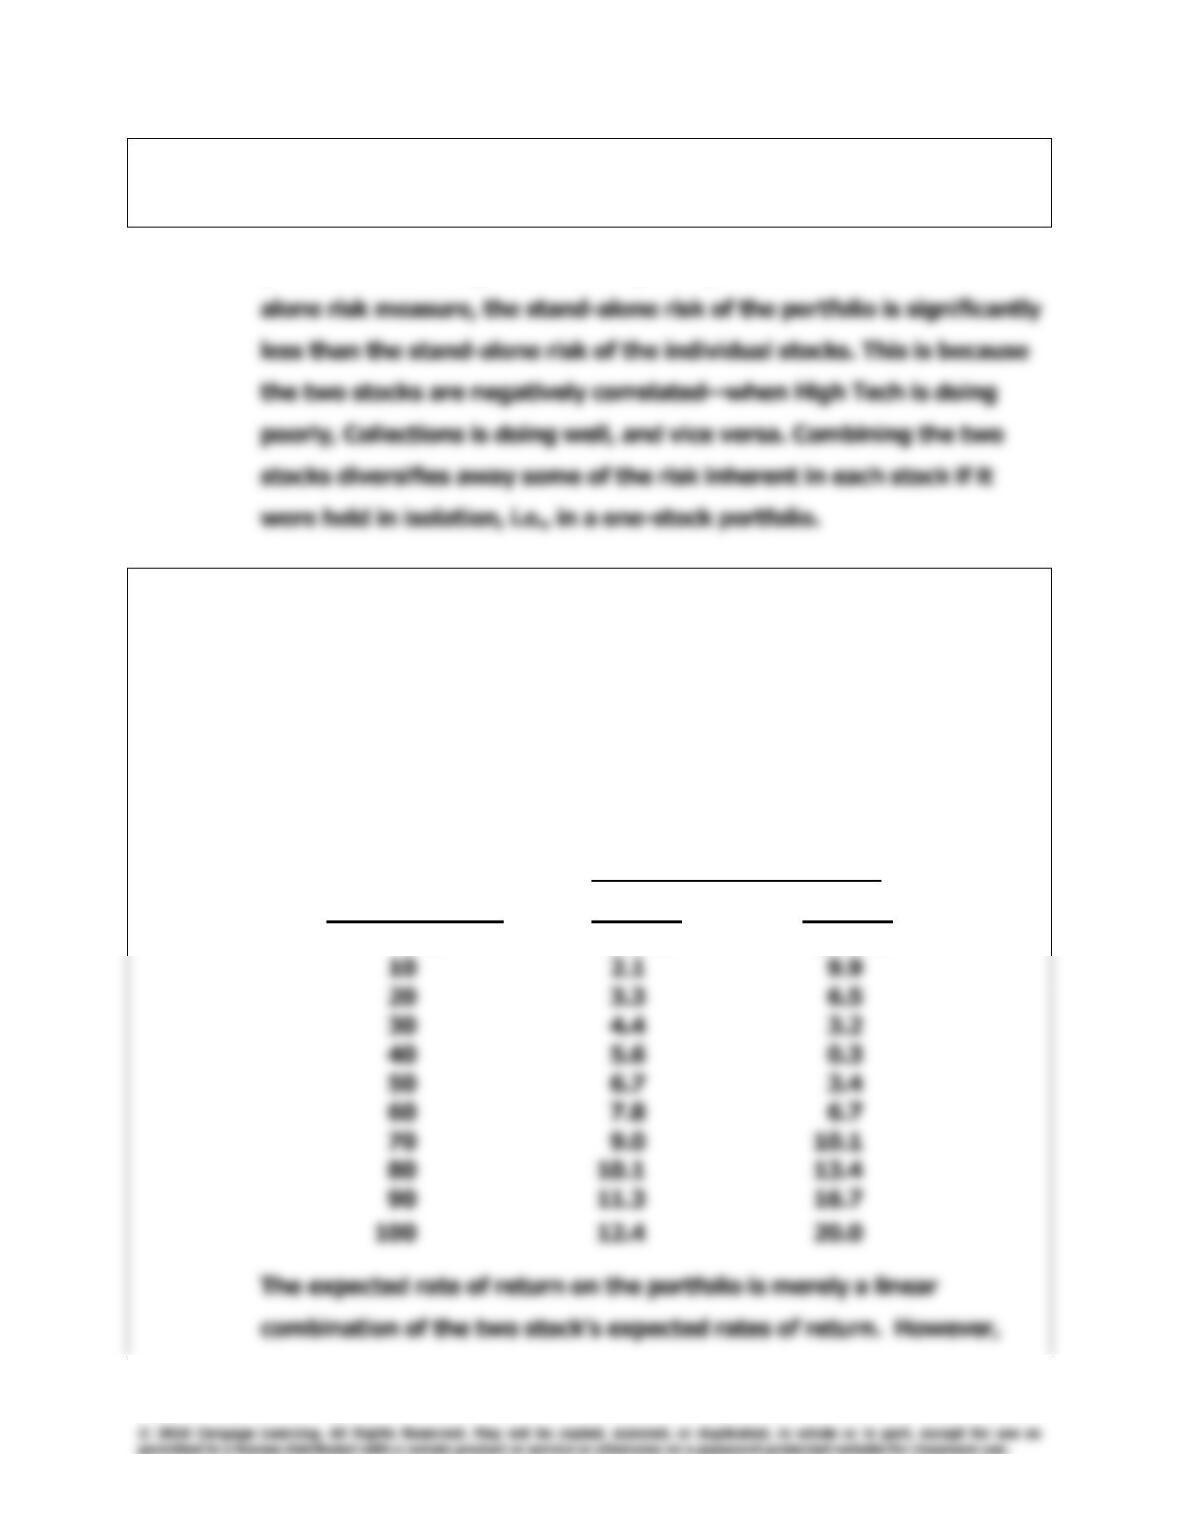
Does the expected rate of return on the portfolio depend on the percentage of
the portfolio invested in each stock? What about the riskiness of the portfolio?
Answer: Using a spreadsheet model, it’s easy to vary the composition of the
portfolio to show the effect on the portfolio’s expected rate of return
and standard deviation:
High Tech Plus Collections
% in High Tech
0% 1.0% 13.2%
p
r
ˆ
p
Chapter 8: Risk and Rates of Return
Integrated Case
205
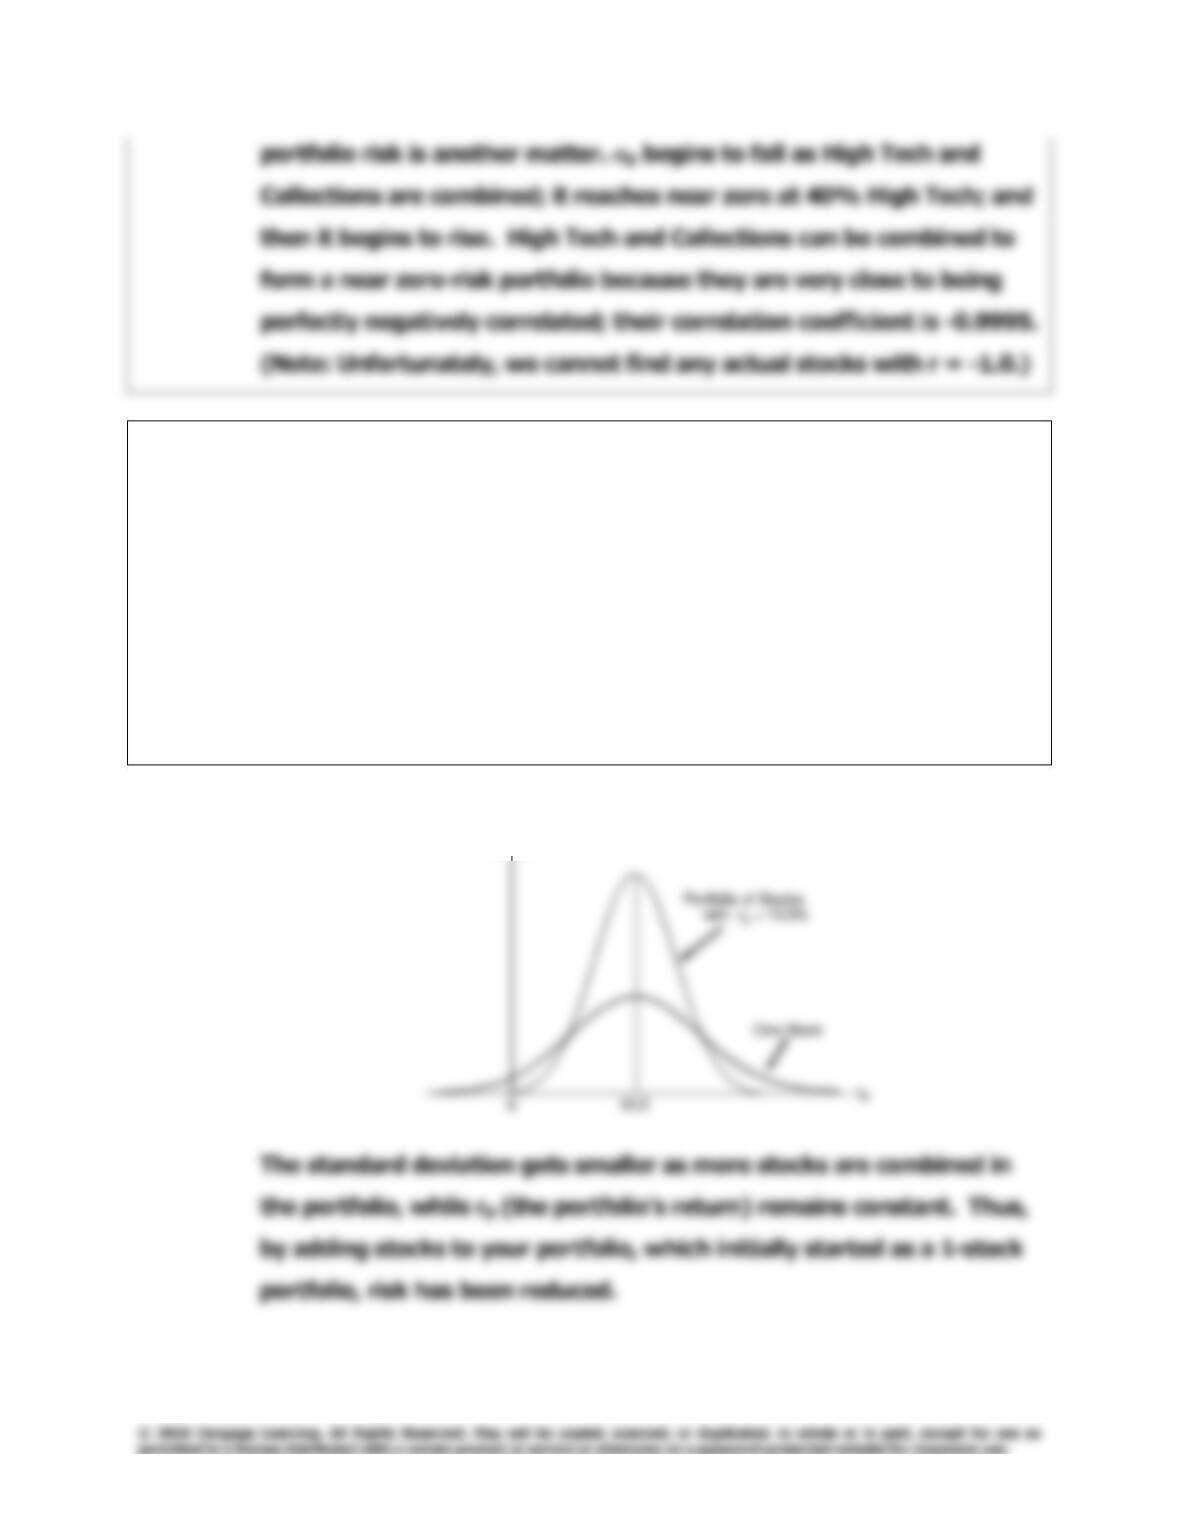
F. Suppose an investor starts with a portfolio consisting of one
randomly selected stock.
(1) What would happen to the riskiness and to the expected return of
the portfolio as more randomly selected stocks were added to the
portfolio?
(2) What is the implication for investors? Draw a graph of the two
portfolios to illustrate your answer.
Answer: [Show S8-28 here.]
Density
Density

206
Integrated Case
Chapter 8: Risk and Rates of Return
G. (1) Should the effects of a portfolio impact the way investors think about
the riskiness of individual stocks?
Answer: [Show S8-29 and S8-30 here.] Portfolio diversification does affect

Chapter 8: Risk and Rates of Return
Integrated Case
207
G. (2) If you decided to hold a one-stock portfolio (and consequently were
exposed to more risk than diversified investors), could you expect to be
compensated for all of your risk; that is, could you earn a risk premium
on the part of your risk that you could have eliminated by diversifying?
Answer: [Show S8-31 here.] If you hold a one-stock portfolio, you will be
H. The expected rates of return and the beta coefficients of the alternatives
supplied by Merrill Finch’s computer program are as follows:
Security Return (
r
ˆ
) Risk (Beta)
High Tech 12.4% 1.32
Market 10.5 1.00
U.S. Rubber 9.8 0.88
T–Bills 5.5 0.00
Collections 1.0 (0.87)
(1) What is a beta coefficient, and how are betas used in risk analysis?

208
Integrated Case
Chapter 8: Risk and Rates of Return
Answer: [Show S8-32 through S8-38 here.]
High Tech
(slope = beta = 1.32)
Market
(slope = beta = 1.0)
Return on Stock i
(%)
40
H. (2) Do the expected returns appear to be related to each alternative’s
market risk?

Chapter 8: Risk and Rates of Return
Integrated Case
209
Answer: [Show S8-39 here.] The expected returns are related to each
H. (3) Is it possible to choose among the alternatives on the basis of the
information developed thus far? Use the data given at the start of the
problem to construct a graph that shows how the T–bill’s, High Tech’s,
and the market’s beta coefficients are calculated. Then discuss what
betas measure and how they are used in risk analysis.
I. The yield curve is currently flat; that is, long–term Treasury bonds also
have a 5.5% yield. Consequently, Merrill Finch assumes that the risk–
free rate is 5.5%.
(1) Write out the Security Market Line (SML) equation, use it to calculate
the required rate of return on each alternative, and graph the
relationship between the expected and required rates of return.
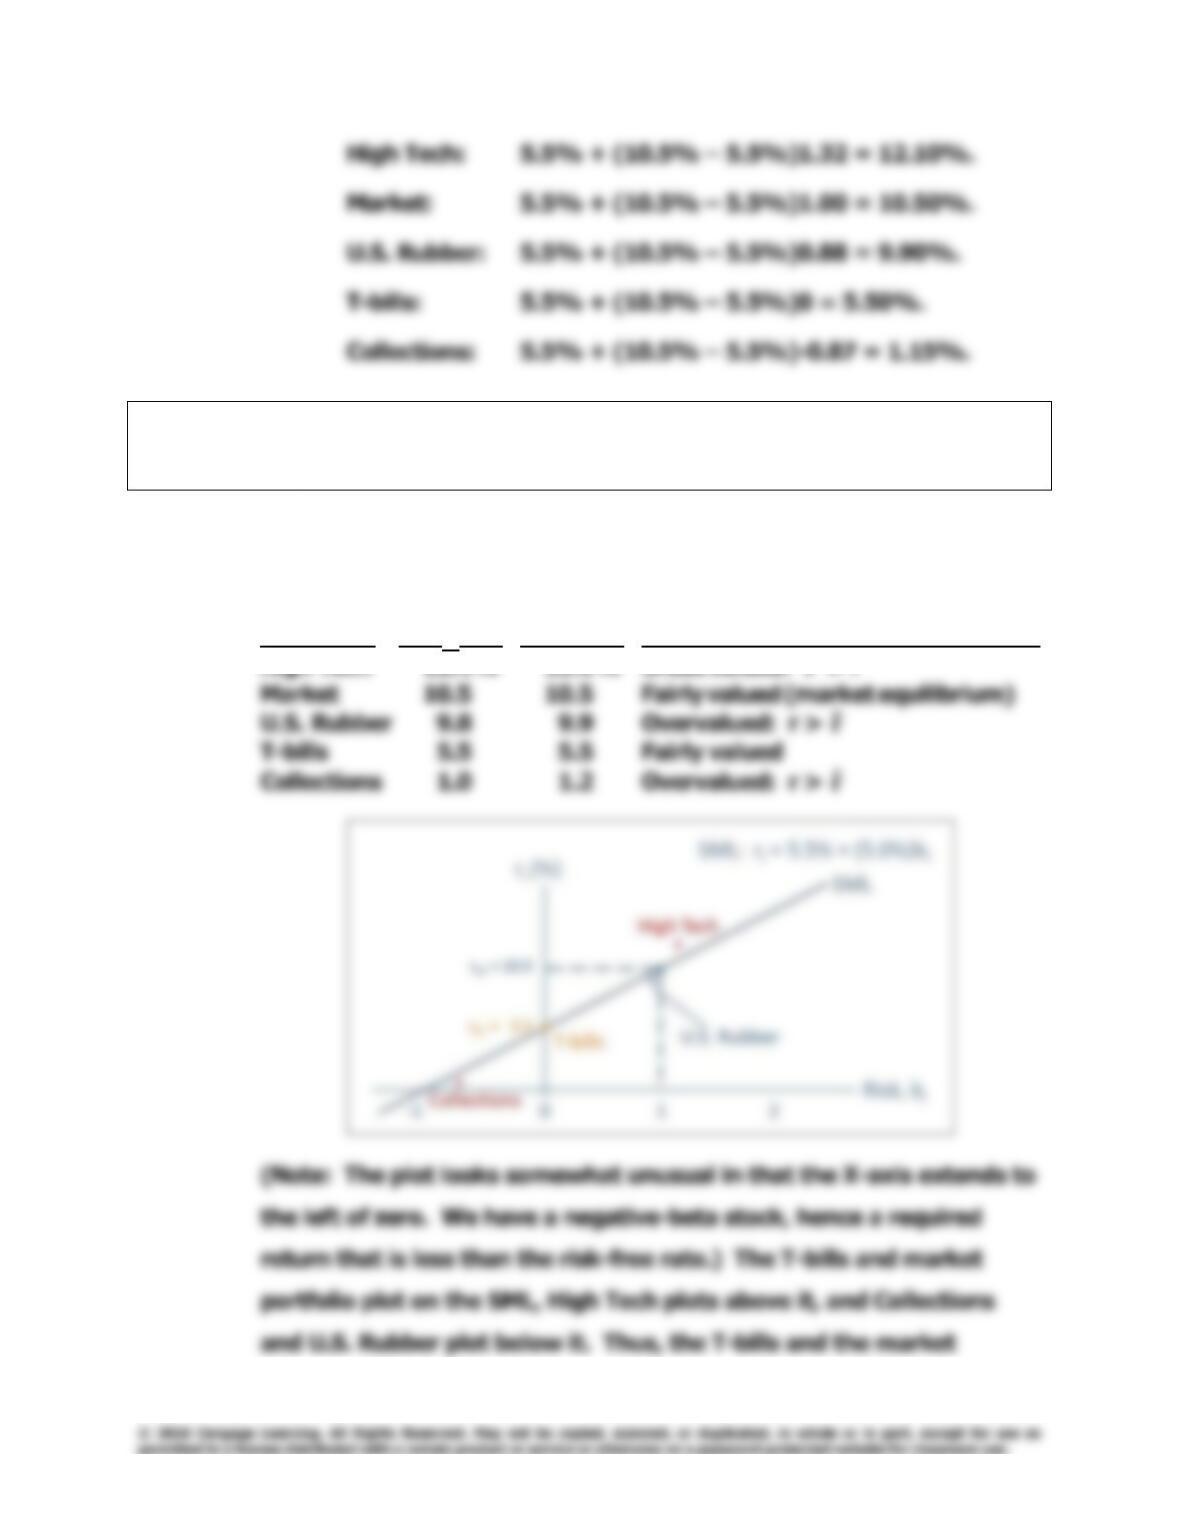
Answer: [Show S8-40 through S8-42 here.] Here is the SML equation:
210
Integrated Case
Chapter 8: Risk and Rates of Return
I. (2) How do the expected rates of return compare with the required rates
of return?
Answer: [Show S8-43 and S8-44 here.] We have the following relationships:
Expected Required
Return Return
Security (
r
ˆ
) (r) Condition
r
r
ˆ
r
ˆ
ˆ
Chapter 8: Risk and Rates of Return
Integrated Case
211
I. (3) Does the fact that Collections has an expected return that is less than
the T-bill rate make any sense? Explain.
Answer: Collections is an interesting stock. Its negative beta indicates
negative market risk—including it in a portfolio of “normal” stocks will
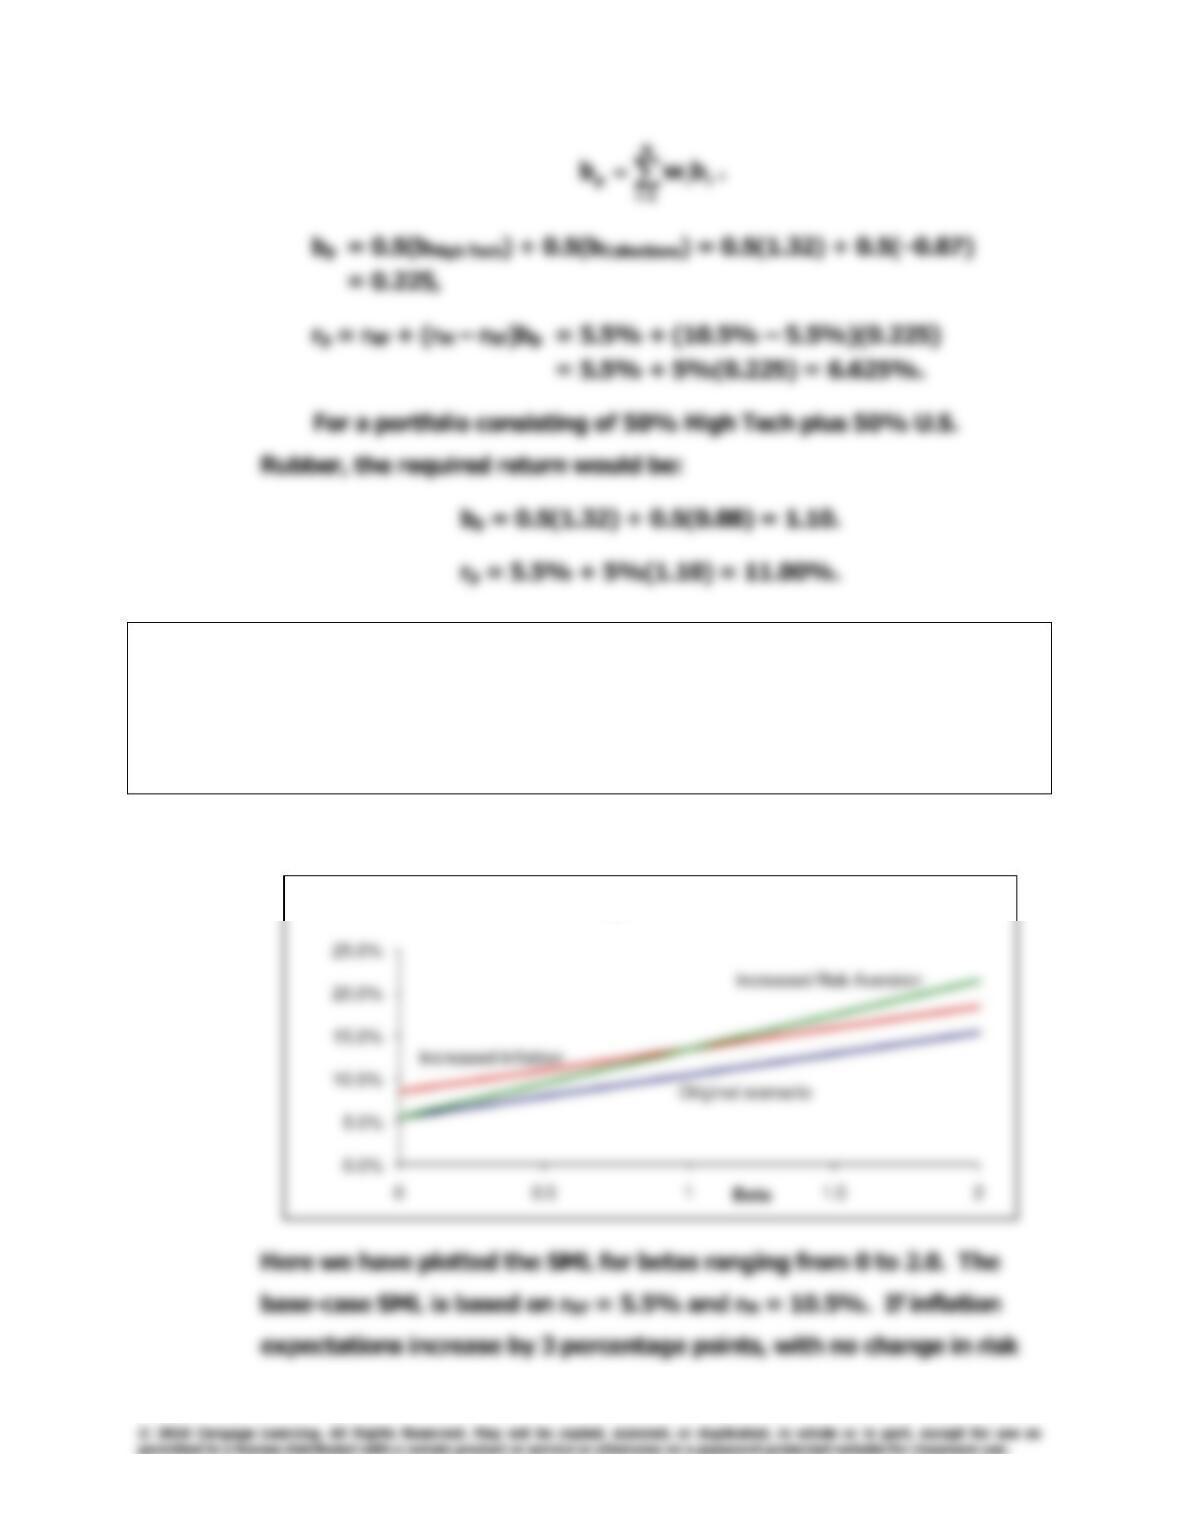
I. (4) What would be the market risk and the required return of a 50–50
portfolio of High Tech and Collections? Of High Tech and U.S. Rubber?
Answer: [Show S8-45 and S8-46 here.] Note that the beta of a portfolio is
212
Integrated Case
Chapter 8: Risk and Rates of Return
J. (1) Suppose investors raised their inflation expectations by 3 percentage
points over current estimates as reflected in the 5.5% risk-free rate.
What effect would higher inflation have on the SML and on the
returns required on high- and low-risk securities?
Answer: [Show S8-47 here.]
Required return
Changes in the SML
Chapter 8: Risk and Rates of Return
Integrated Case
213
J. (2) Suppose instead that investors’ risk aversion increased enough to
cause the market risk premium to increase by 3 percentage points.
(Inflation remains constant.) What effect would this have on the SML
and on returns of high- and low–risk securities?
Answer: [Show S8-48 through S8-50 here.] When investors’ risk aversion
Optional Question
Financial managers are more concerned with investment decisions relating to
real assets such as plant and equipment than with investments in financial
assets such as securities. How does the analysis that we have gone through
relate to real-asset investment decisions, especially corporate capital budgeting
decisions?
Answer: There is a great deal of similarity between your financial asset
decisions and a firm’s capital budgeting decisions. Here is the
linkage:
214
Integrated Case
Chapter 8: Risk and Rates of Return
2. Companies obtain their investment funds from investors, who