CHAPTER 8
(MACRO CHAPTER 8)
Macroeconomic Equilibrium: Aggregate
Demand and Supply
FUNDAMENTAL QUESTIONS
1. What factors affect aggregate demand?
2. What causes the aggregate demand curve to shift?
OVERVIEW AND OBJECTIVES
The primary purpose of this chapter is to introduce the aggregate demand and supply model. This is the
second major macroeconomic model developed in the book.
The unique features of the chapter include the development of the aggregate demand curve from its
foundation in the aggregate expenditures curve. The chapter also shows the factors that cause the
aggregate demand curve to shift. The aggregate supply curve is also developed, and the short-run
aggregate supply curve is distinguished from the supply curve that exists in the long run.
After reading and reviewing this chapter, the student should be able to:
1. Define aggregate demand and aggregate supply.
2. Show how business cycles result from changes in aggregate demand and aggregate supply.
50 Chapter 8: Macroeconomic Equilibrium: Aggregate Demand and Supply
KEY TERM REVIEW
demand-pull inflation
cost-push inflation
wealth effect
LECTURE OUTLINE AND TEACHING STRATEGIES
I. Aggregate Demand, Aggregate Supply, and Business Cycles
Teaching Strategy: Be careful using the supply and demand analogy here. If you don’t push it
too far, using information that the students already know about market models can help introduce
aggregate supply and demand, but they should not get the impression that the macro model is just
the sum of individual markets. The underlying arguments in both cases are distinct.
A. Aggregate demand and business cycles: Recessions can occur when aggregate demand falls,
II. Factors That Influence Aggregate Demand
A. Consumption: Consumption spending depends on income, wealth, expectations,
demographics, and taxes.
B. Investment: Investment depends on factors that determine its profitability, including the
interest rate, technology, cost of capital goods, and capacity utilization.
C. Government spending: Government spending is a key tool of fiscal policy because it can be
Chapter 8: Macroeconomic Equilibrium: Aggregate Demand and Supply 51
III. The Aggregate Demand Curve
The aggregate demand curve shows aggregate demand in relation to the price level.
A. Why the aggregate demand curve slopes downward
Teaching Strategy: Note that the arguments that were used to establish a downward-
sloping market demand curve do not make sense for an aggregate demand curve because
market quantities respond to relative price changes, while aggregate quantities respond to
general price changes.
1. The wealth effect: A price change causes the real value of wealth to change, resulting
in a change in spending.
B. Changes in aggregate demand: Nonprice determinants
Teaching Strategy: Make certain that your students distinguish between movement along
an aggregate demand curve and a shift in the curve.
1. Expectations
IV. Aggregate Supply
The positive relationship between price and national output is due to changes in profits.
A. Why the aggregate supply curve slopes upward—In the short run, resource prices are
assumed to be constant, so an increase in product prices leads to an increase in profits and
production.
B. Short-run versus long-run aggregate supply: In the long run, all costs are variable, so there is
1. Short-run aggregate supply curve: As the level of real GDP increases, the slope of the
aggregate supply curve becomes steeper.
Teaching Strategy: When you are discussing the shape of the aggregate supply curve,
2. Long-run aggregate supply curve: In the long run, production costs fully adjust to price
increases. As a result, there is no variation in profits as prices change and thus no
variation in real output.
52 Chapter 8: Macroeconomic Equilibrium: Aggregate Demand and Supply
C. Changes in aggregate supply: Nonprice determinants
1. Resource prices
2. Technology
V. Aggregate Demand and Supply Equilibrium
A. Short-run equilibrium: When the short-run aggregate supply curve intersects the aggregate
OPPORTUNITIES FOR DISCUSSION
1. Compare the concepts of supply and demand at the micro and macro levels.
2. Discuss the recession of 2008 in terms of the aggregate supply and demand framework. What
supply-side factors may have influenced the recession?
3. What measures have been taken to increase demand in the recent recession? Did these measures
ANSWERS TO EXERCISES
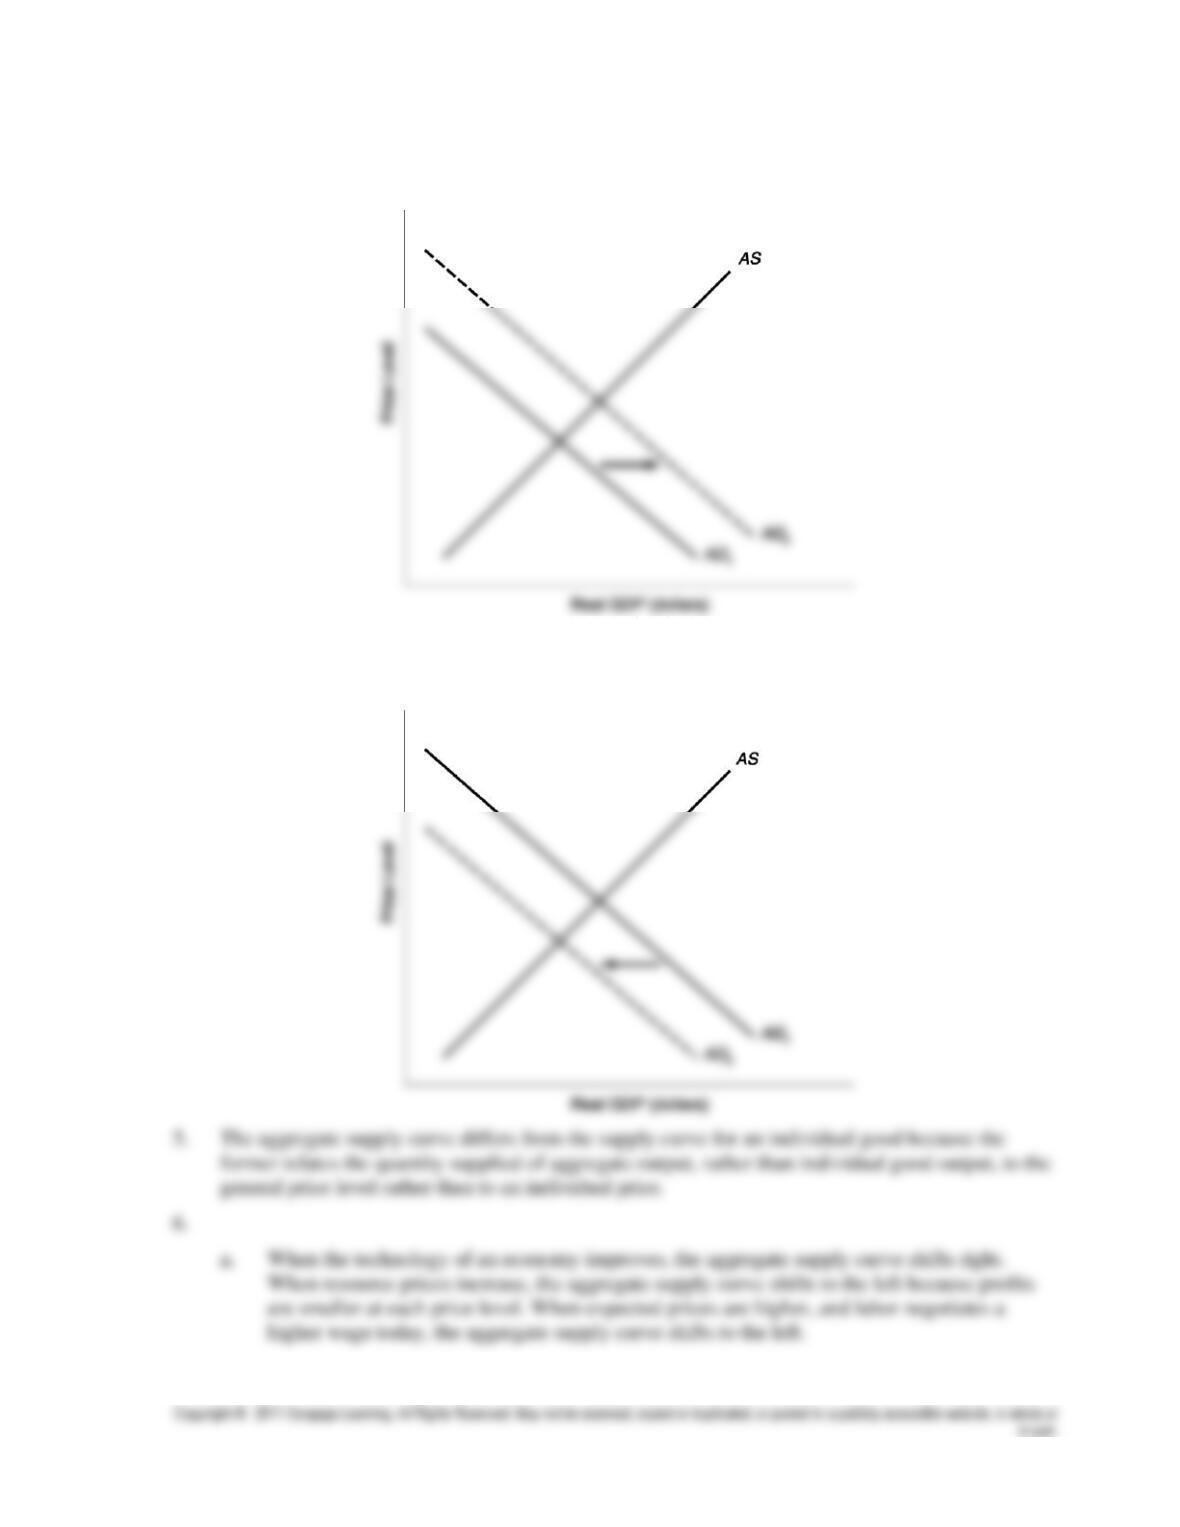
1. The aggregate demand curve differs from the demand curve for an individual good because the
2. The aggregate demand curve slopes down because of three effects. First, when the price level
increases, people’s real wealth declines. This wealth effect leads to a reduction in the aggregate
Chapter 8: Macroeconomic Equilibrium: Aggregate Demand and Supply 53
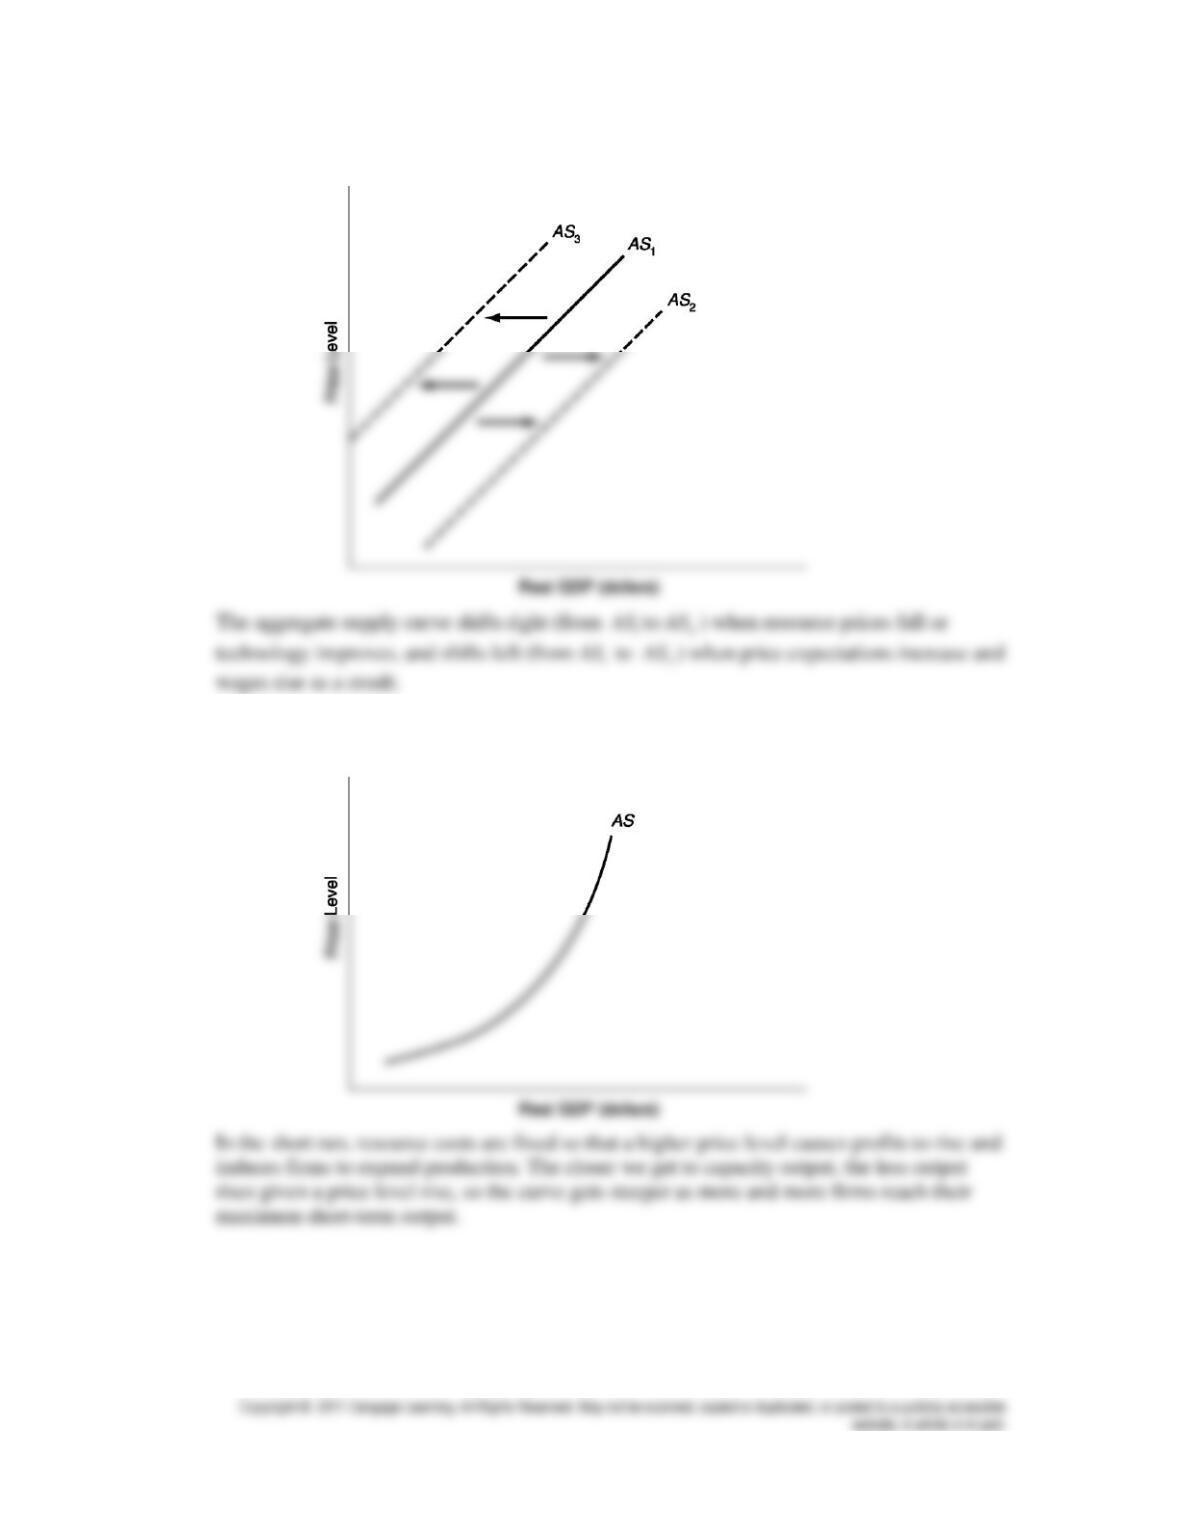
3. The foreign demand for U.S. produced goods and services increases when foreign income
increases. This leads to an increase in aggregate expenditures and aggregate demand (see figure).
4. If foreign prices fall, the demand for foreign produced goods and services will increase. Domestic
exports will decrease because of higher relative domestic prices. As a result, aggregate
expenditures and aggregate demand fall.
54 Chapter 8: Macroeconomic Equilibrium: Aggregate Demand and Supply
b.
7.
a.
Chapter 8: Macroeconomic Equilibrium: Aggregate Demand and Supply 55
b.
8.
a.
56 Chapter 8: Macroeconomic Equilibrium: Aggregate Demand and Supply
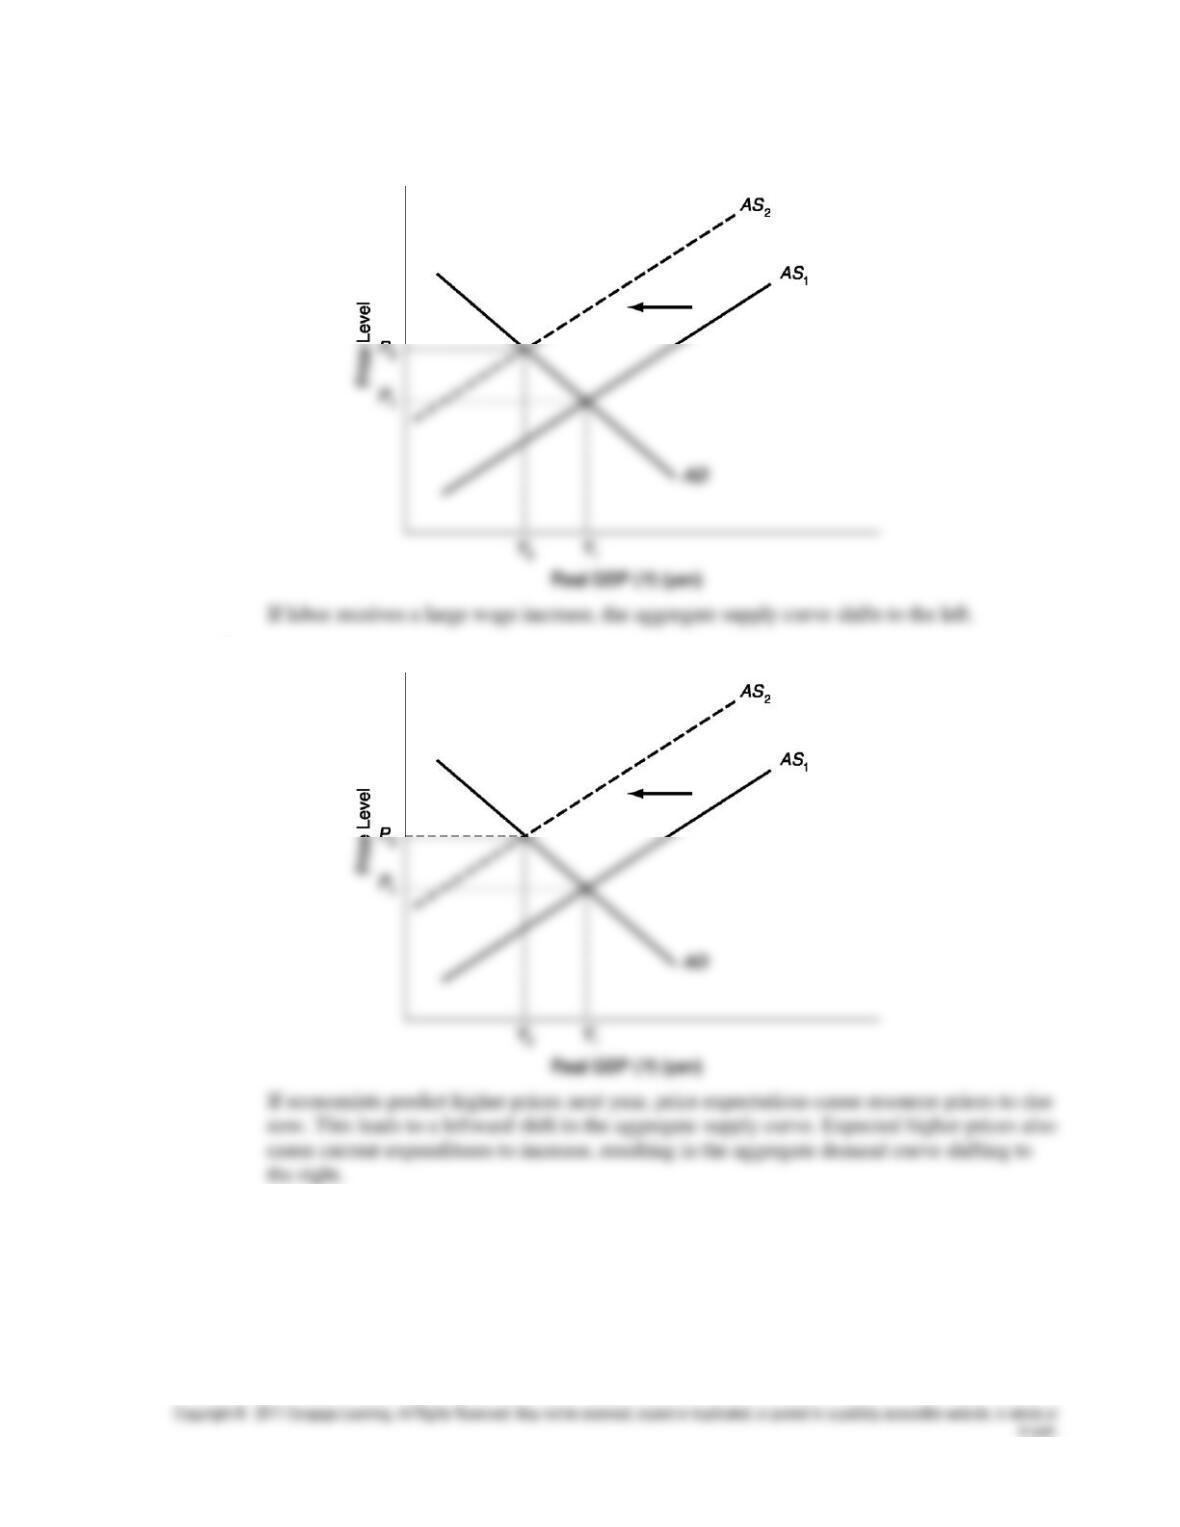
9.
a.
b.
Chapter 8: Macroeconomic Equilibrium: Aggregate Demand and Supply 57
c.
d.
10. The economy is producing at the potential level of real GDP when its productive capacity is
operating at its most efficient level—less than 100 percent capacity. In the short run, the economy
could be producing at a level of capacity utilization greater than this efficient point.
58 Chapter 8: Macroeconomic Equilibrium: Aggregate Demand and Supply
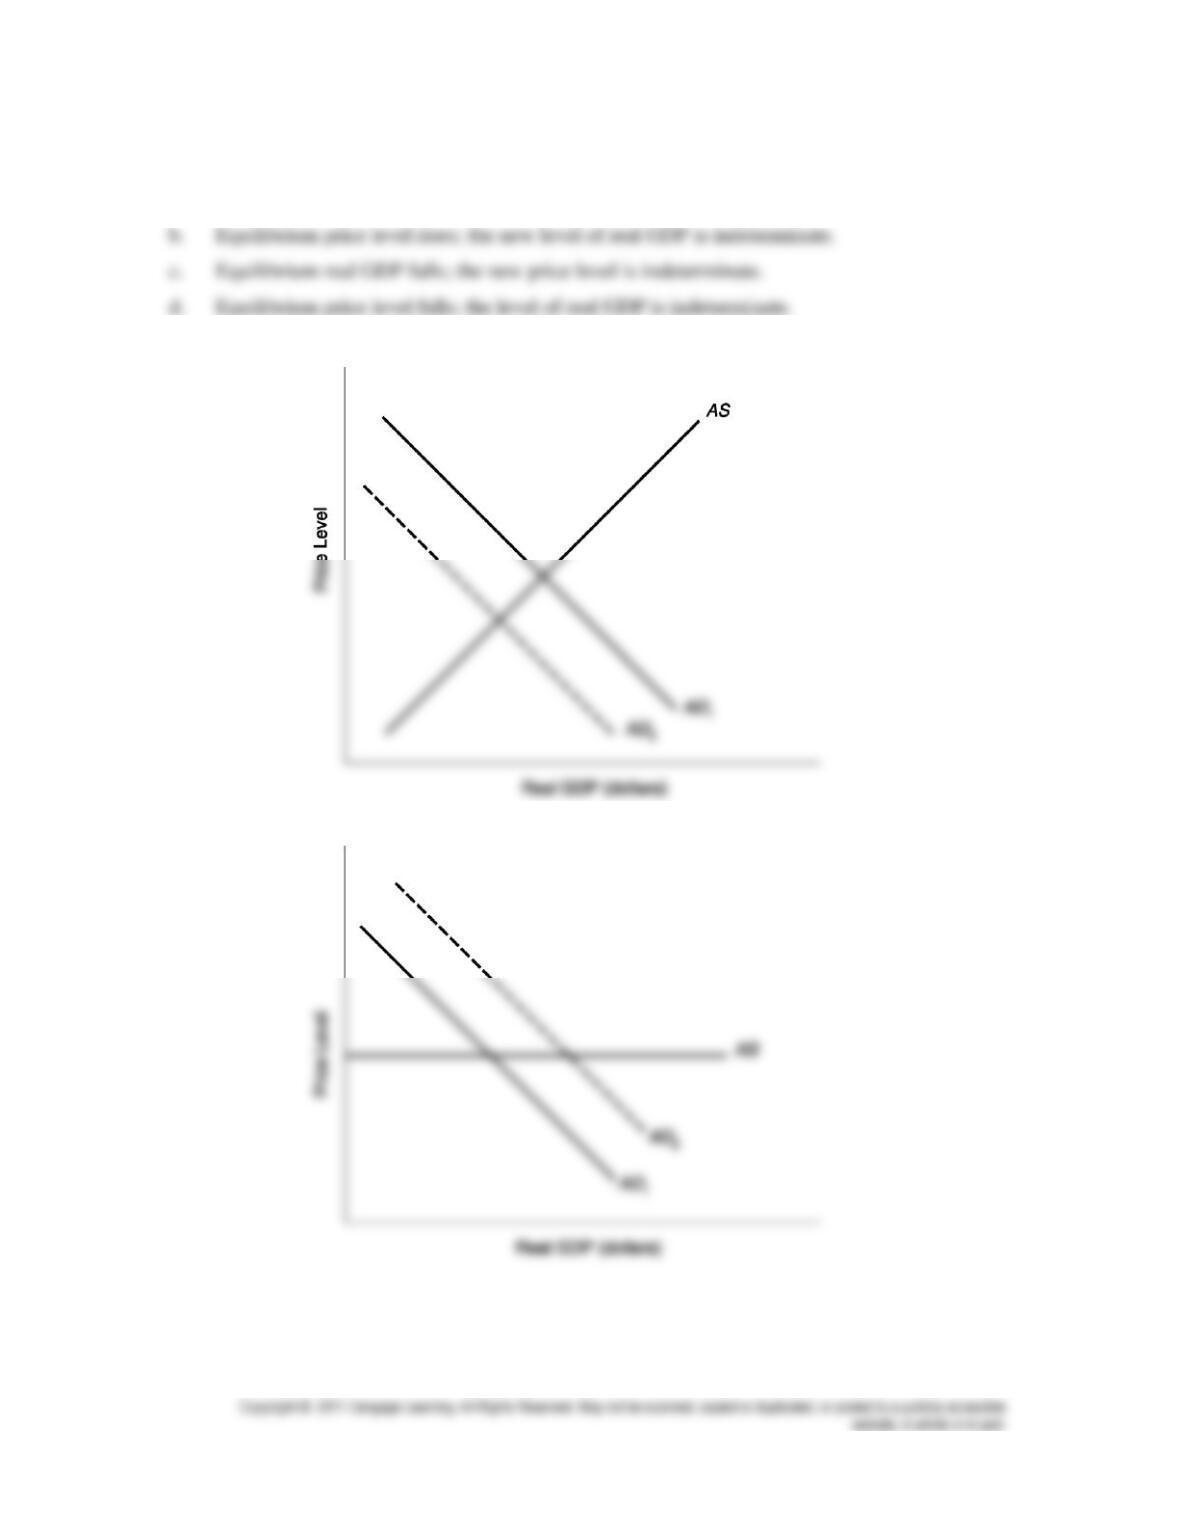
11.
a. Equilibrium real GDP rises; the new price level is indeterminate.
12.
AD
must decrease relative to
AS
:
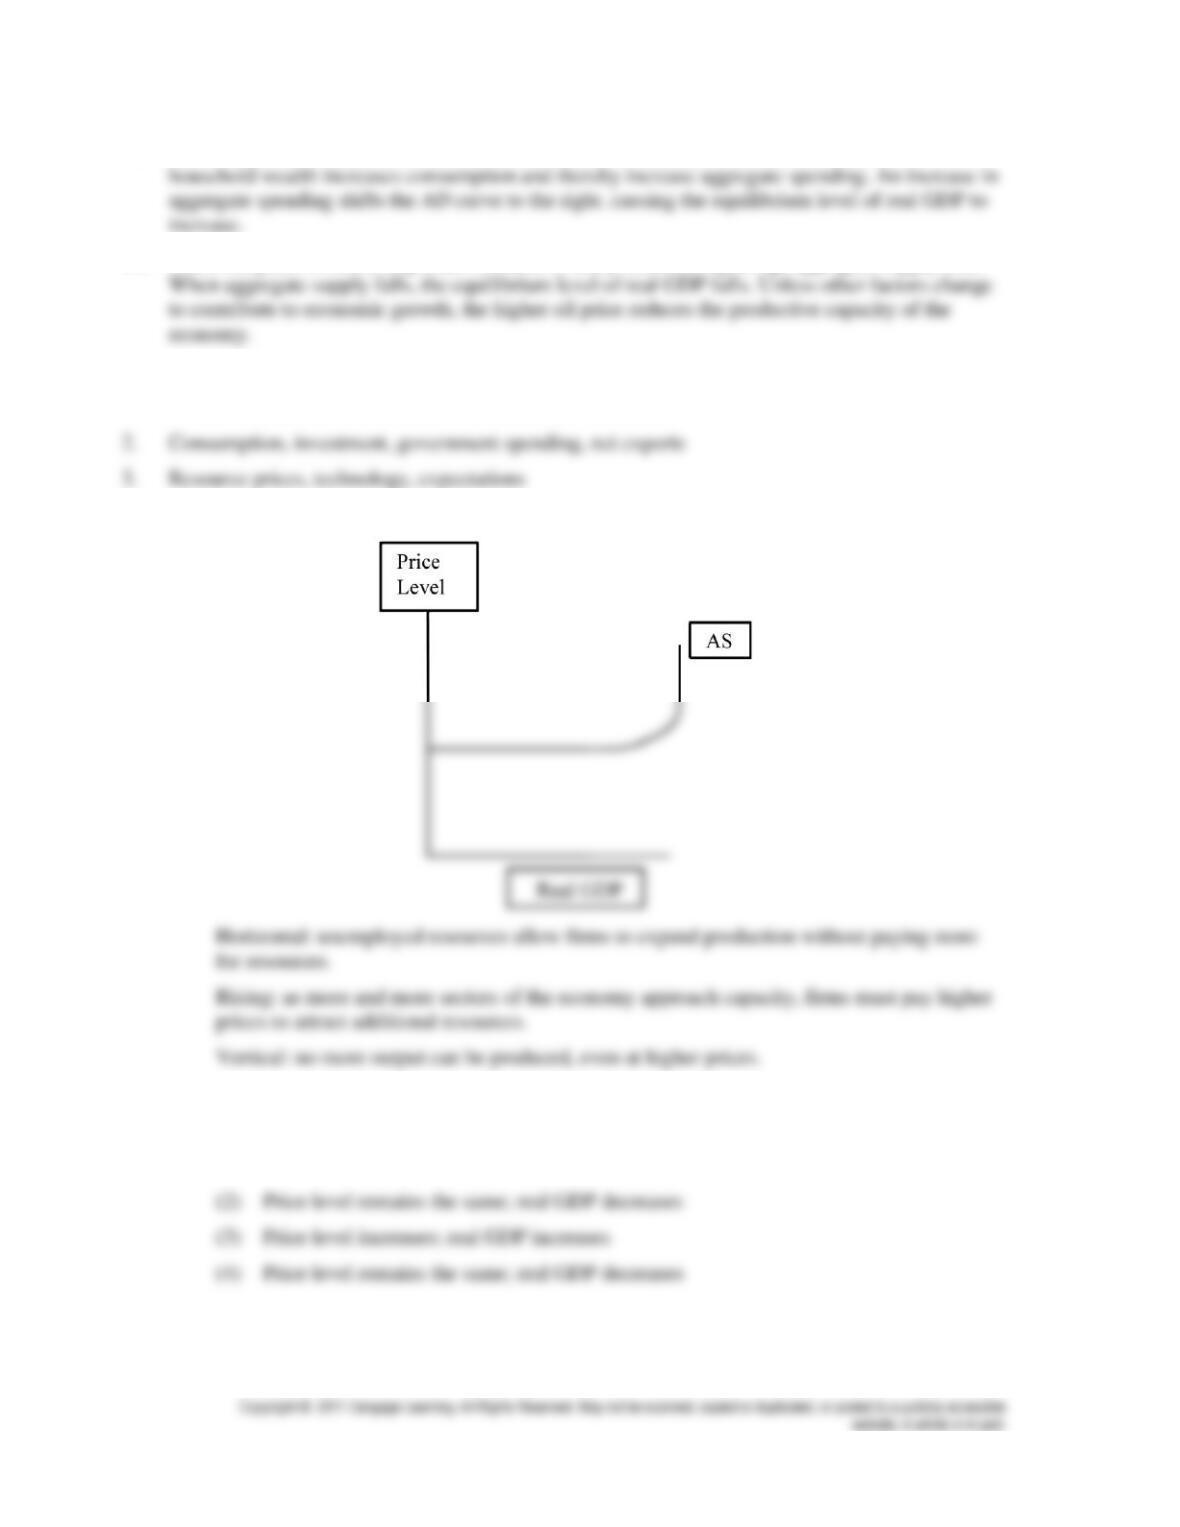
13. A horizontal
AS
has the price level fixed:
Chapter 8: Macroeconomic Equilibrium: Aggregate Demand and Supply 59
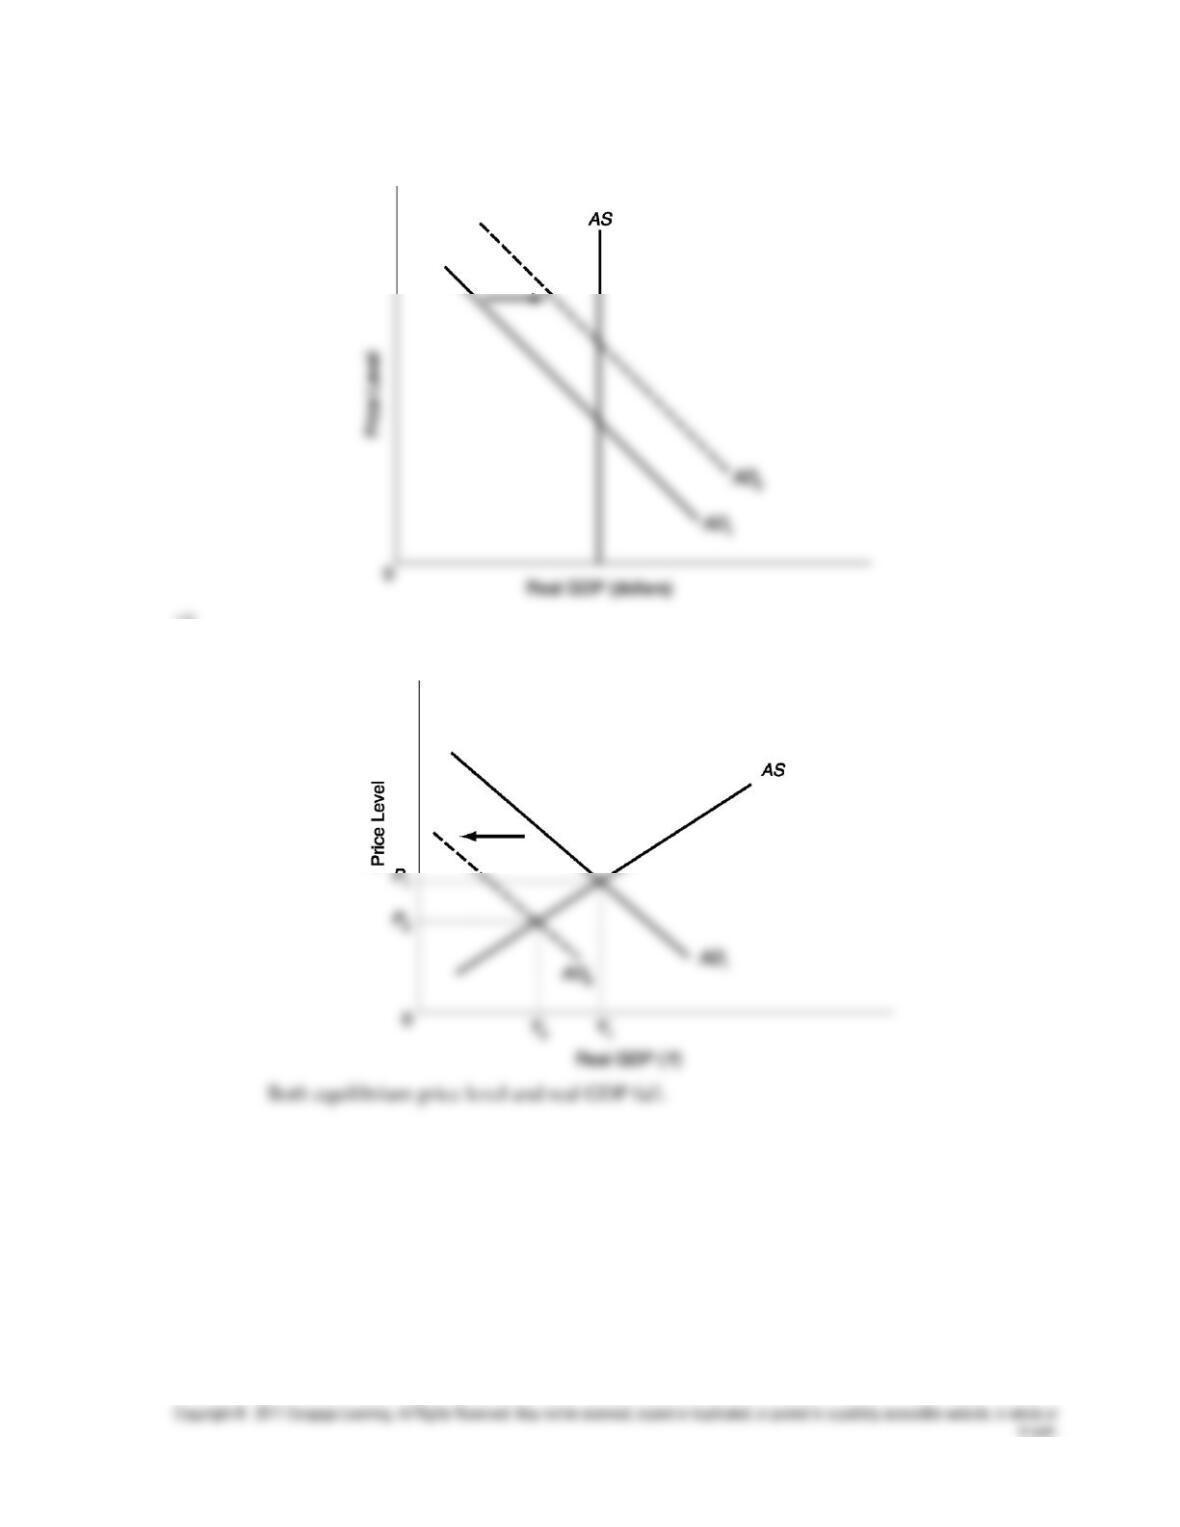
14. With a vertical
AS
curve, real GDP is unchanged:
15.
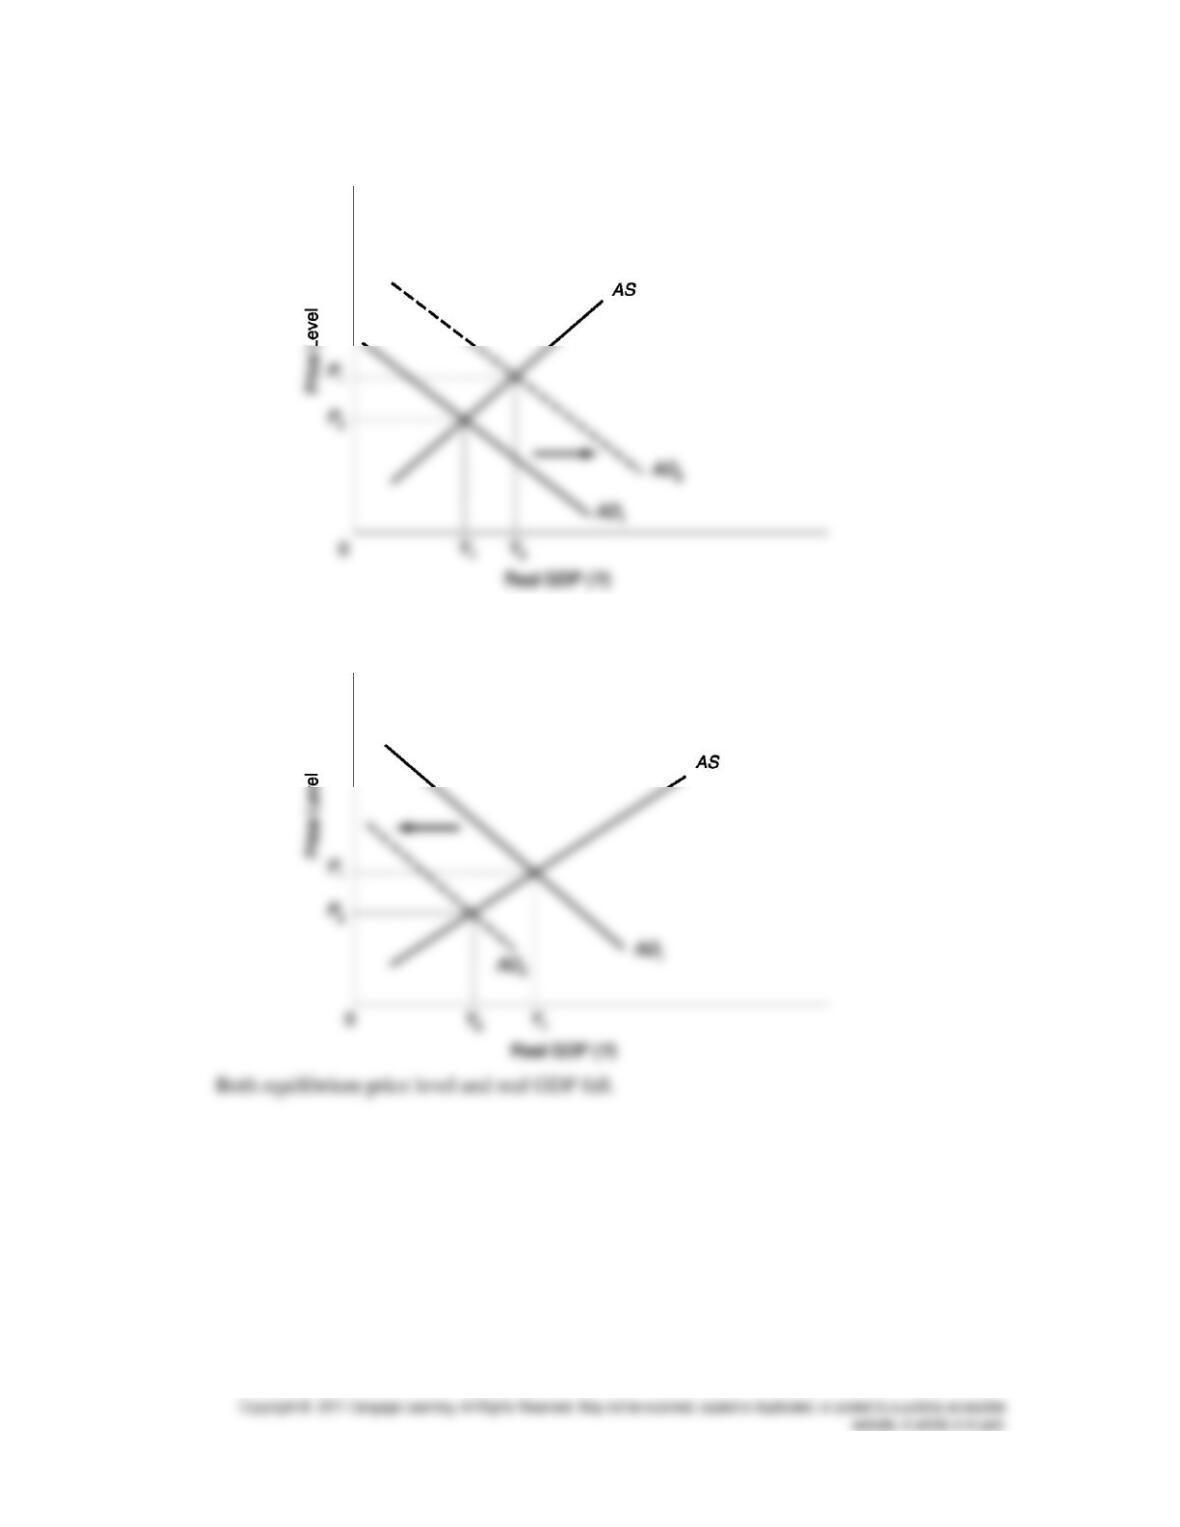
a. Consumption spending falls so
AD
falls:
60 Chapter 8: Macroeconomic Equilibrium: Aggregate Demand and Supply
b. Net exports rise so
AD
rises:
Both equilibrium price level and real GDP rise.
c. Net exports fall so
AD
falls:
Chapter 8: Macroeconomic Equilibrium: Aggregate Demand and Supply 61
d. Government spending increases so
AD
rises:
Both equilibrium price level and real GDP rise.
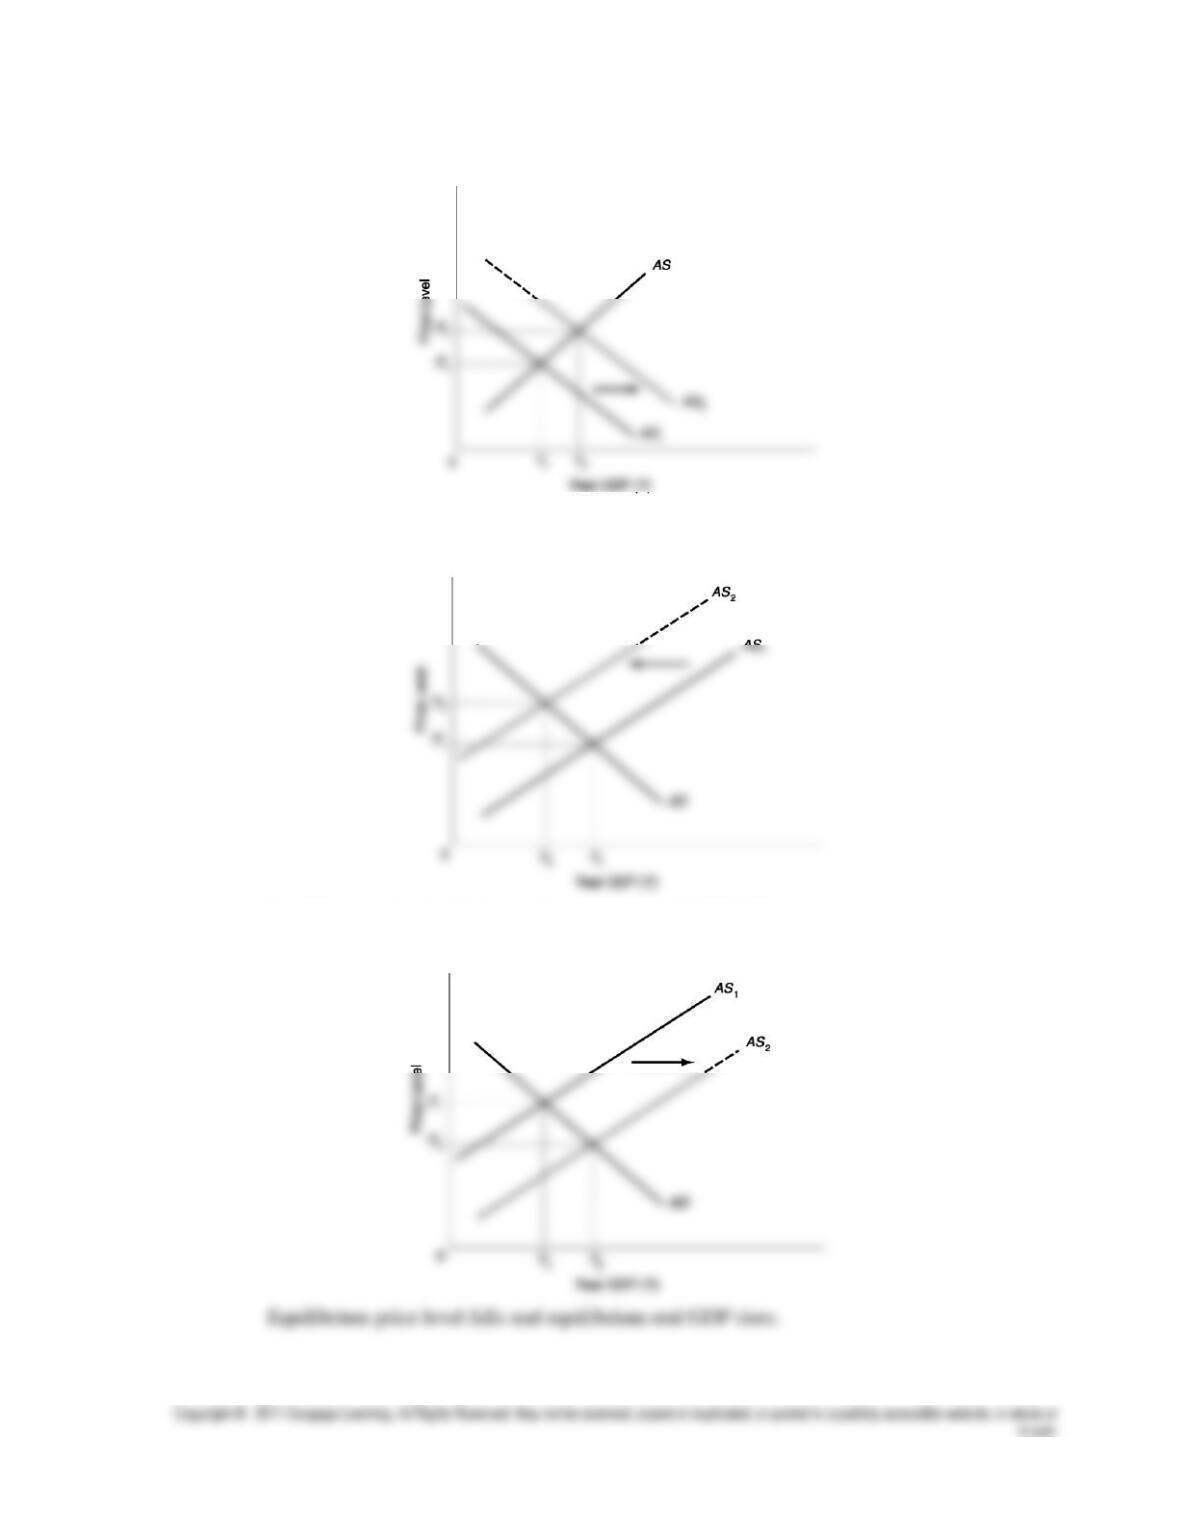
e. Higher wages shift
AS
to the left:
Equilibrium price level rises and equilibrium real GDP falls.
f. Technological advance shifts
AS
to the right:
62 Chapter 8: Macroeconomic Equilibrium: Aggregate Demand and Supply
16. As stock prices rise, the value of these assets increases household wealth. An increase in
17. When the price of oil, an important resource in many industries, goes up, aggregate supply falls.
ANSWERS TO STUDY GUIDE HOMEWORK
1. Wealth effect, interest rate effect, international trade effect
4.
5.
a.
(1) Price level increases; real GDP increases

Chapter 8: Macroeconomic Equilibrium: Aggregate Demand and Supply 63
b.
(1) Price level increases; real GDP remains the same
(2) Price level decreases; real GDP decreases
(3) Price level increases; real GDP remains the same
(4) Price level decreases; real GDP decreases
ACTIVE LEARNING EXERCISE
This is a brief exercise to help students condense the material on macroeconomic equilibrium into