
CHAPTER 8: BUSINESS CYCLES
LEARNING OBJECTIVES
I. Goals of Part III: Business Cycles and Macroeconomic Policy
A. What causes business cycles?
B. How should policymakers respond to cyclical fluctuations?
1. Classical economists see little need for government action
II. Goals of Chapter 8
A. Basic features of the business cycle
III. Notes to Sixth Edition Users
A. All data has been updated
Data Application
A major compendium of studies on the business cycle was produced by the NBER in
1986, The American Business Cycle: Continuity and Change, edited by Robert J.
Gordon, Chicago: University of Chicago Press. It contains general discussions of the
then-current state of knowledge of the business cycle, research on components of
expenditure and how they change over the cycle, discussions of the role of fiscal and
monetary policies, and research on how the cycle has changed over time.
TEACHING NOTES
I. What is a Business Cycle? (Sec. 8.1)
A. Research on cycles in the United States began in 1920 at the National
Bureau of Economic Research (NBER)
1. NBER maintains the business cycle chronology—a detailed history of
Business Cycles 129
B. Burns and Mitchell (Measuring Business Cycles, 1946) make five main points
about business cycles:
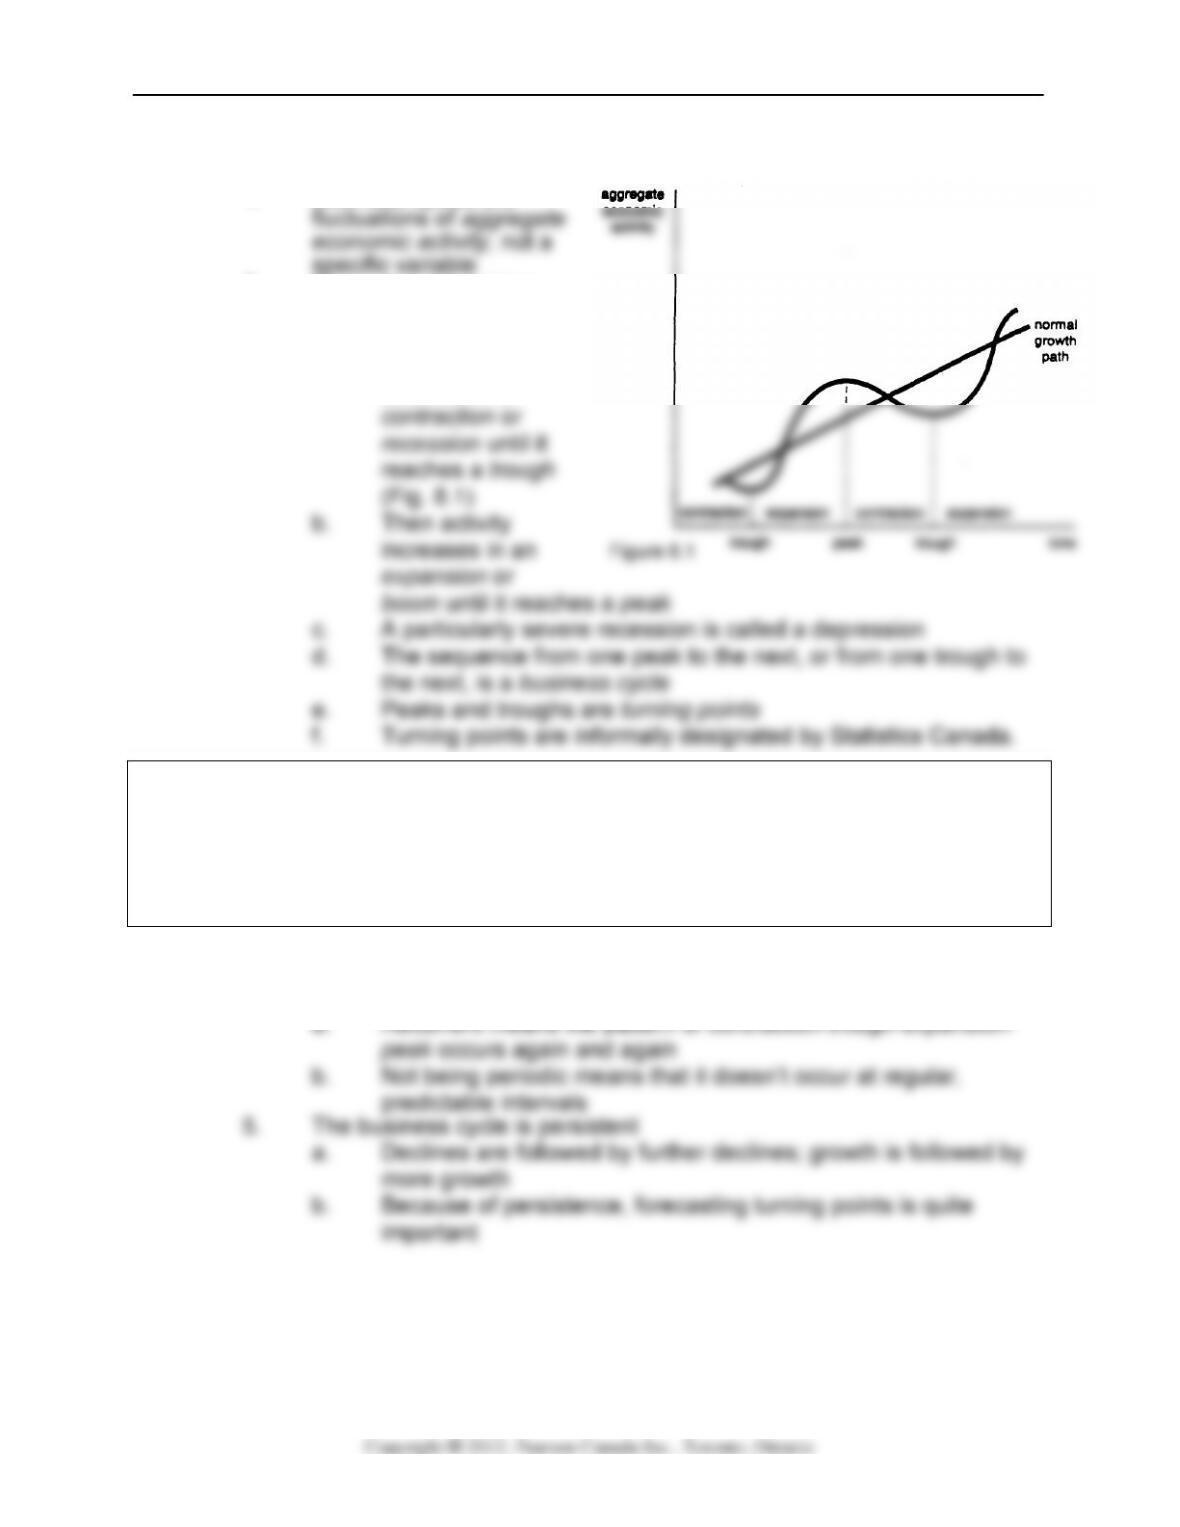
1. Business cycles are
2. There are expansions
and contractions
a. Aggregate
economic activity
declines in a
Data Application
Statistics Canada must wait for some time to pass before they can declare the start or
end of a recession. Since they need evidence on the growth in real GDP for at least two
consecutive quarters, and since there are lags in compiling quarterly growth figures, it
can take up to nine months after a recession has started before it is officially confirmed
by the data.
3. Economic variables show co-movement—they have regular and
predictable patterns of behaviour over the course of the business cycle
4. The business cycle is recurrent, but not periodic

130 Chapter 8
Theoretical Application
Should we even care about the business cycle? Robert Lucas doesn’t think so. In his
provocative book, Models of Business Cycles, Oxford: Basil Blackwell, 1987, he
suggests that the cost of business cycle instability since World War II is very low; in
particular, the cost is one-fifth the cost of having an inflation rate of 10%. So if faced
with the choice of eliminating all recessions and having a 105% inflation rate. or having
recessions the size we’ve had since 1945 and having no inflation at all, Lucas argues
we should take the latter. He suggests that we should move toward a microeconomic
view of the business cycle.
C. Box 8.1: The seasonal cycle and the business cycle
1. Output varies over the seasons: highest in the fourth quarter, lowest in
Data Application
New economic theories and statistical techniques may change somewhat the way in
which we look at data on the business cycle. The real business cycle (RBC) approach,
II. The Canadian Business Cycle: The Historical Record (Sec. 8.2)
A. Text Table 8.1 gives the business cycle chronology
B. The pre-World War I period
1873 to May 1879
C. The Great Depression and World War II
1. The worst economic contraction was the Great Depression of the
1930s
a. Real GDP fell over 30% from the peak in April 1929 to the

Business Cycles 131
(1) A contraction from April 1929 to March 1933, followed by
f. In 1939 the unemployment rate was over 14%
2. The Great Depression ended with the start of World War II
a. Wartime production brought the unemployment rate below 2%
b. Real GDP almost doubled between 1938 and 1944
D. Post-World War II Canadian business cycles
1. From 1945 to 1974 there were six mild contractions
2. The longest expansion on record was 160 months, from February 1961
to June 1974
3. Some economists thought the business cycle was dead
E. Have business cycles become less severe?
1. Economists believed that business cycles weren’t as bad after World
War II as they were before
2. The average contraction before 1929 last 20 months compared to 14
F. Are business cycles made in Canada?
1. How much of the business cycle is caused by country specific
influences relative to world influences?
2. While turning points in Canada and the United States are strongly
132 Chapter 8
III. Business Cycle Facts (Sec. 8.3)
A. All business cycles have features in common
B. The cyclical behaviour of economic variables—direction and timing
1. What direction does a variable move relative to aggregate economic
activity?
2. What is the timing of a variable’s movements relative to aggregate
economic activity?
3. A Closer Look 8.2—the index of leading indicators
a. A weighted average of ten variables that lead the business cycle
and are promptly reported
b. Developed by Statistics Canada
Data Application
Economists can gain valuable information about future real economic growth from the
bond market. In particular, Campbell Harvey in his article “The Relation between the
Term Structure of Interest Rates and Canadian Economic Growth”, Canadian Journal of
Economics, February 1997, pp. 169-93, shows that the slope of the term structure of
interest rates in Canada can predict Canadian real economic growth.
C. Cyclical behaviour of key macroeconomic variables: direction and timing (text
Figs. 8.4–8.12)

Business Cycles 133
1. Procyclical
a. Coincident: industrial production, consumption, business fixed
d. Timing not designated: government purchases
Analytical Problem 2 looks at whether output or total hours worked is more volatile,
given that average labour productivity is procyclical.
2. Countercyclical: unemployment (timing is coincident)
Analytical Problem 1 asks for an explanation of why expenditures on durable goods are
more volatile over the business cycle than expenditures on nondurables and services.
IV. Business Cycle Analysis: A Preview (Sec. 8.4)
A. What explains business cycle fluctuations?
1. Two major components of business cycle theories
a. A description of the shocks
B. Aggregate demand and aggregate supply: a brief introduction
1. The model (along with the building block IS-LM model) will be
developed in chapters 9-12
2. The model has three main components; all plotted in (P, Y) space
a. aggregate demand curve
3. Aggregate demand curve
a. Shows quantity of goods and services demanded (Y) for any

134 Chapter 8
4. Aggregate supply curve
a. The aggregate supply curve shows how much output producers
are willing to supply at any given price level
b. The short-run aggregate supply curve is horizontal; prices are
C. Aggregate demand shocks
1. An aggregate demand shock is a change that shifts the aggregate
demand curve
2. Example: A negative aggregate
demand shock (Fig. 8.3; like text
Fig. 8.14)
a. The aggregate demand
curve shifts left
b. Short-run equilibrium
3. How long does it take to get to the long run?
a. Classical theory: prices adjust rapidly
(1) So recessions are short-lived

Business Cycles 135
D. Aggregate supply shocks
1. Classicals view aggregate supply shocks as the main cause of
fluctuations in output
changes in productivity or labour supply
2. Example: A negative aggregate supply shock (Fig. 8.4, like text Fig.
8.15)
a. Initial long-run equilibrium at
intersection of LRAS1 and
AD, with full–employment
output level 1,
price level
3. Keynesians also recognize the importance of supply shocks; their
views are discussed further in chapter 12
Analytical Problem 3 asks students to use the AD-AS model to explain whether the
1973-1975 recession was a result of a supply shock or a demand shock
Policy Application

136 Chapter 8
ADDITIONAL ISSUES FOR CLASSROOM DISCUSSION
1. When Real GDP Declines Two Straight Quarters, Does a Recession Occur?
A rule of thumb in the financial markets is that a recession occurs whenever real GDP
declines for two quarters in a row. However this is not a perfect measure. The
economists at Statistics Canada who determine whether a peak or a trough has
occurred look at many variables in determining the turning points of the business cycle.
Why do they look at factors beyond real GDP?
Real GDP is an important factor in identifying business cycle turning points. Although in
2. Do Recessions Have Any Positive Economic Effects?
Recessions by their very nature cause hardship. People are laid off. New entrants to the
labour force have difficulty finding jobs. Consumers’ disposable income declines.
Business failures increase. Do recessions have any positive contributions to make to
the economic life of a nation?
Recessions often cause consumers and managers to reassess their current practices.
When sales and profits drop, companies look carefully at their operations to discover
ways to cut costs and improve their products. In periods of expansion, it’s easy to relax
one’s vigilance, since profits usually are earned even when a company’s product is not
Business Cycles 137
ANSWERS TO TEXTBOOK PROBLEMS
Review Questions
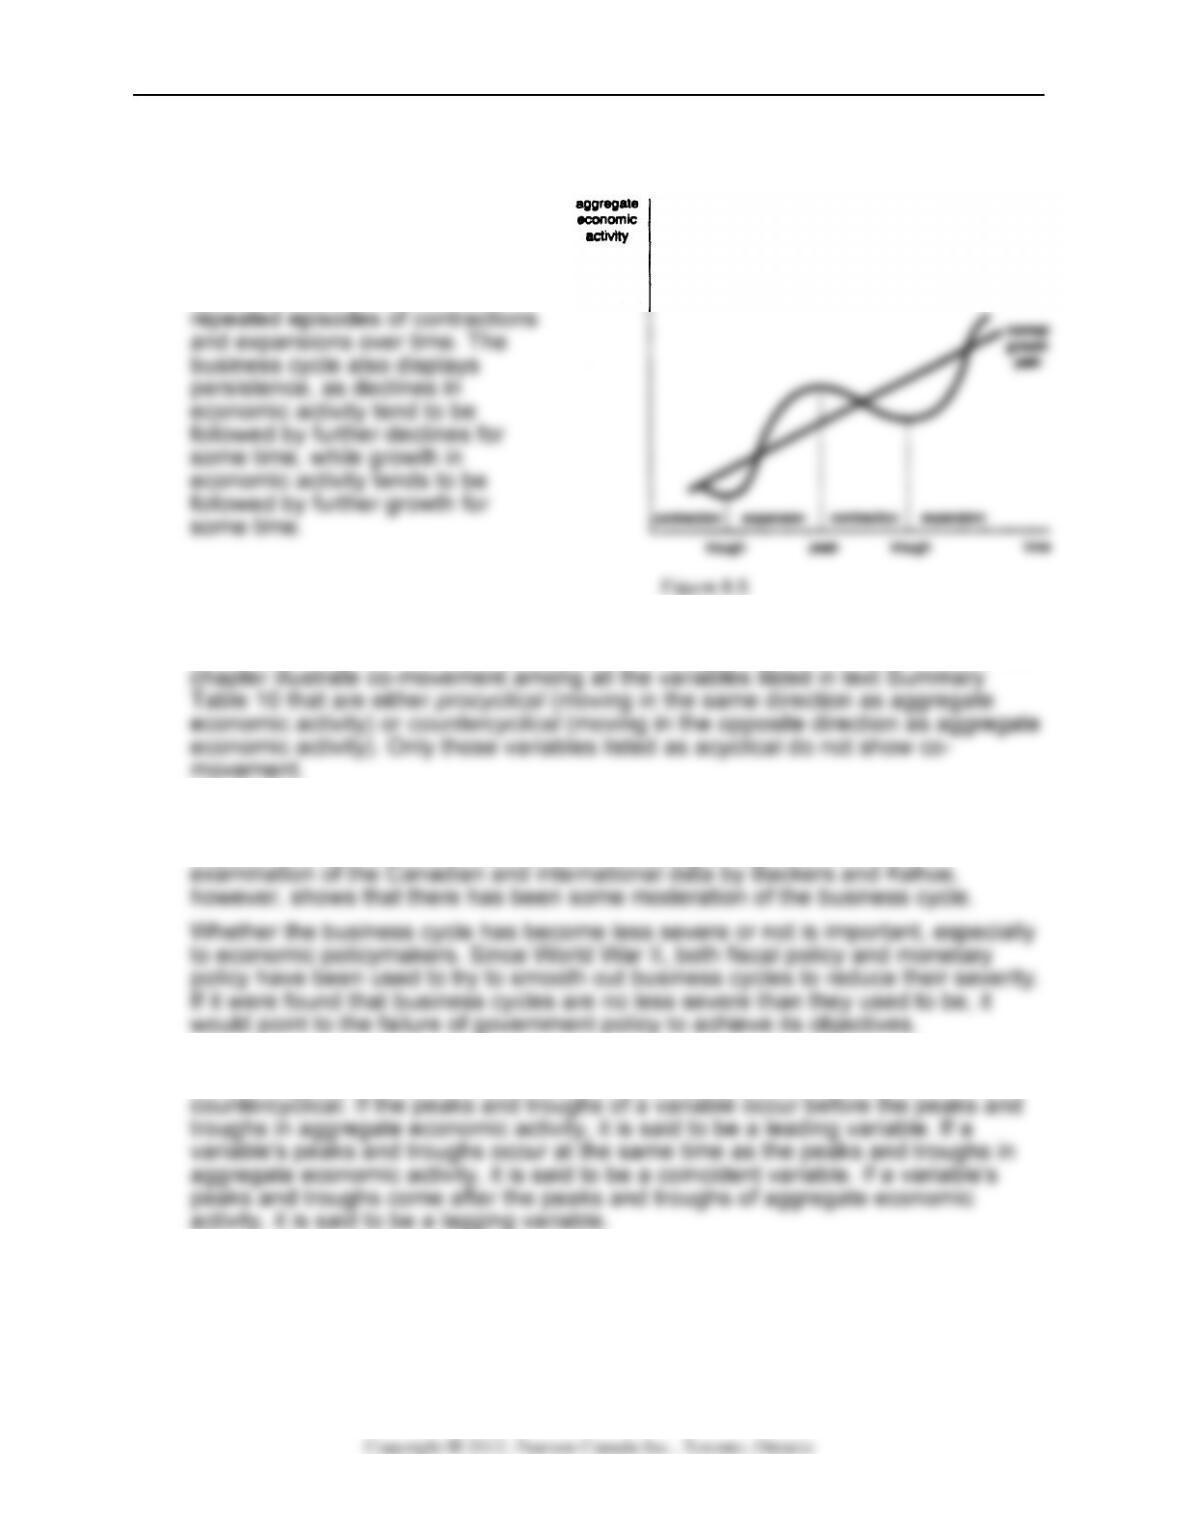
1. Figure 8.5 illustrates both the
recurrence and persistence of the
business cycle. The business
cycle is recurrent, as there are
2. Co-movement means that many economic variables move together in a
predictable way over the business cycle. The business cycle facts presented in the
3. There is some question as to whether or not the business cycle has become less
volatile over time. Originally it was thought that the cycle had been moderated,
especially since World War II, but Romer challenged this notion. Further
4. A variable that moves in the same direction as aggregate economic activity is said
to be procyclical, while a variable that moves in the opposite direction is
5. If the economy is entering a recession, you’d expect production, investment,
average labour productivity, and the real wage to decline because they are all
procyclical, and the unemployment rate to rise because it’s countercyclical.

138 Chapter 8
6. The fact that some economic variables are known to lead the business cycle is
7. The two components of a theory of business cycles are: (1) A description of the
8. Keynesians and classicals differ sharply in their beliefs about how long it takes the
economy to reach a long-run equilibrium. Classical economists believe that prices
adjust rapidly (within a few months) to restore equilibrium in the face of a shock,
while Keynesians believe that prices adjust slowly, taking perhaps several years.
Analytical Problems
1. Expenditure on durable goods is more sensitive to the business cycle than
expenditure on nondurable goods and services, because people can more easily
change the timing of their expenditure on durables. When economic activity is
2. In symbols, let A = average labour productivity, Y = output, and H = total hours
worked. By definition, A = Y / H, so in growth terms, ΔA/A = ΔY/Y – ΔH/H. Since all
three are procyclical, they all move in the same direction over the business cycle. If
Business Cycles 139
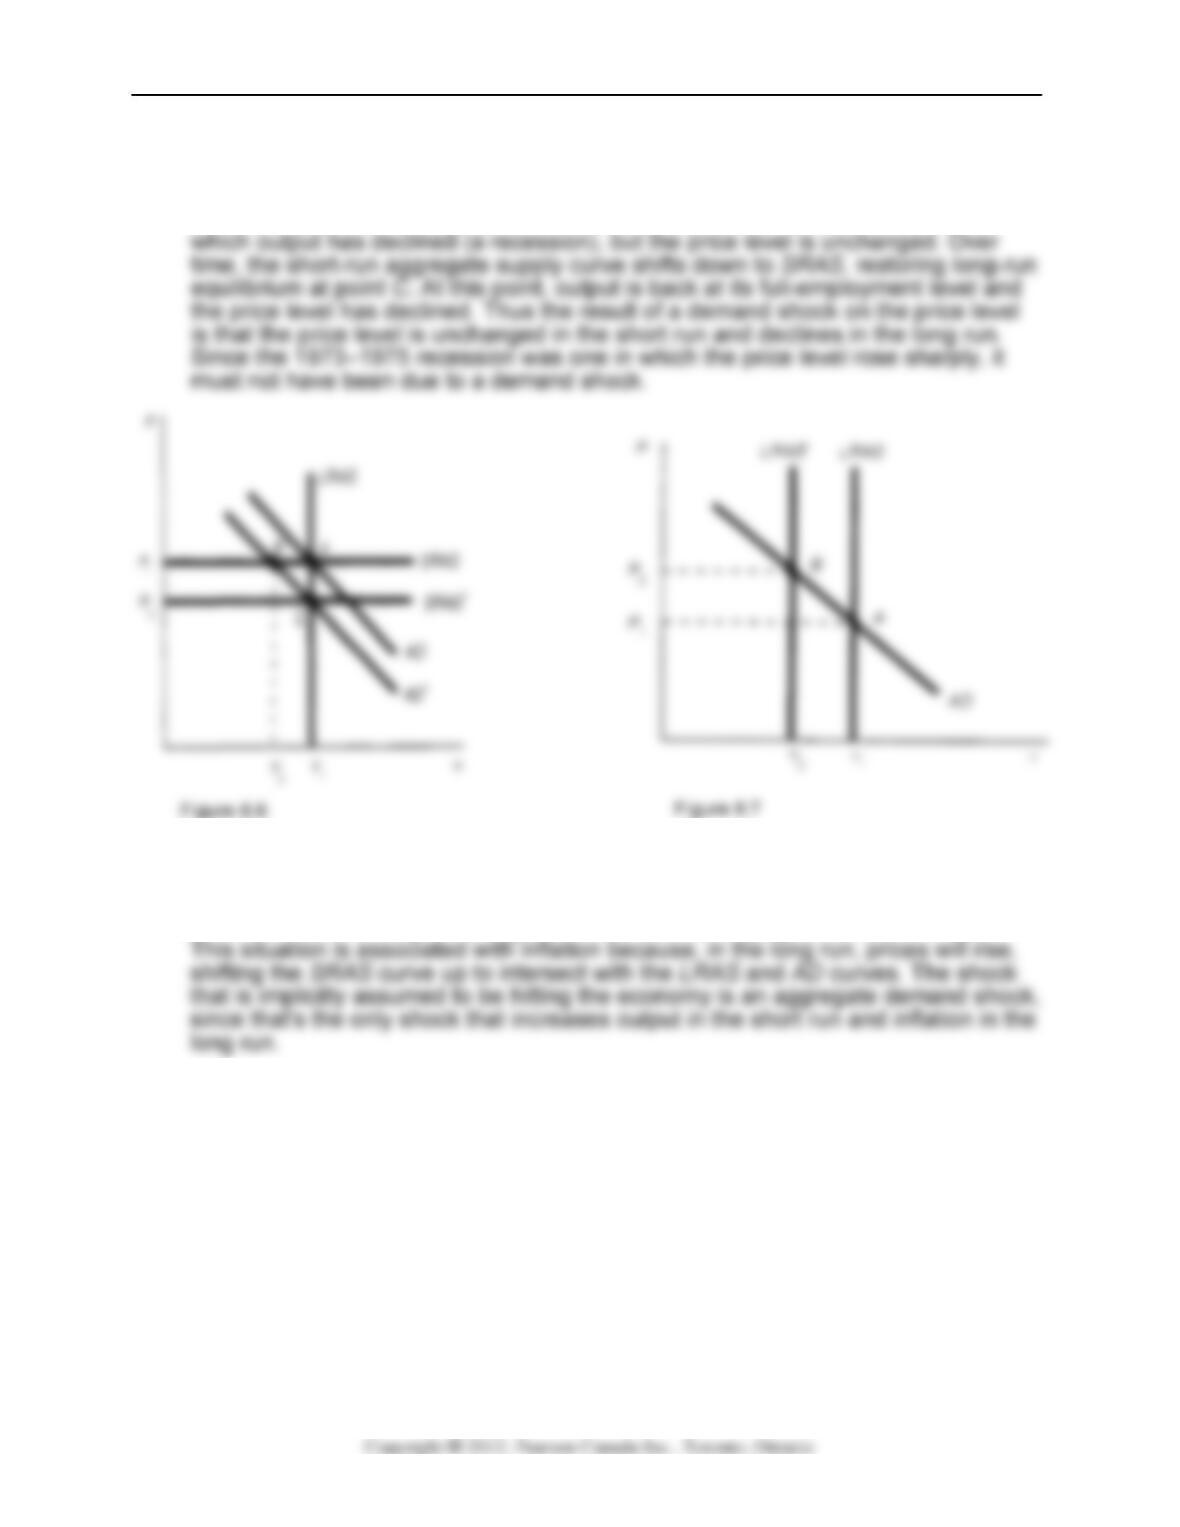
3. Figure 8.6 illustrates the effects of a demand shock. The economy begins in
equilibrium at point A, where the LRAS, SRAS, and AD curves intersect. The
demand shock shifts the aggregate demand curve to the left to AD’. In the short
run, the equilibrium is at point B, where AD’ intersects SRAS. This is a point at
4. Growth that is “too rapid” most likely refers to a situation in which the aggregate
demand curve has shifted to the right and, in the short run, intersects the SRAS
curve at a level of output that’s greater than the full–employment level of output.