216 Chapter 8
C. Because fixed costs do not vary with respect to changes in the number of books sold,
they should be ignored. Variable costs per copy are $92, but note that $25 of this cost
P8.7 Cost Elasticity. Power Brokers, Inc. (PBI), a discount brokerage firm, is contemplating
opening a new regional office in Providence, Rhode Island. An accounting cost analysis
of monthly operating costs at a dozen of its regional outlets reveals average fixed costs
of $4,500 per month and average variable costs of
A typical stock or bond trade results in $100 gross commission income, with PBI
paying 35% of this amount to its sales representatives.
A. Estimate the trade volume necessary for PBI to reach a target return of $7,500 per
month for a typical office.
B. Estimate and interpret the elasticity of cost with respect to output at the trade
volume found in part A.
P8.7 SOLUTION
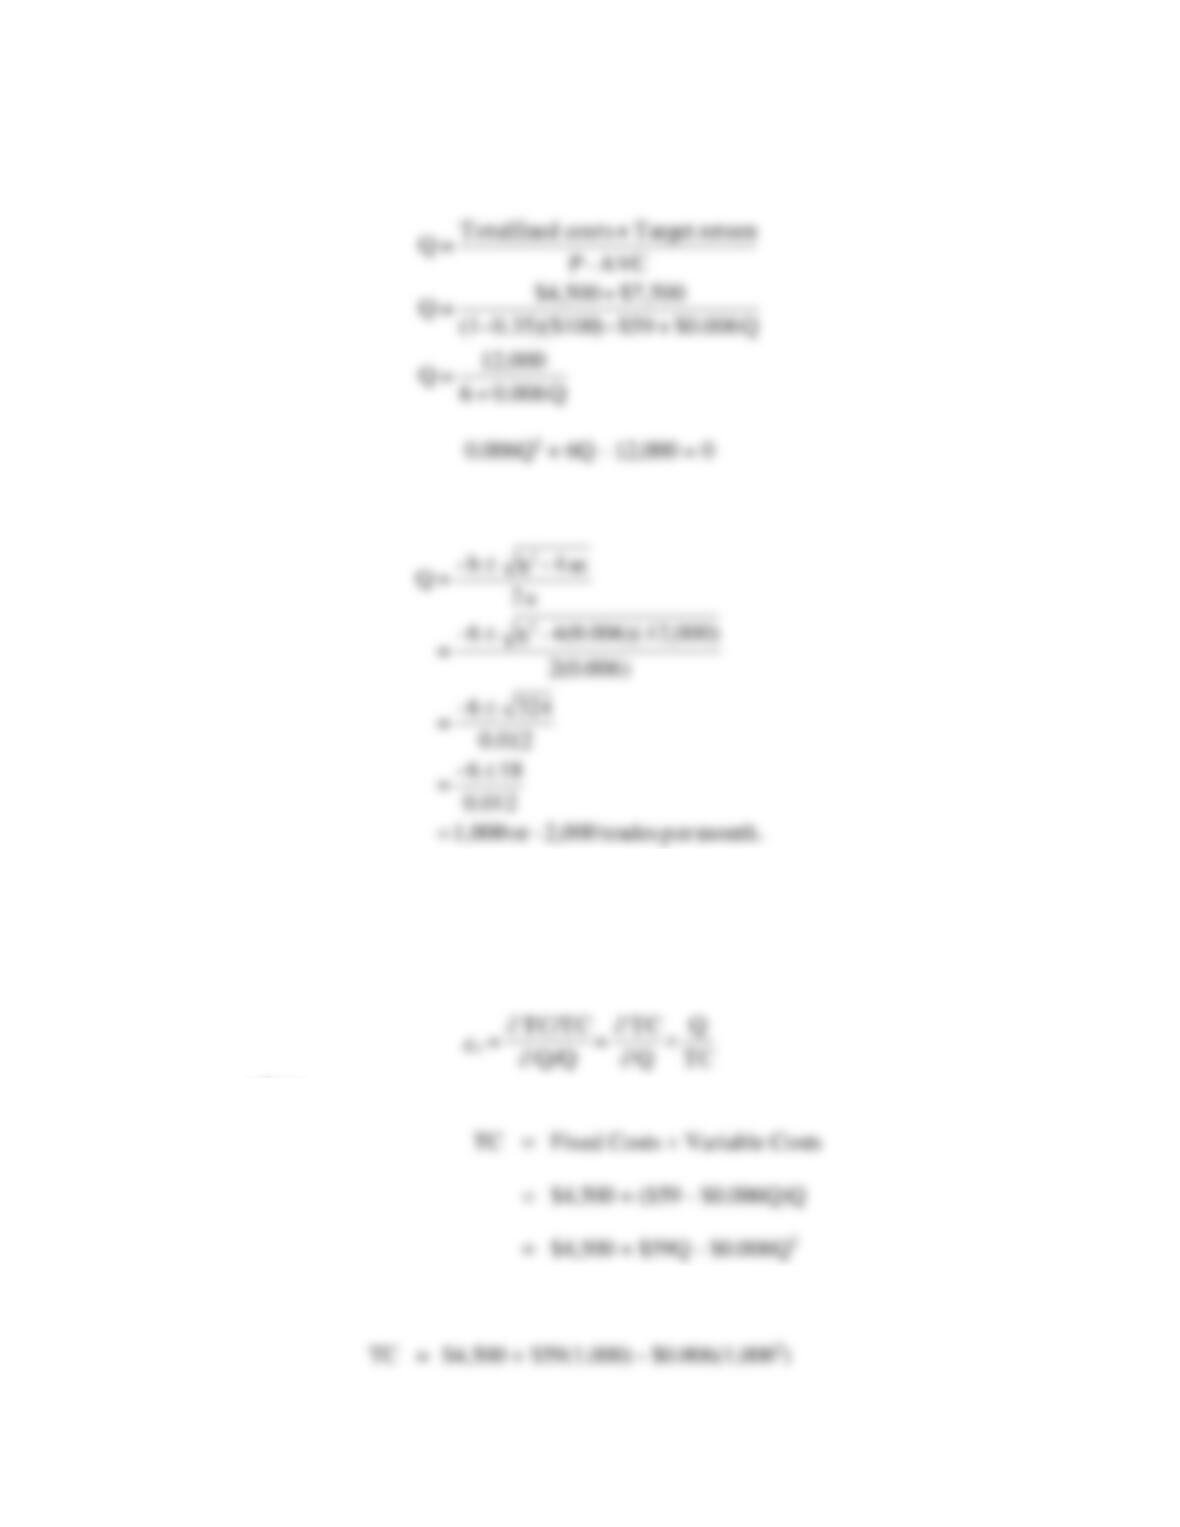
A. To earn a target return of $7,500 per month, Power Brokers must generate sufficient
Cost Analysis and Estimation 217
which can be solved using the quadratic formula where a = 0.006, b = 6 and c = -12,000,
Since -2,000 is an infeasible negative output, an activity level of 1,000 trades per month
would allow Power Brokers to meet its target return.
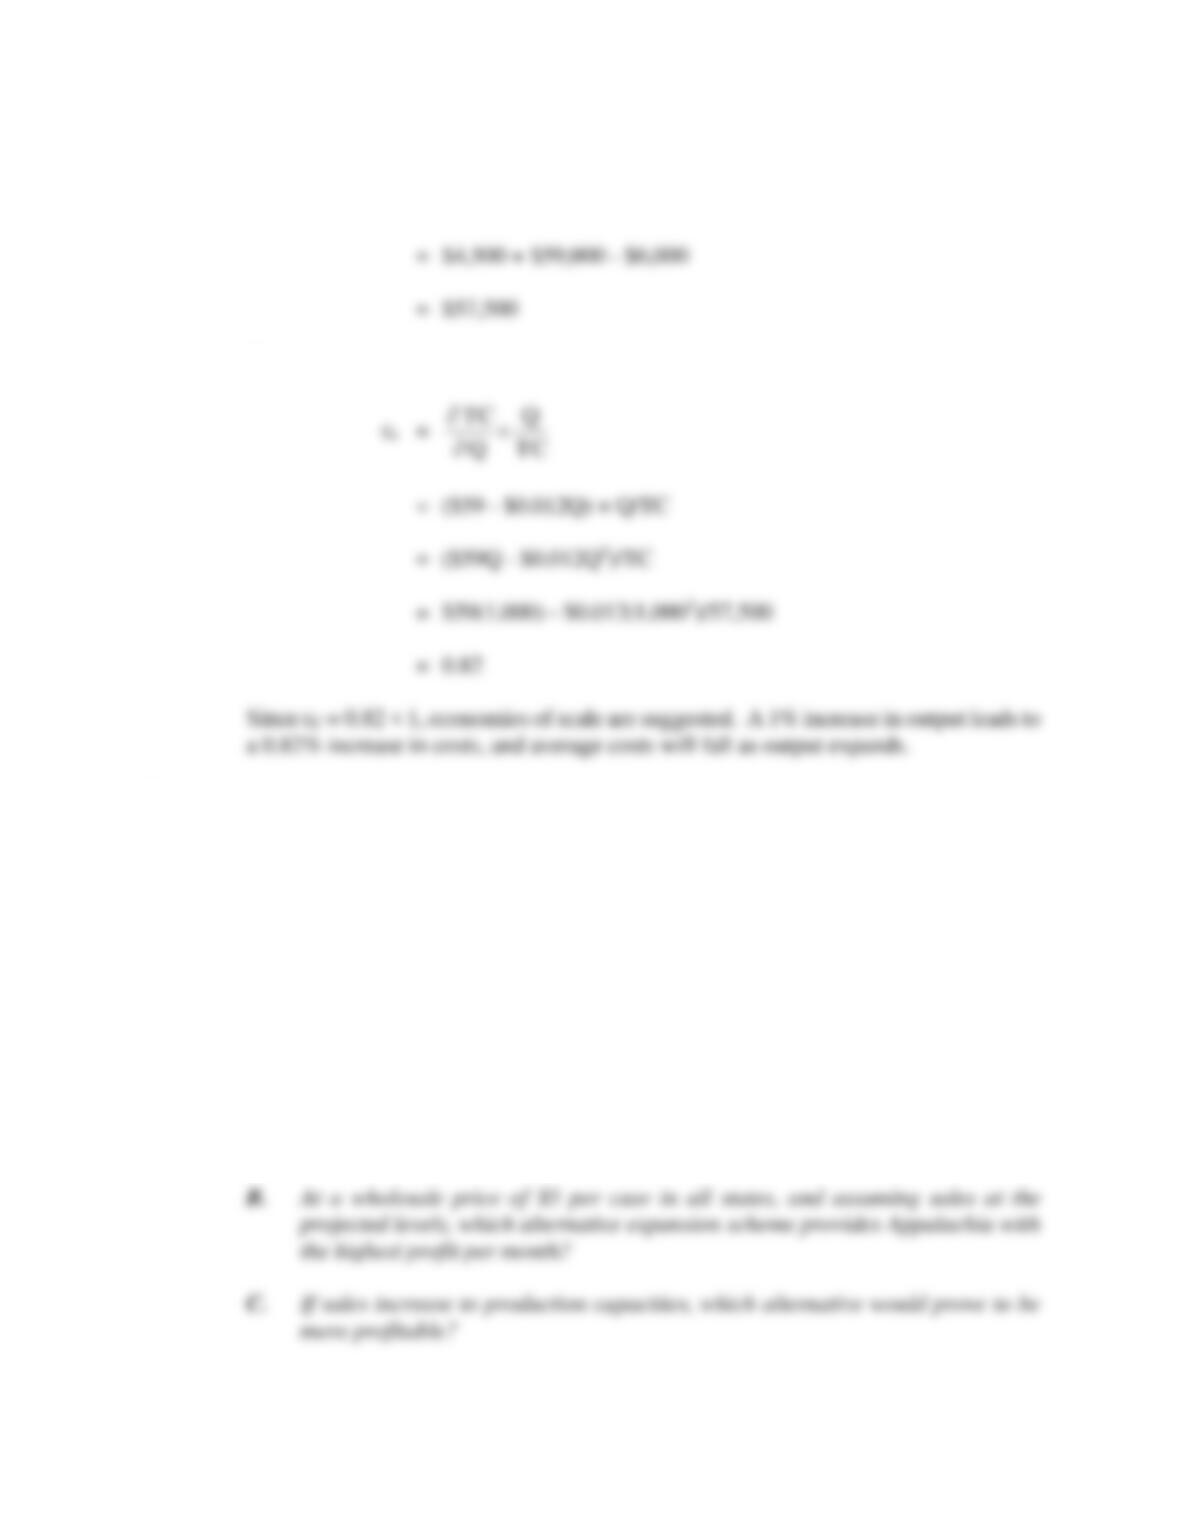
B. By definition,
where
At Q = 1,000,
218 Chapter 8
Therefore, at Q = 1,000
P8.8 Multiplant Operation. Appalachia Beverage Company, Inc. is considering alternative
proposals for expansion into the Midwest. Alternative 1: Construct a single plant in
Indianapolis, Indiana, with a monthly production capacity of 300,000 cases, a monthly
fixed cost of $262,500, and a variable cost of $3.25 per case. Alternative 2: Construct
three plants, one each in Muncie, Indiana; Normal, Illinois; and Dayton, Ohio, with
capacities of 120,000, 100,000, and 80,000, respectively, and monthly fixed costs of
$120,000, $110,000, and $95,000 each. Variable costs would be only $3 per case
because of lower distribution costs. To achieve these cost savings, sales from each
smaller plant would be limited to demand within its home state. The total estimated
monthly sales volume of 200,000 cases in these three Midwestern states is distributed as
follows: 80,000 cases in Indiana, 70,000 cases in Illinois, and 50,000 cases in Ohio.
A. Assuming a wholesale price of $5 per case, calculate the breakeven output
quantities for each alternative.
Cost Analysis and Estimation 219
P8.8 SOLUTION
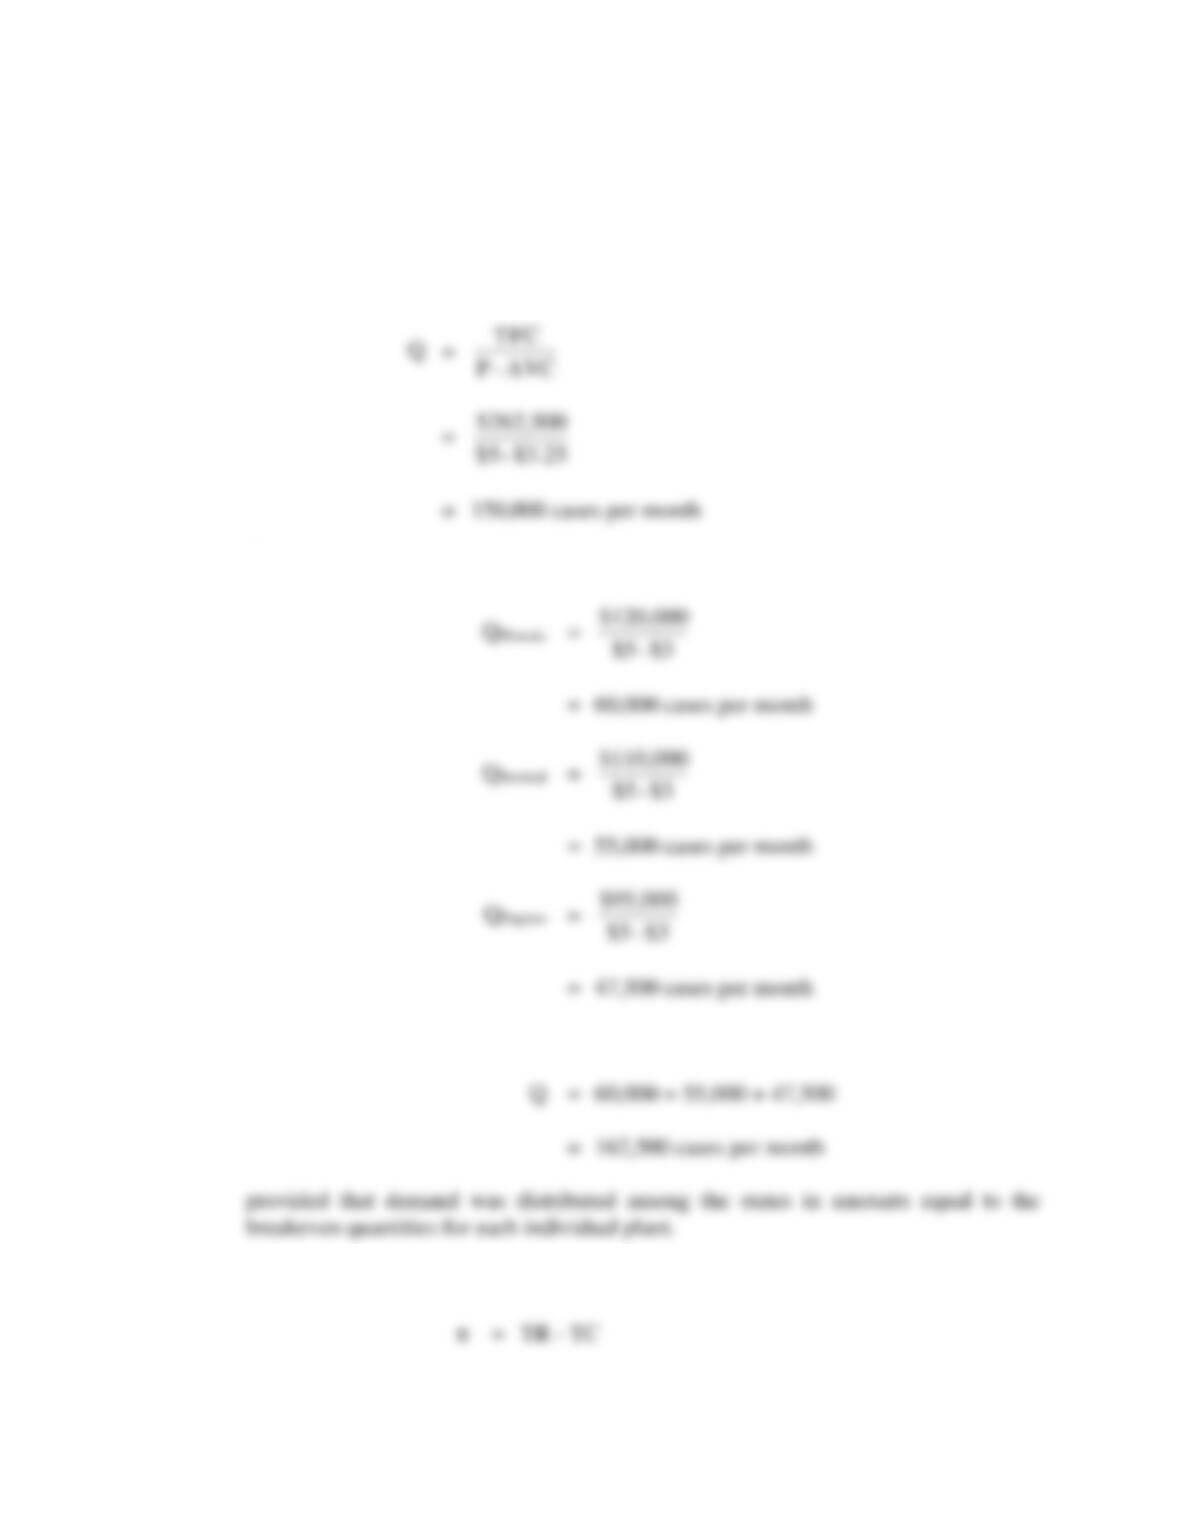
A. The breakeven output quantity for the single plant alternative is:
The breakeven output quantities for the multiple plant alternative is:
Thus, the firm-level breakeven quantity for the multiple plant alternative is:
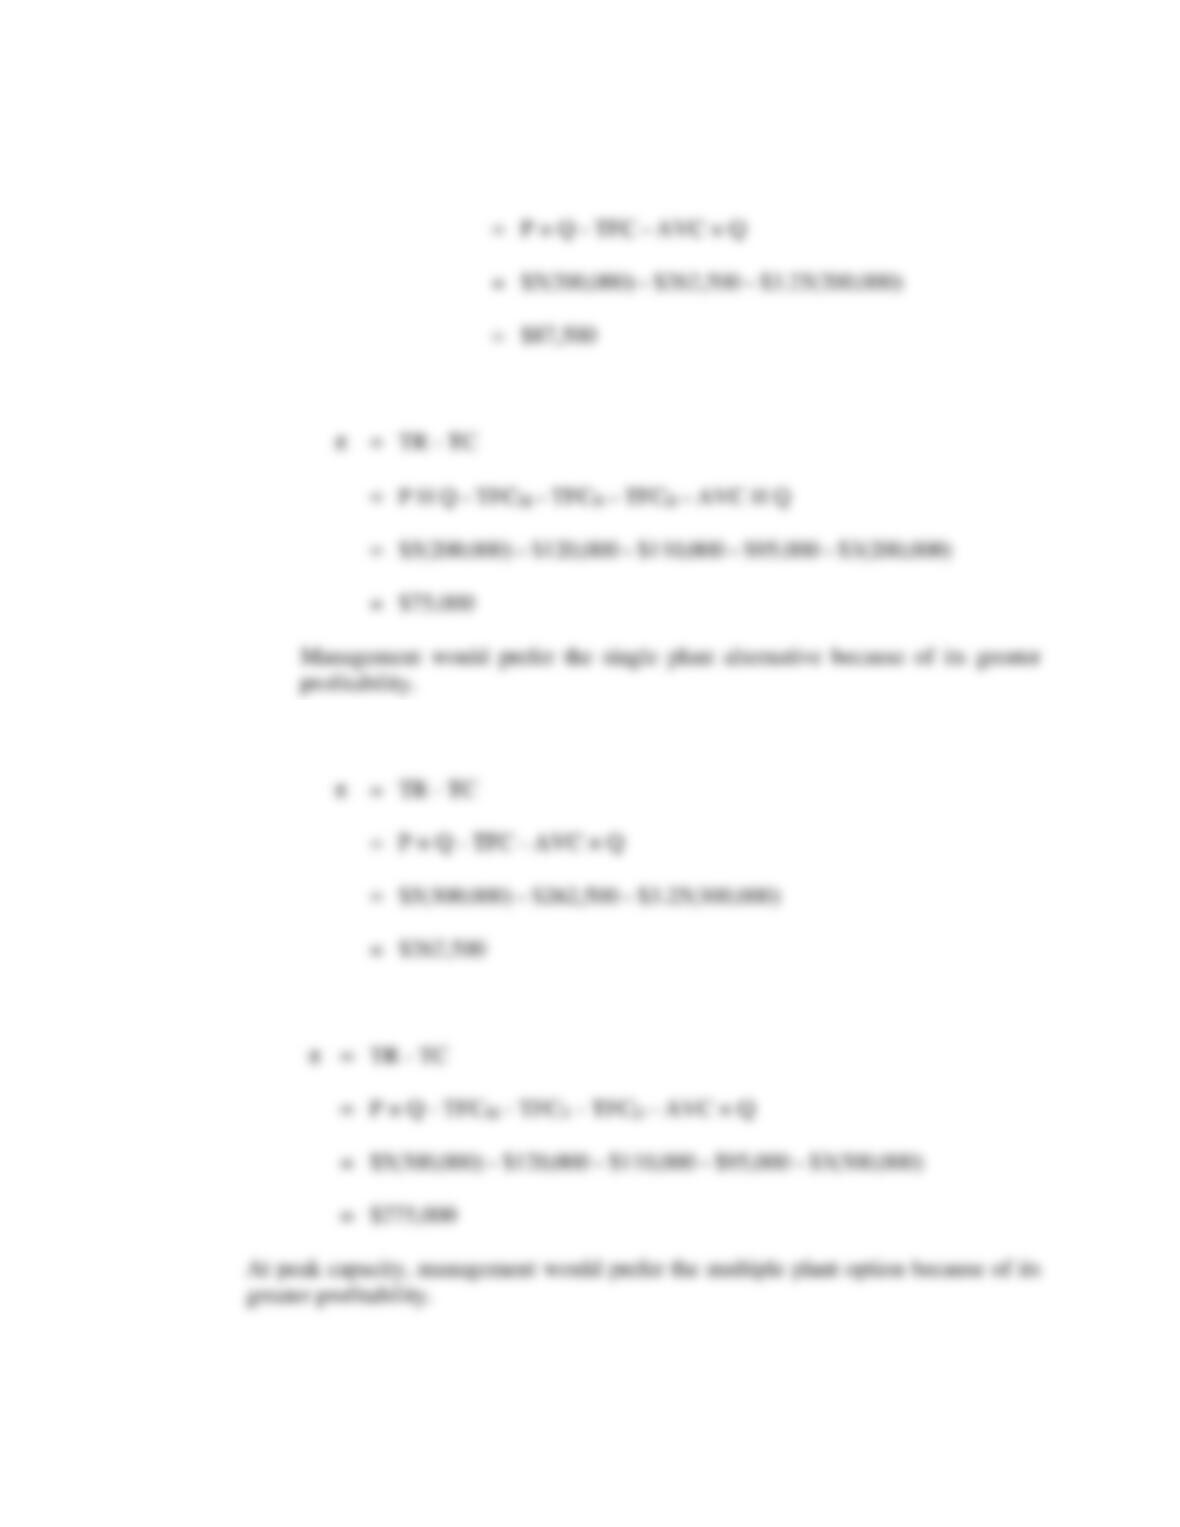
B. Single plant alternative:
220 Chapter 8
Multiple plant alternative:
C. Single plant at full capacity:
Multiple plants at full capacity:
P8.9 Learning Curves. The St. Thomas Winery plans to open a new production facility in the
Napa Valley of California. Based on information provided by the accounting

Cost Analysis and Estimation 221
department, the company estimates fixed costs of $250,000 per year and average
variable costs of
AVC = $10 + $0.01Q
where AVC is average variable cost (in dollars) and Q is output measured in cases of
output per year.
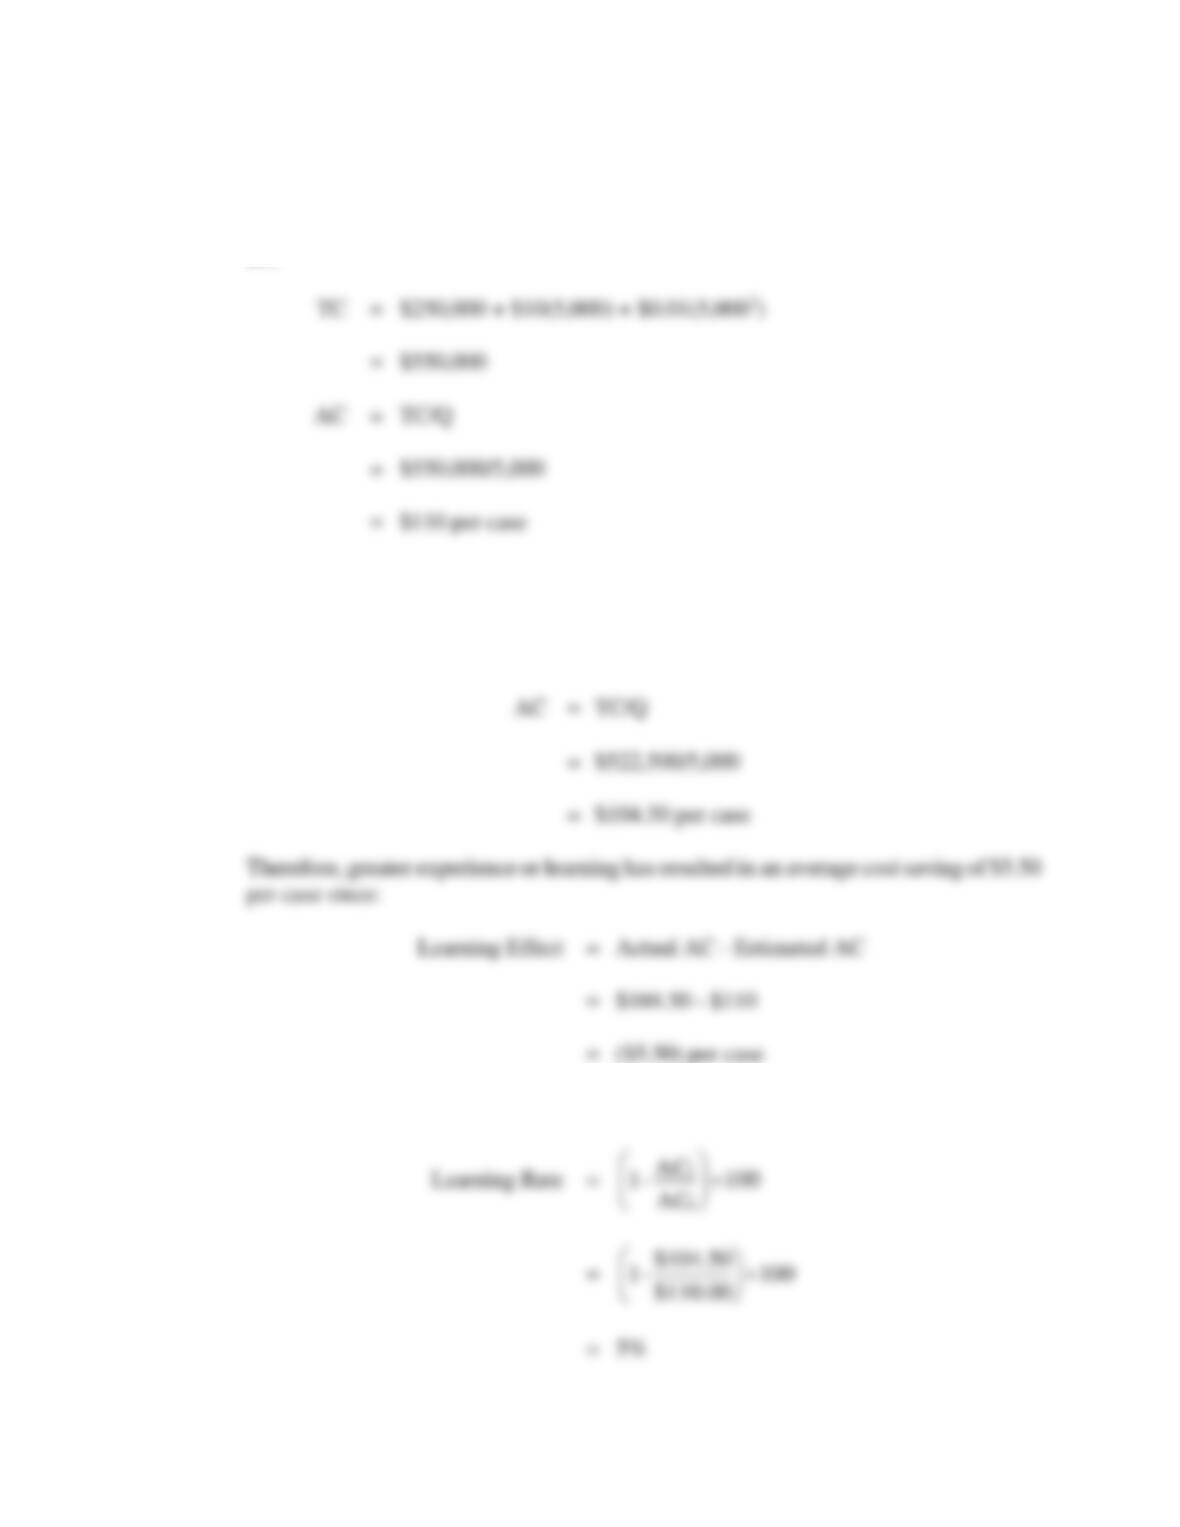
A. Estimate total cost and average total cost for the coming year at a projected
volume of 4,000 cases.
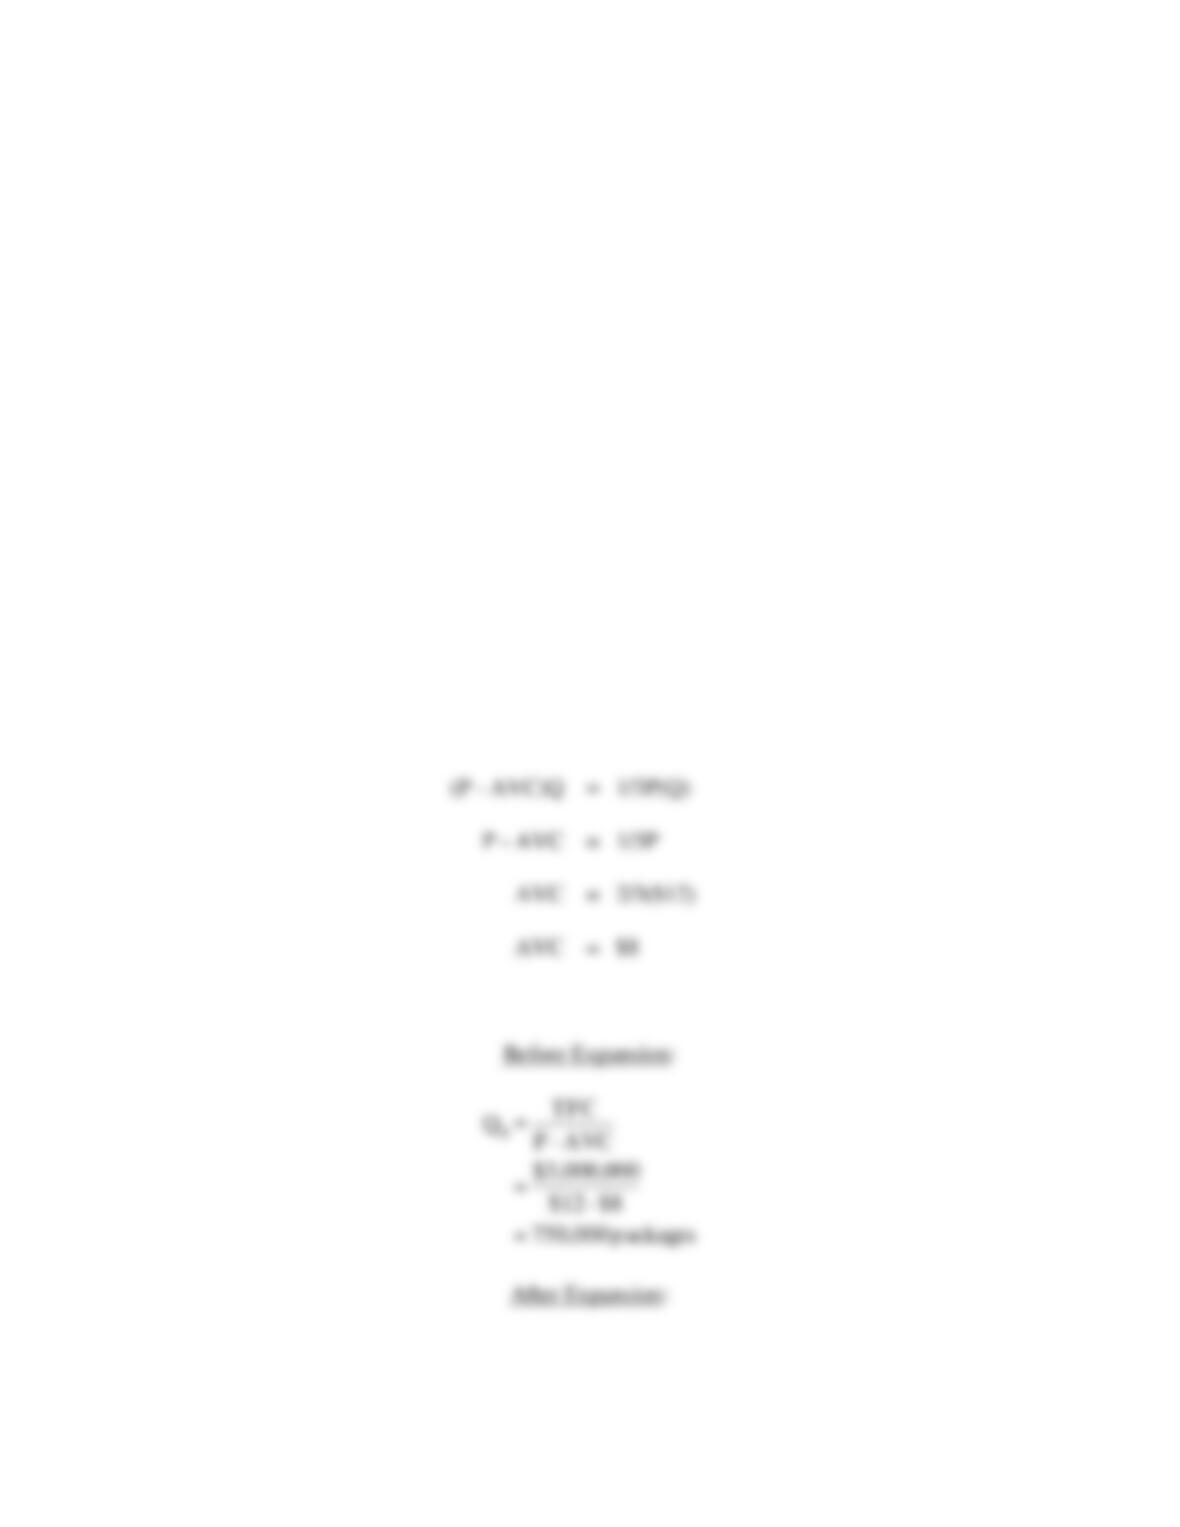
B. An increase in worker productivity because of greater experience or learning
during the course of the year resulted in a substantial cost saving for the company.
Estimate the effect of learning on average total cost if actual total cost was
$522,500 at an actual volume of 5,000 cases.
P8.9 SOLUTION
A. The total variable cost function for the coming year is:
Estimated average cost is:
222 Chapter 8
B. Without learning, estimated total cost and average total cost at a volume of 5,000 cases
are:
Since estimated average cost without learning falls between 4,000 and 5,000 units (see
part A), the company is operating in a range of economies of scale.
If actual total costs were $522,500 at a volume of 5,000 cases, actual average total
costs were:
Alternatively,
Cost Analysis and Estimation 223
P8.10 Degree of Operating Leverage. Untouchable Package Service (UPS) offers overnight
package delivery to Canadian business customers. UPS has recently decided to expand
its facilities to better satisfy current and projected demand. Current volume totals two
million packages per week at a price of $12 each, and average variable costs are
constant at all output levels. Fixed costs are $3 million per week, and profit
contribution averages one-third of revenues on each delivery. After completion of the
expansion project, fixed costs will double, but variable costs will decline by 25%.
A. Calculate the change in UPS’s weekly breakeven output level that is due to
expansion.
B. Assuming that volume remains at two million packages per week, calculate the
change in the degree of operating leverage that is due to expansion.
C. Again assuming that volume remains at two million packages per week, what is
the effect of expansion on weekly profit?
P8.10 SOLUTION
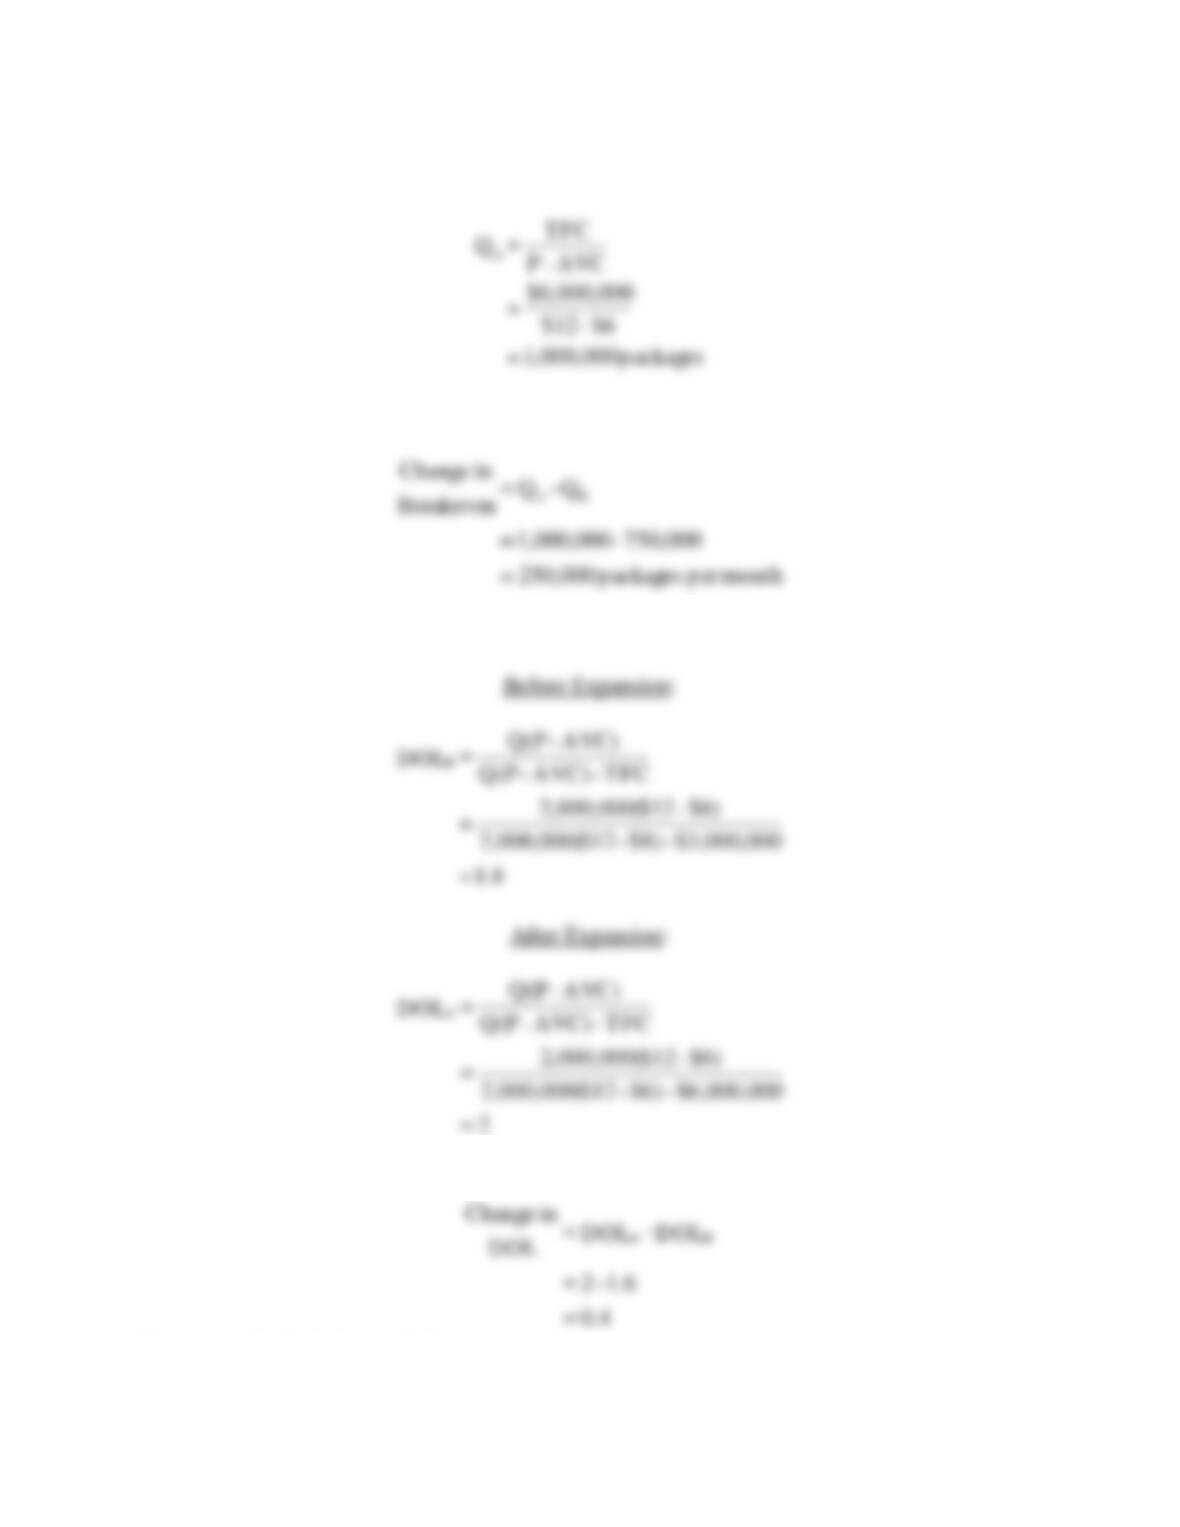
A. Average variable costs are $8 since:
Therefore, the breakeven levels of output before and after expansion are:
224 Chapter 8
The change in the weekly breakeven output level due to expansion is:
B. The degrees of operating leverage before and after expansion are:
The change in degree of operating leverage due to expansion is:
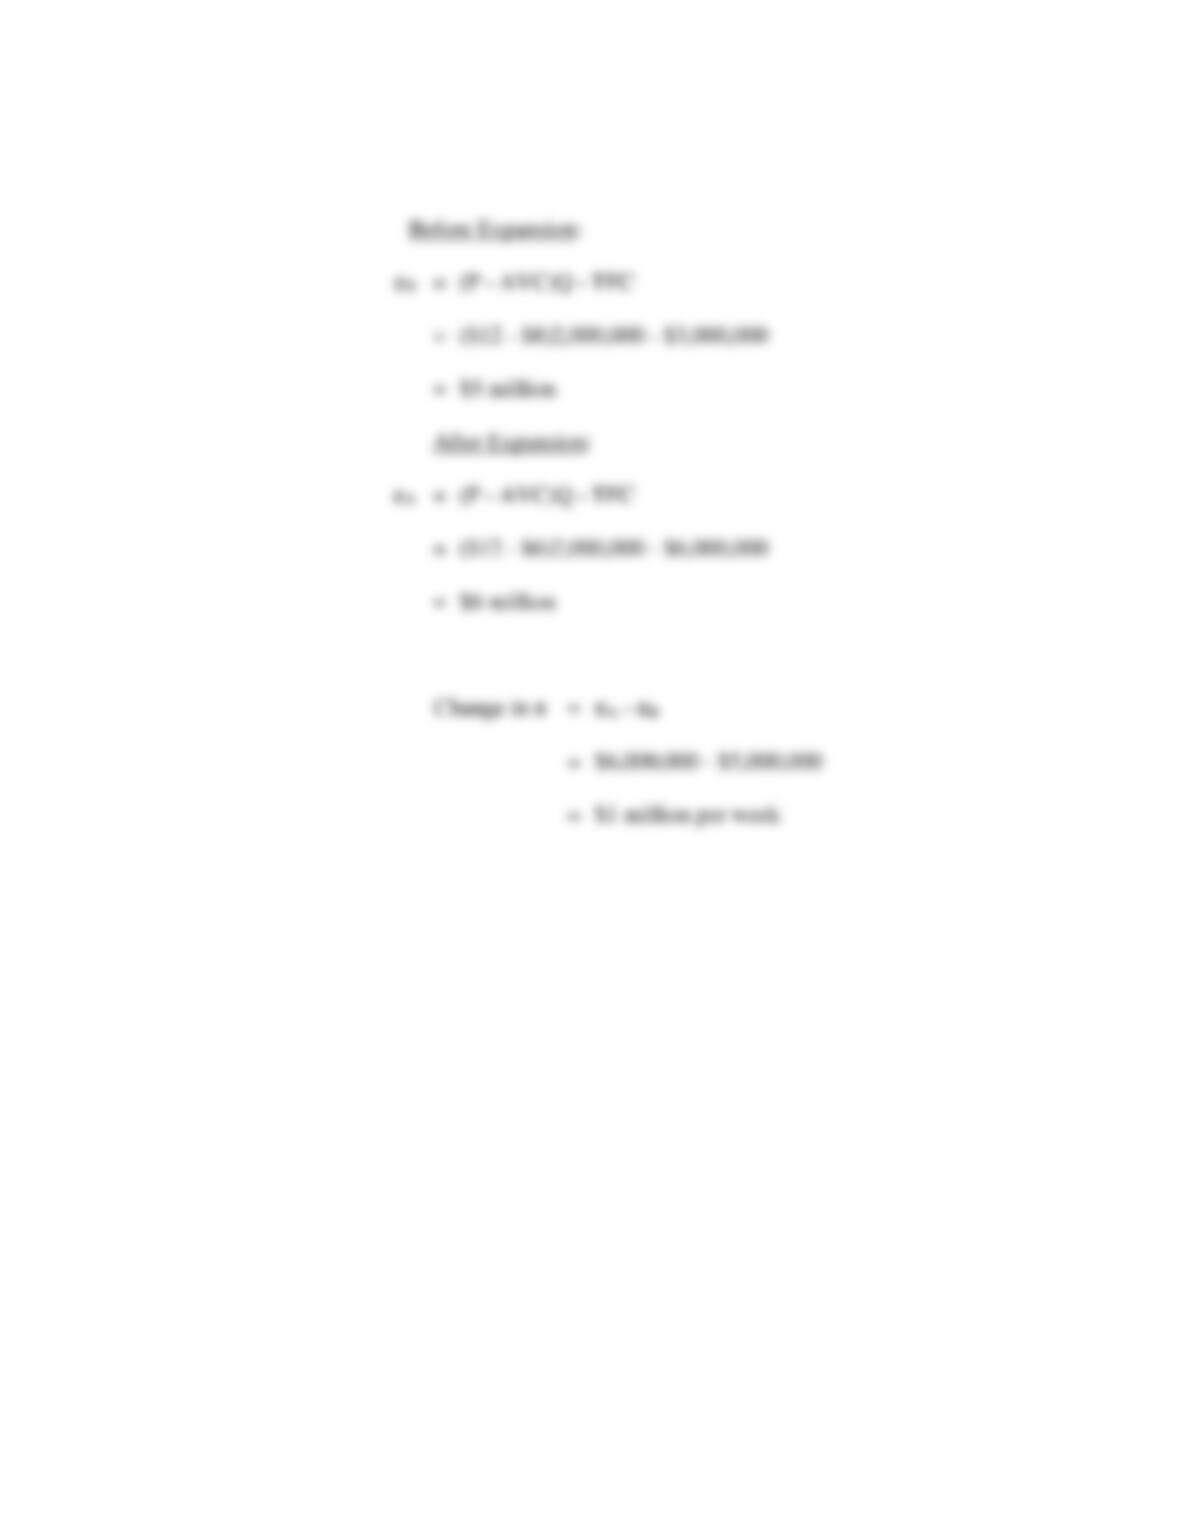
C. Profits before and after expansion are:
Cost Analysis and Estimation 225
The change in profits due to expansion is:

226 Chapter 8
CASE STUDY FOR CHAPTER 8
Estimating Hospitalization Costs for Regional Hospitals
Cost estimation and cost containment are an important concern for a wide range of for-profit and
not-for-profit organizations offering health-care services. For such organizations, the accurate
measurement of costs per patient day (a measure of output) is necessary for effective management.
Similarly, such cost estimates are of significant interest to public officials at the federal, state, and
local government levels. For example, many state Medicaid reimbursement programs base their
payment rates on historical accounting measures of average costs per unit of service. However,
As an alternative to accounting cost estimation methods, one might consider using
engineering techniques to estimate nursing costs. For example, the labor cost of each type of service
could be estimated as the product of an approximation of the time required to perform each service
times the estimated wage rate per unit of time. Multiplying this figure by an estimate of the
frequency of service gives an engineering estimate of the cost of the service. A possible limitation to
the accuracy of this engineering cost-estimation method is that treatment of a variety of illnesses
often requires a combination of nursing services. To the extent that multiple services can be
provided simultaneously, the engineering technique will tend to overstate actual costs unless the
effect of service “packaging” is allowed for.
Cost estimation is also possible by means of a carefully designed regression-based approach
using variable cost and service data collected at the ward, unit, or facility level. Weekly labor costs
Long-run costs per nursing facility can be estimated using either cross-section or time-series
methods. By relating total facility costs to the service levels provided by a number of hospitals,
nursing homes, or out-patient care facilities during a specific period, useful cross-section estimates
Cost Analysis and Estimation 227
of total service costs are possible. If case mixes were to vary dramatically according to type of
facility, then the type of facility would have to be explicitly accounted for in the regression model
analyzed. Similarly, if patient mix or service-provider efficiency is expected to depend, at least in
part, on the for-profit or not-for-profit organization status of the care facility, the regression model
must also recognize this factor. These factors plus price-level adjustments for inflation would be
accounted for in a time-series approach to nursing cost estimation.
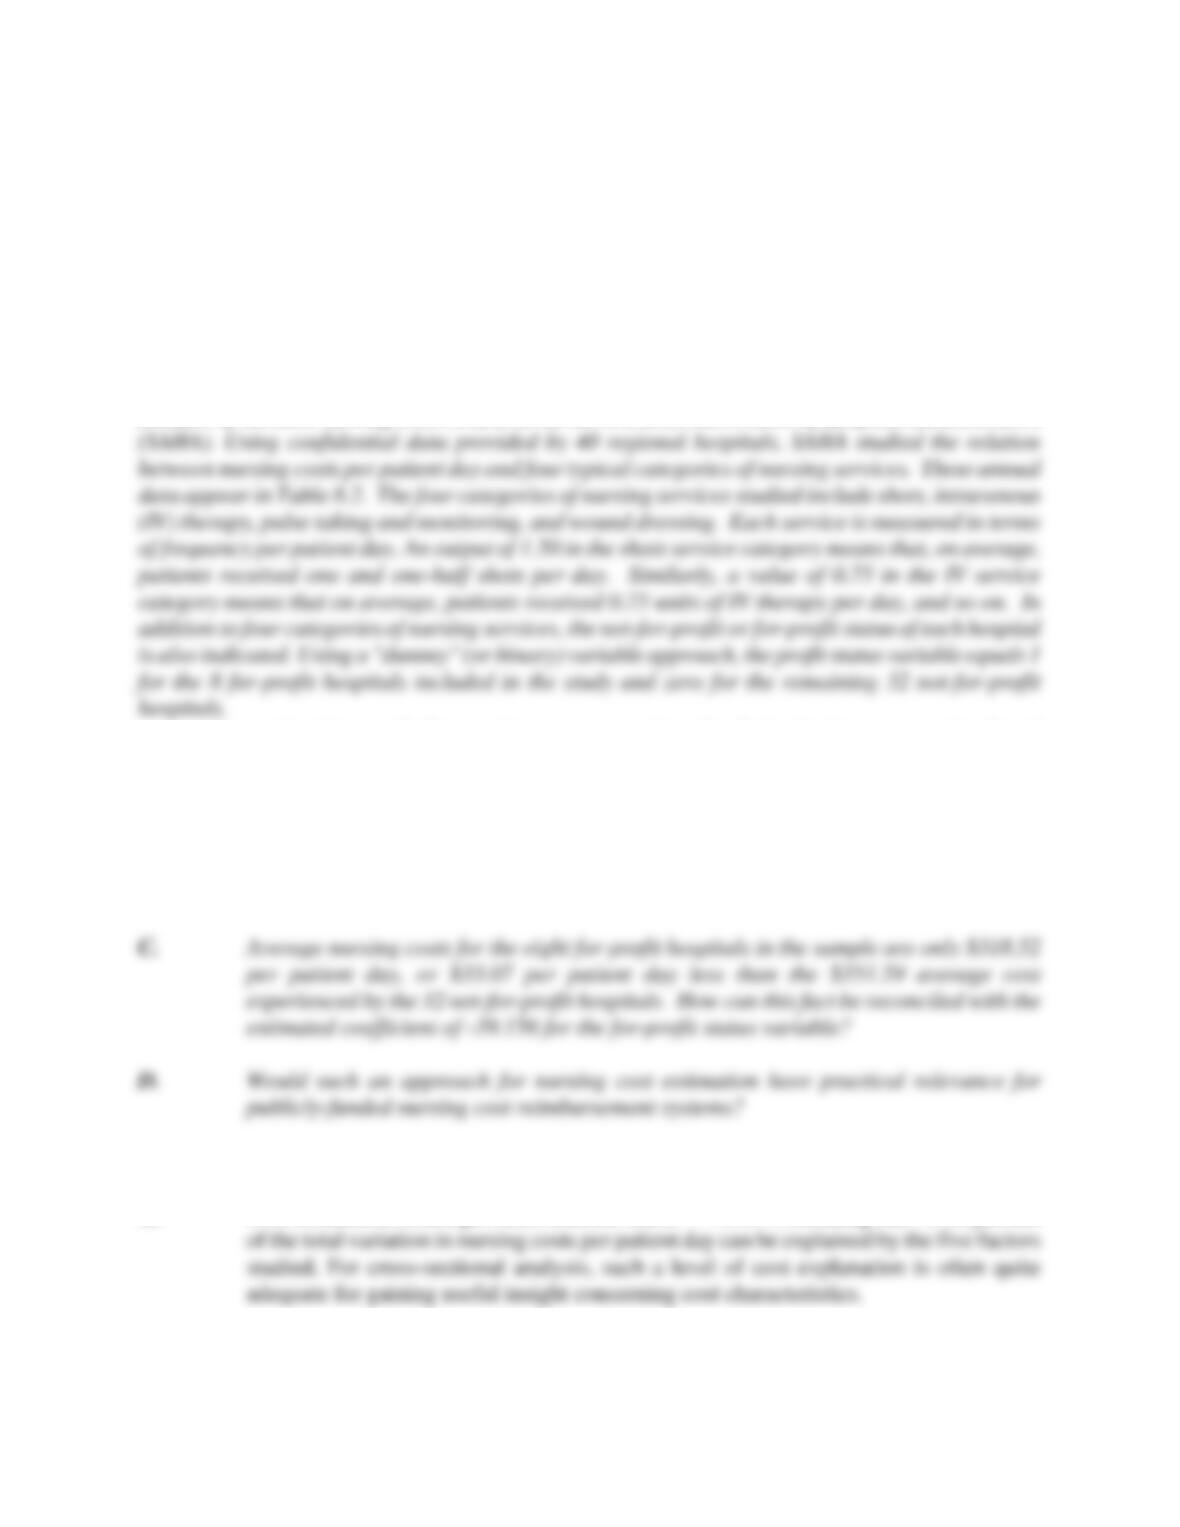
To illustrate a regression-based approach to nursing cost estimation, consider a hypothetical
analysis of variable nursing costs conducted by the Southeast Association of Hospital Administrators
Cost estimation results for nursing costs per patient day derived using a regression-based
approach are shown in Table 8.3.
A. Interpret the coefficient of determination (R2) estimated for the nursing cost function.
B. Describe the economic and statistical significance of each estimated coefficient in the
nursing cost function.
CASE STUDY SOLUTION
A. Cost estimation results provided indicate that R2 = 76.81%, meaning that 76.81 percent
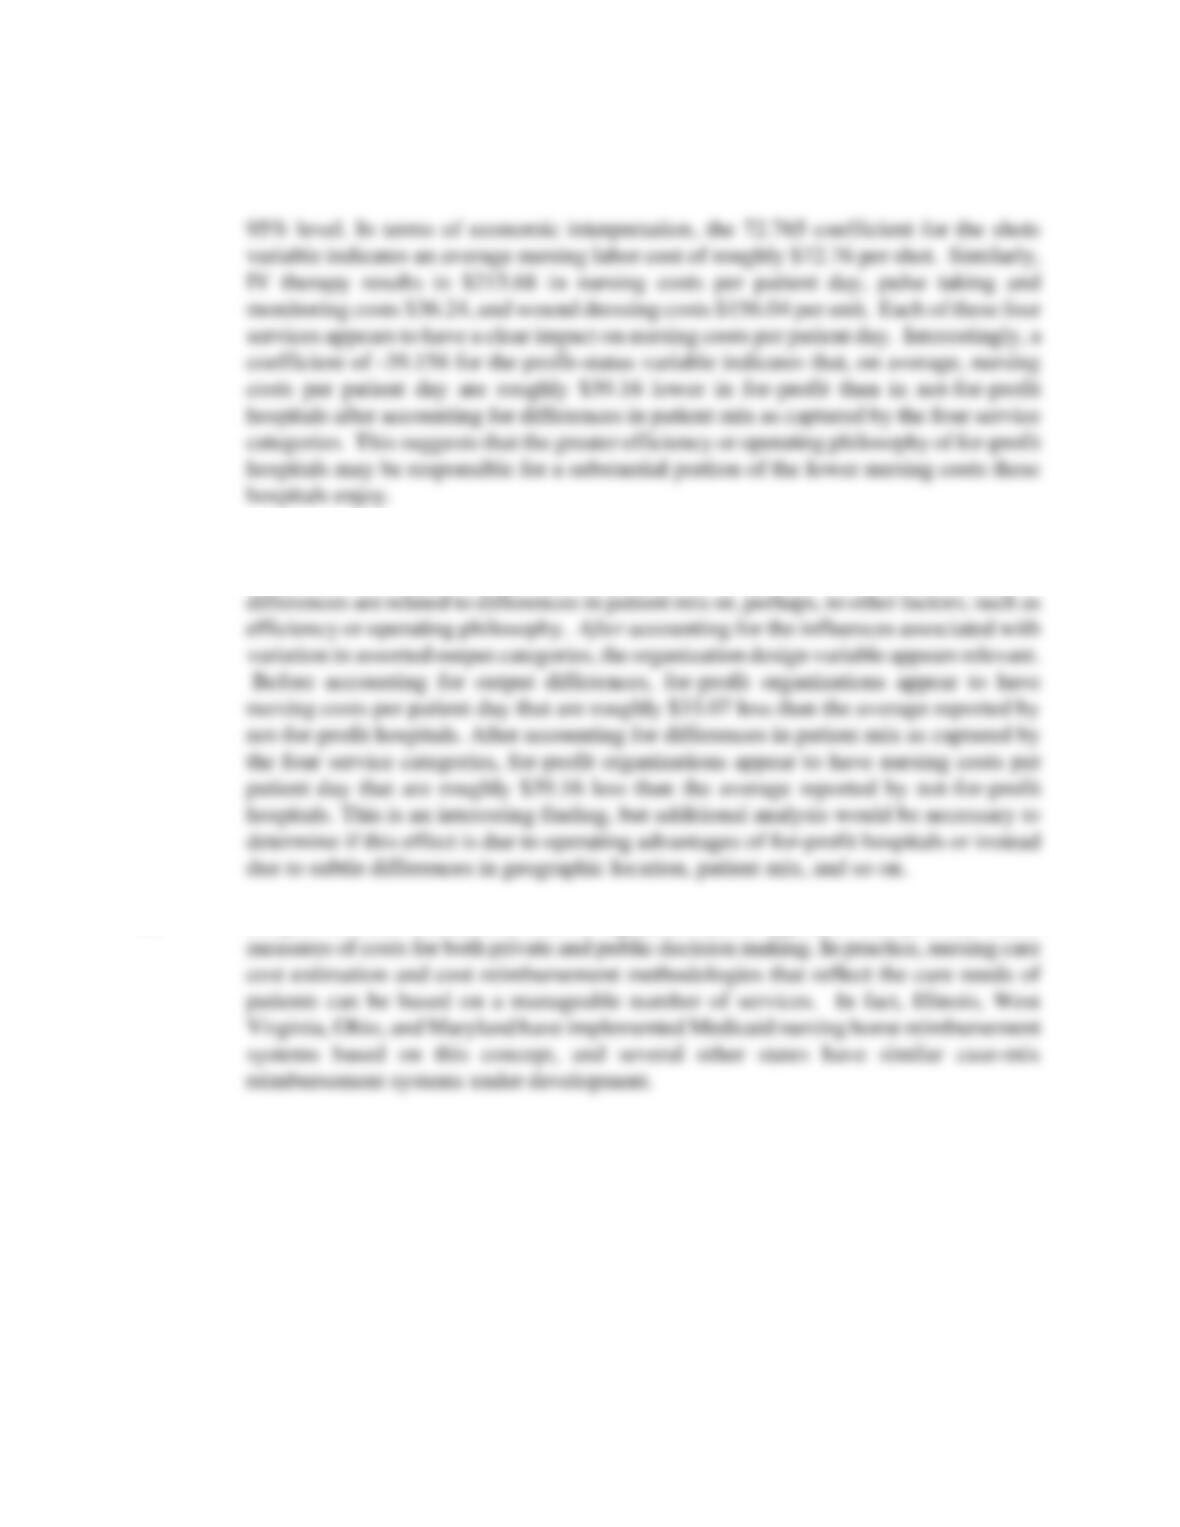
B. Each individual coefficient estimate is statistically significant at the 99% confidence
level, with the exception of the Shots coefficient estimate, which is significant at the
228 Chapter 8
C. By considering differences in the nursing services provided, along with the for-profit or
not-for-profit status of each hospital, it is possible to learn whether average cost
D. Despite obvious limitations, such a regression-based approach can provide useful