Chapter 7:
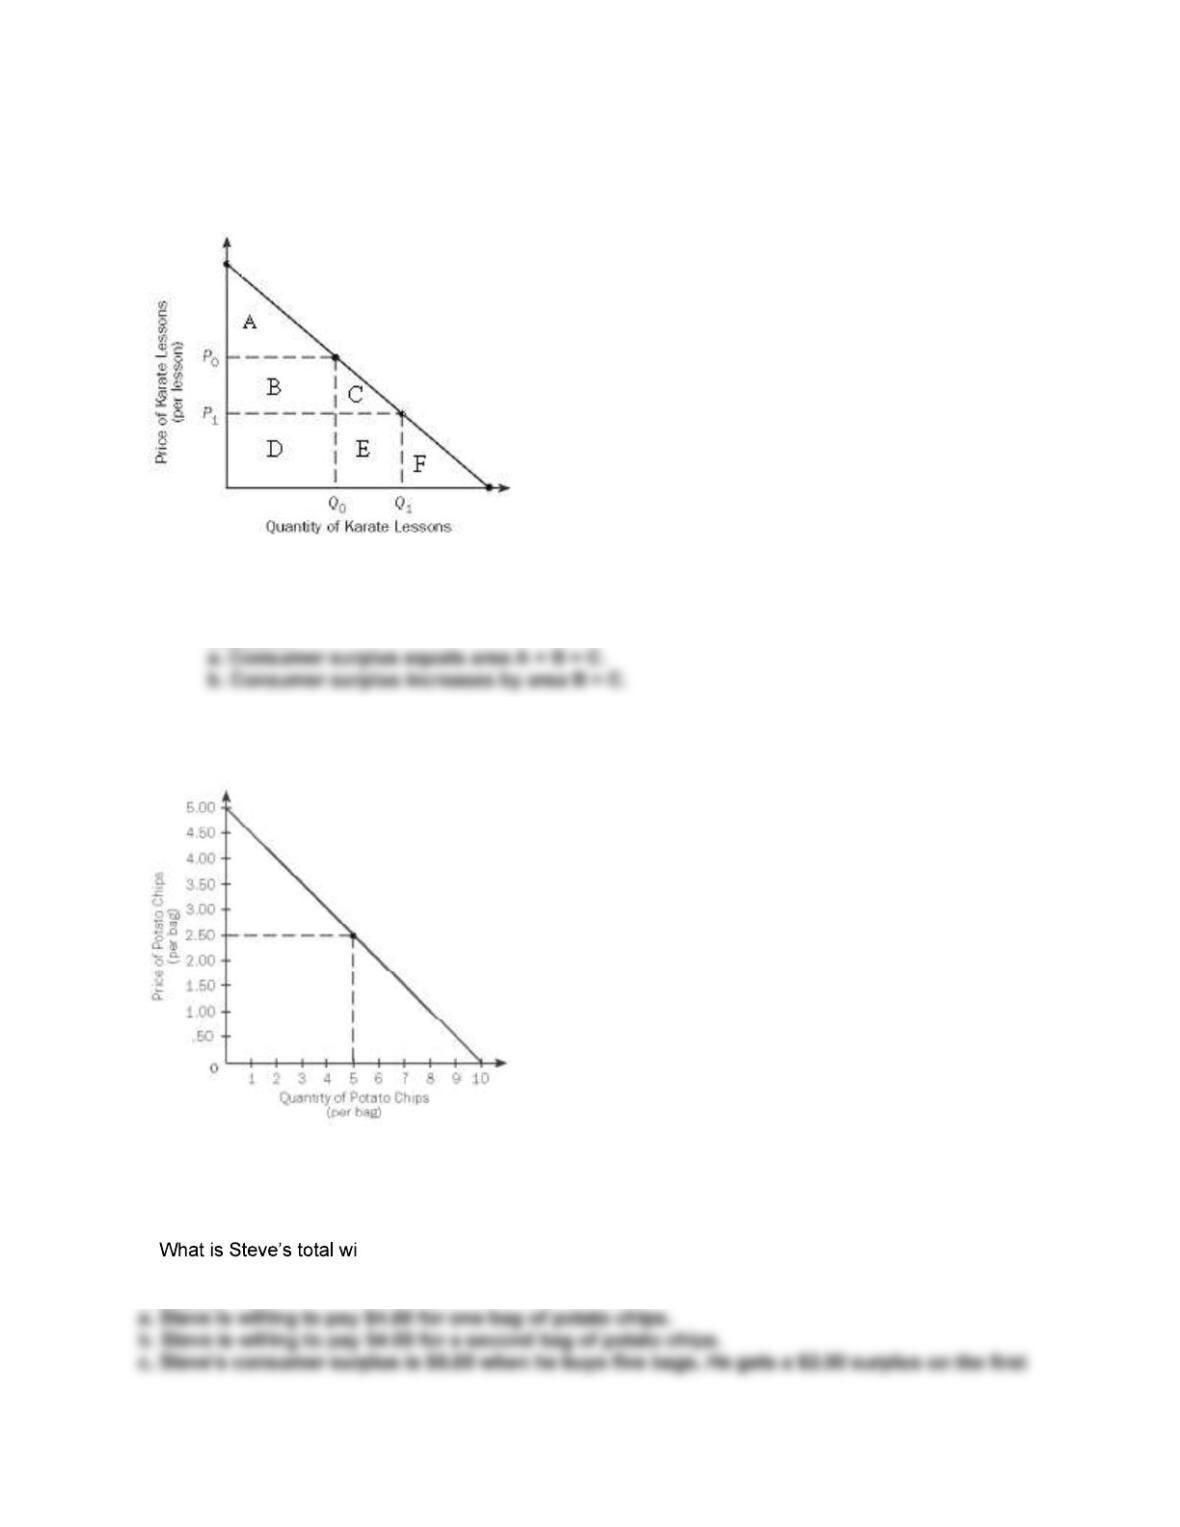
1. Refer to the following exhibit.
a. If the price of each karate lesson is P0, his consumer surplus is equal to what area?
b. If the price falls from P0 to P1, the change in consumer surplus is equal to what area?
Answers:
2. Steve loves potato chips. His weekly demand curve is shown in the following exhibit.
a. How much is Steve willing to pay for one bag of potato chips?
b. How much is Steve willing to pay for a second bag of potato chips?
c. If the actual market price of potato chips is $2.50, and Steve buys five bags as shown, what is the
value of his consumer surplus?
d. llingness to pay for five bags?
Answers:
3.
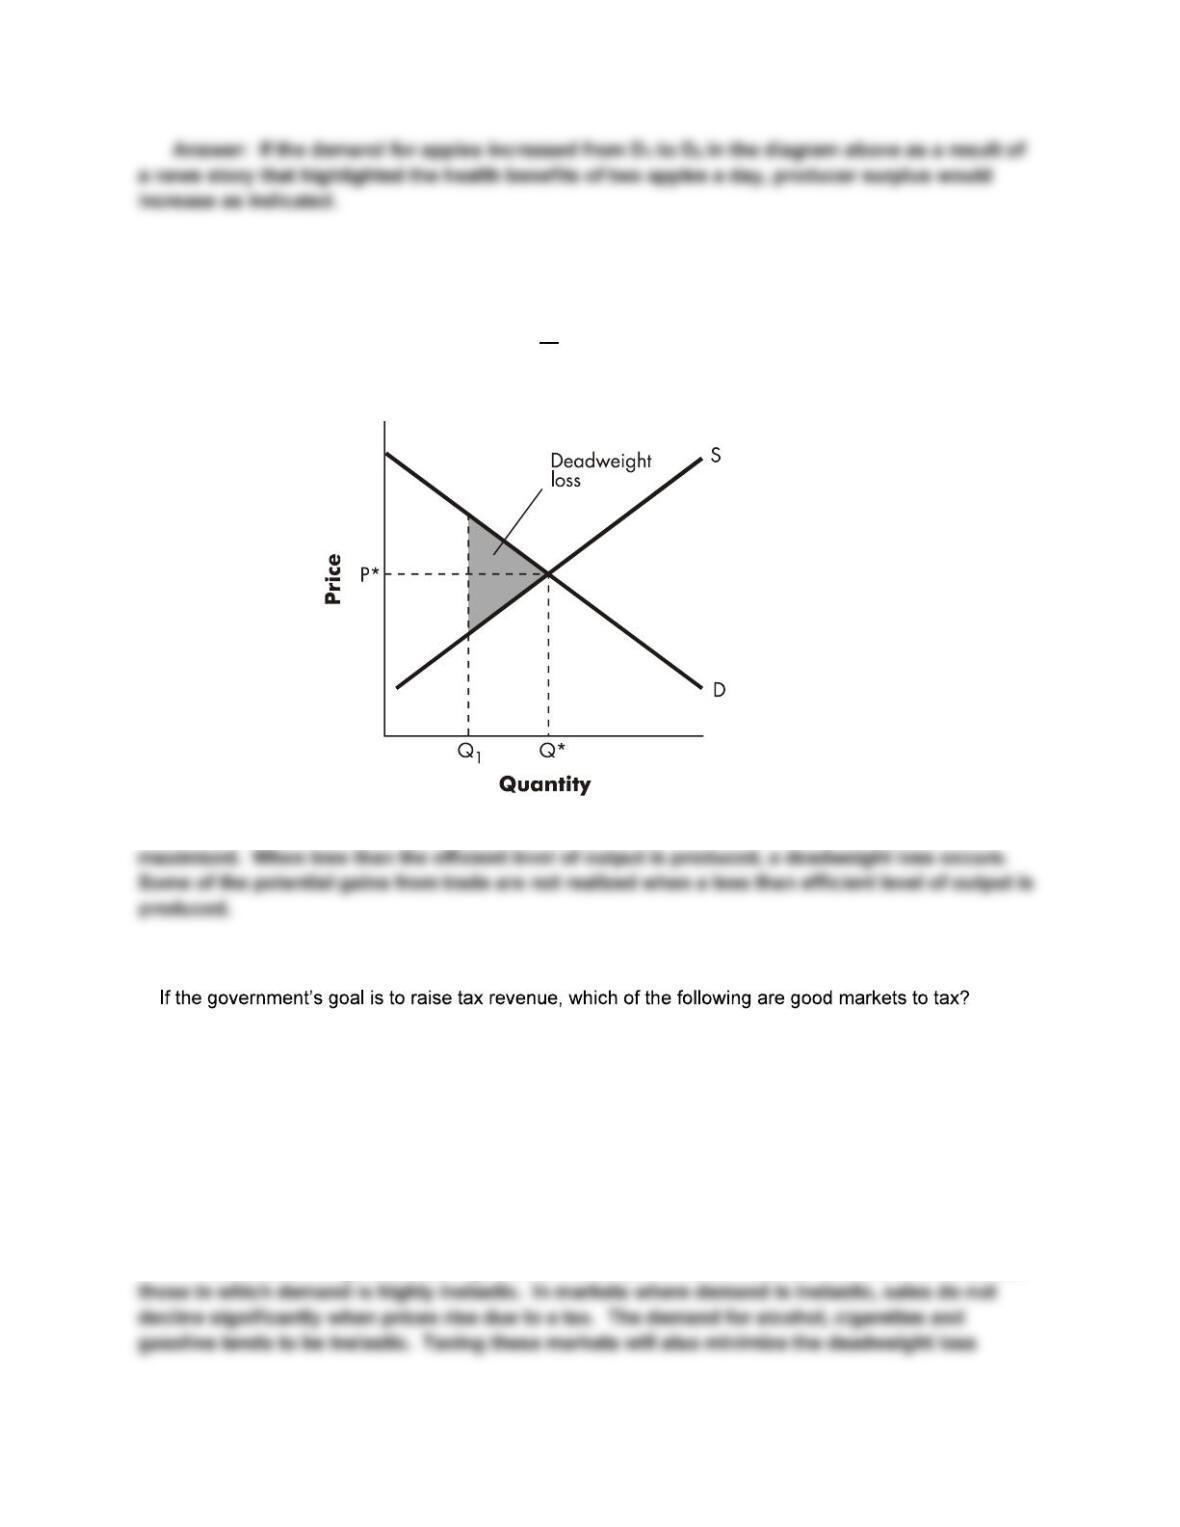
4. If demand for apples increased as a result of a news story that highlighted the health benefits of two
apples a day, what would happen to producer surplus?
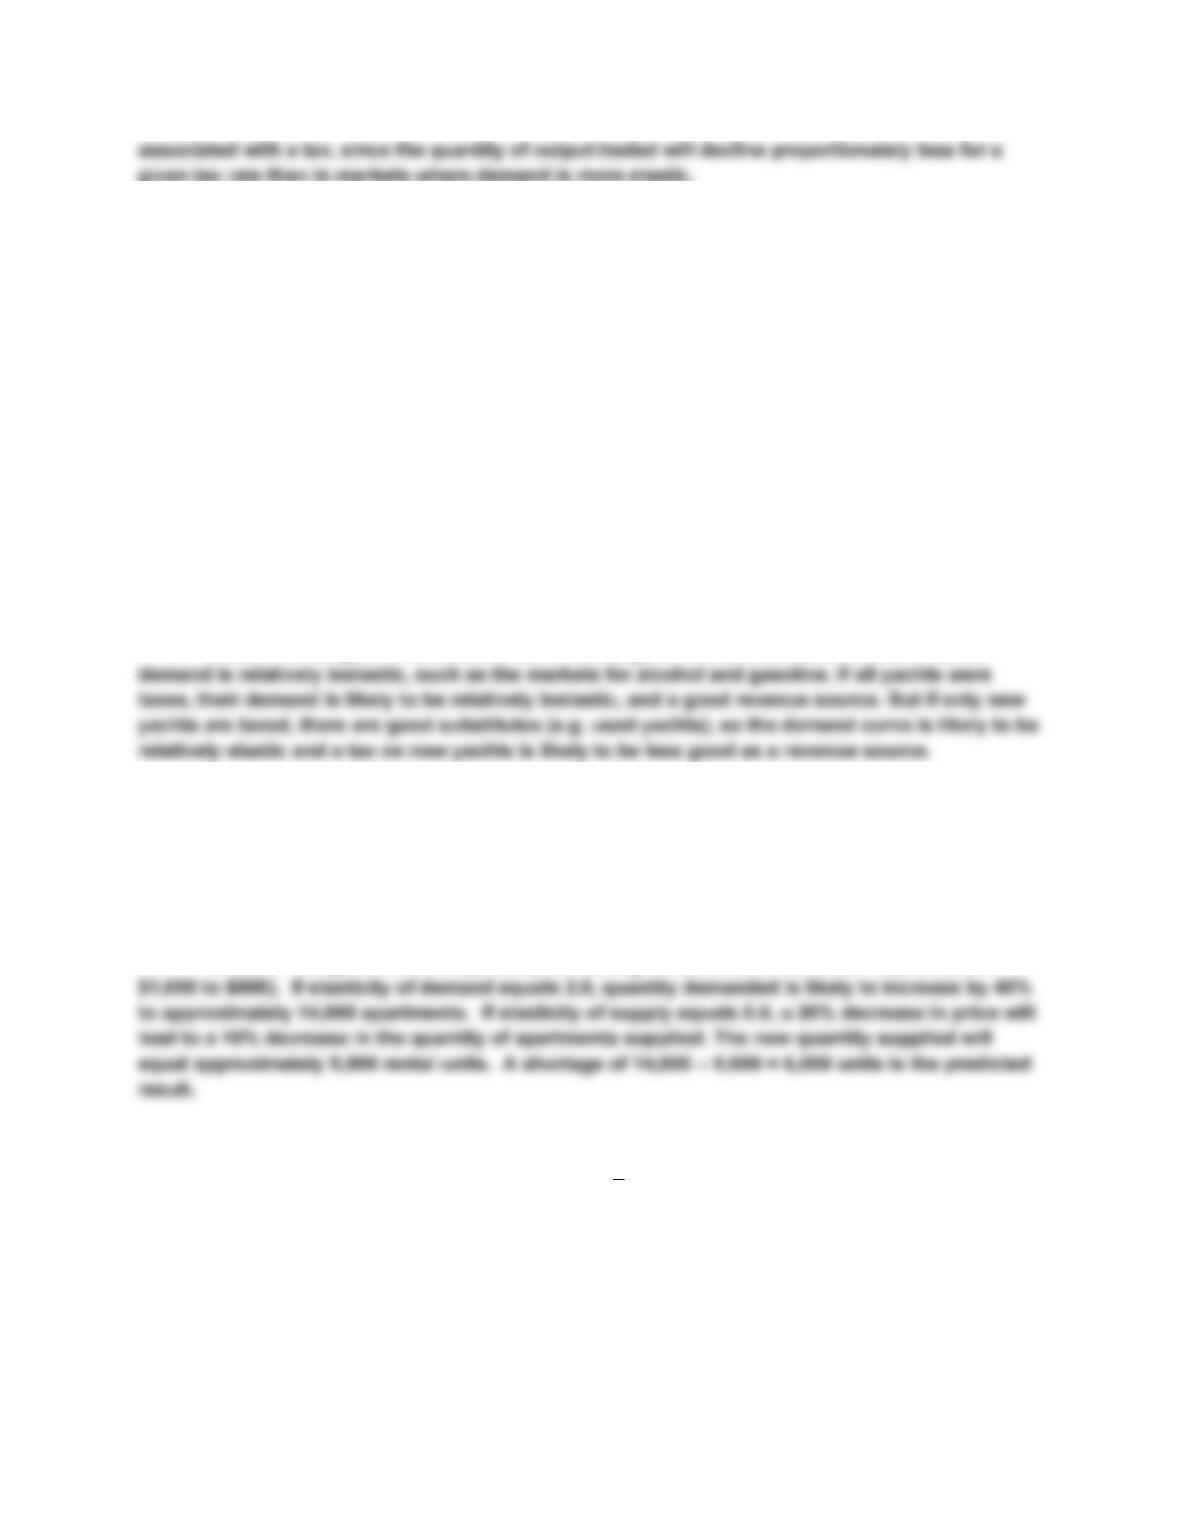
5. How is total surplus (the sum of consumer and producer surpluses) related to the efficient level of
output? Using a supply and demand curve, demonstrate that producing less than the equilibrium output
will lead to an inefficient allocation of resources a deadweight loss.
Answer: At the efficient level of output, the societal gains from trade, or total surplus, is
6.
a. luxury yachts
b. alcohol
c. movies
d. gasoline
e. grapefruit juice
Answer: If the government’s goal is to boost tax revenue, then the best markets to tax are
7. Which of the following do you think are good markets for the government to tax if the goal is to boost
tax revenue?
Which will lead to the least amount of deadweight loss? Why?
a. luxury yachts
b. alcohol
c. motor homes
d. cigarettes
e. gasoline
f. pizza
Answer: If the goal is to increase tax revenue, good markets to tax are those in which
8. Elasticity of demand in the market for one-bedroom apartments is 2.0, elasticity of supply is 0.5, the
current market price is $1,000, and the equilibrium number of one–bedroom apartments is 10,000. If the
government imposes a price ceiling of $800 on this market, predict the size of the resulting apartment
shortage.
Answer: The government-imposed price ceiling causes a 20% reduction in price (from
9. Use the diagram to answer the following questions (a d).
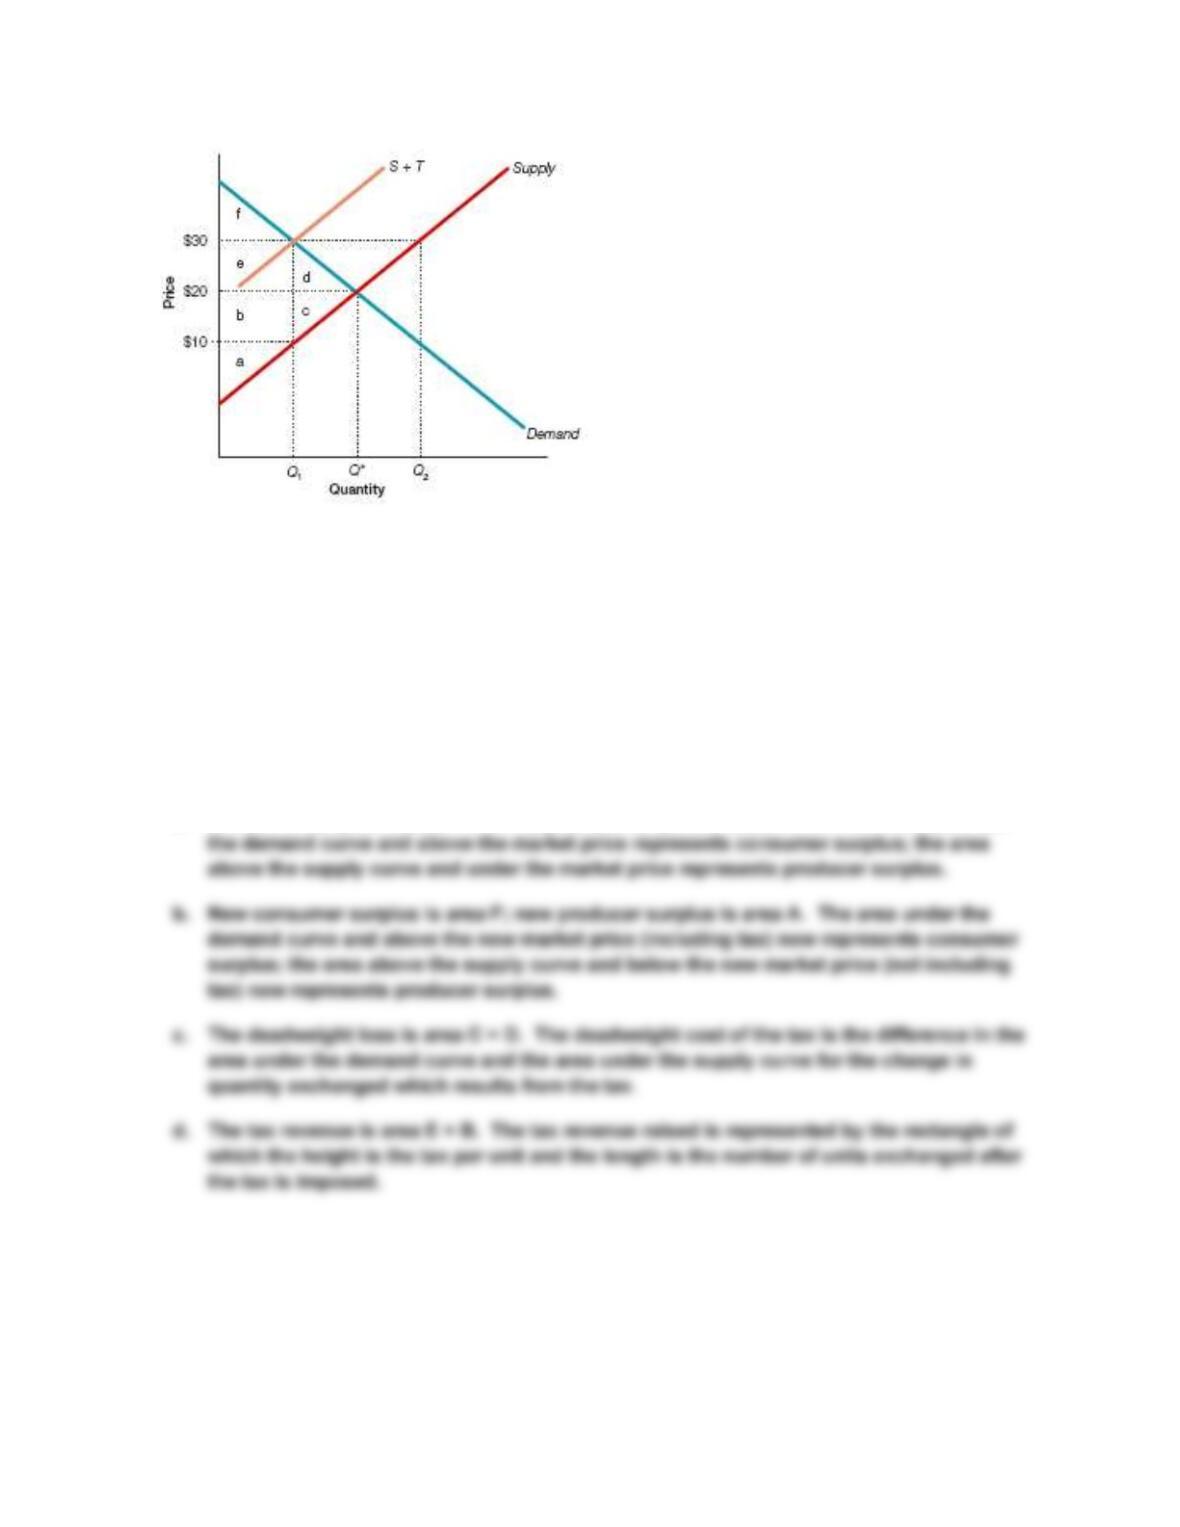
a. At the equilibrium price before the tax is imposed, what area represents consumer surplus? What area
represents producer surplus?
b. Say that a tax of $T per unit is imposed in the industry. What area now represents consumer surplus?
What area represents producer surplus?
c. What area represents the deadweight cost of the tax?
d. What area represents how much tax revenue is raised by the tax?
Answers:
a. Consumer surplus is area F + E + D; producer surplus is area A + B + C. The area under
10. Use consumer and producer surplus to show the deadweight loss from a subsidy (producing more
than the equilibrium output). (Hint: Remember that taxpayers will have to pay for the subsidy.)
Answer: A deadweight loss occurs due to a subsidy (as indicated in the graph below)
because producers have a private incentive to produce more than the socially efficient level of
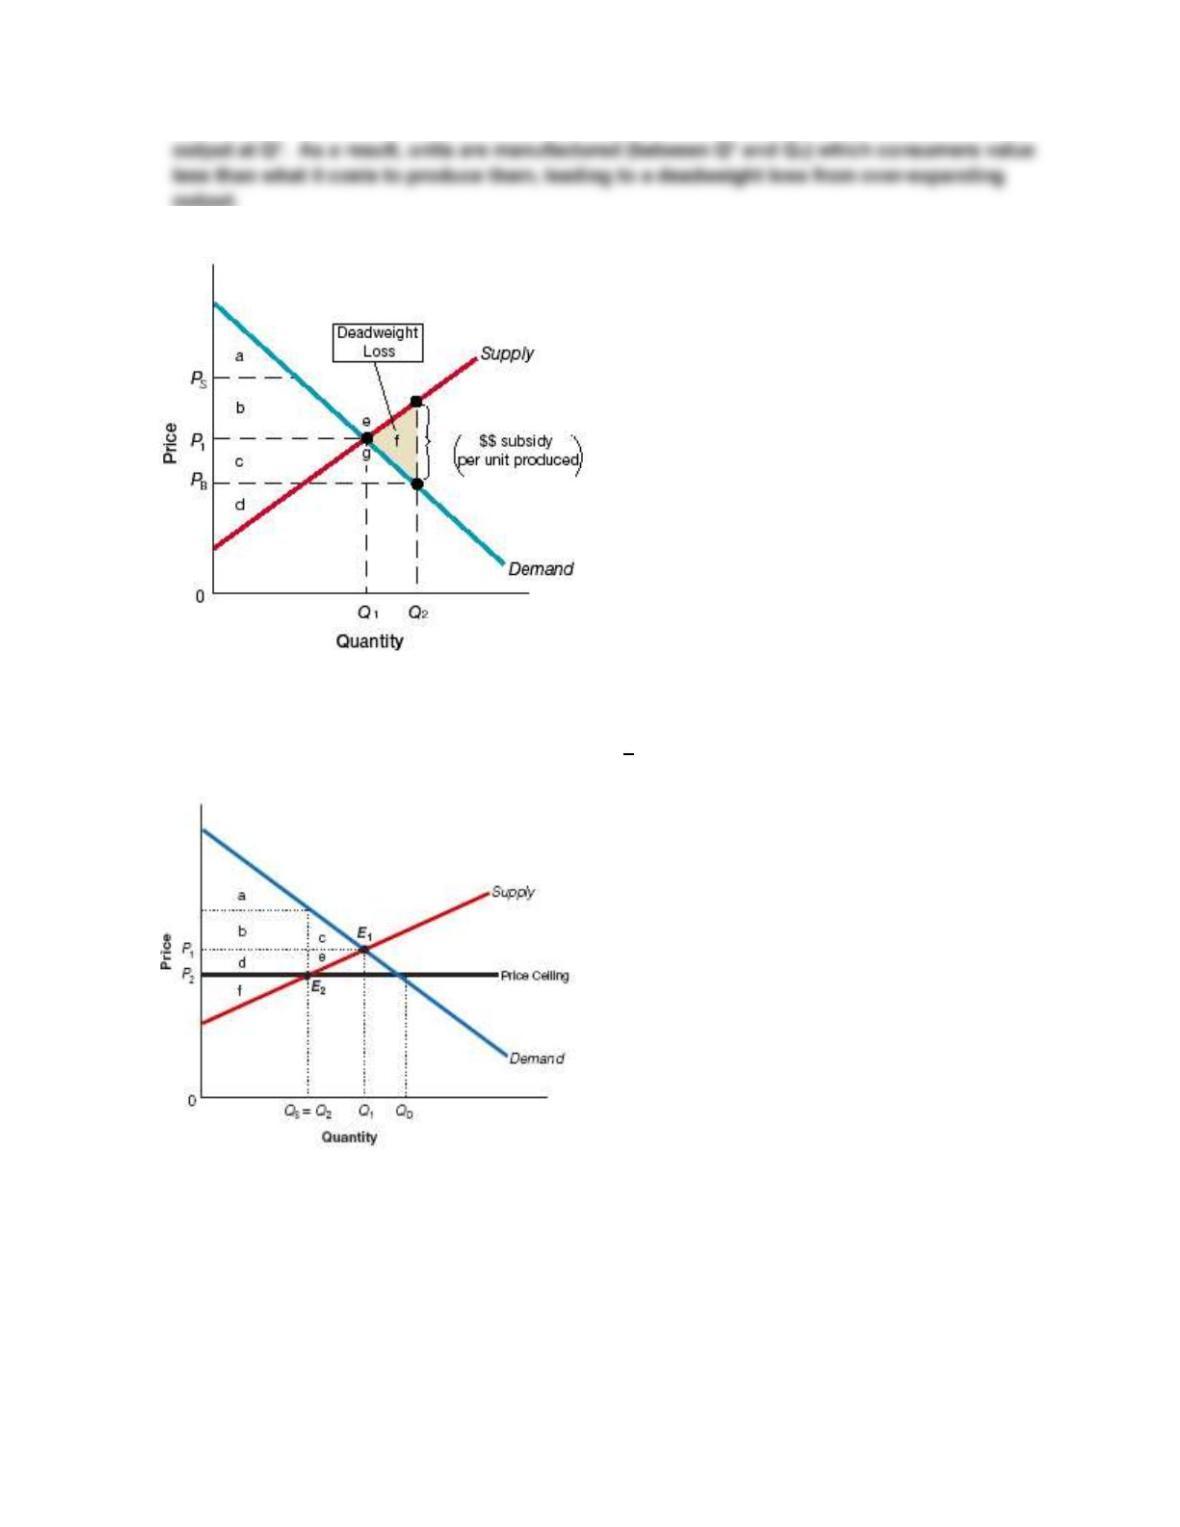
11. Use the diagram to answer the following questions (a c).
a. At the initial equilibrium price, what area represents consumer surplus? What area represents produce
surplus?
b. After the price ceiling is imposed, what area represents consumer surplus? What area represents
producer surplus?
c. What area represents the deadweight loss cost of the price ceiling?
Answers:
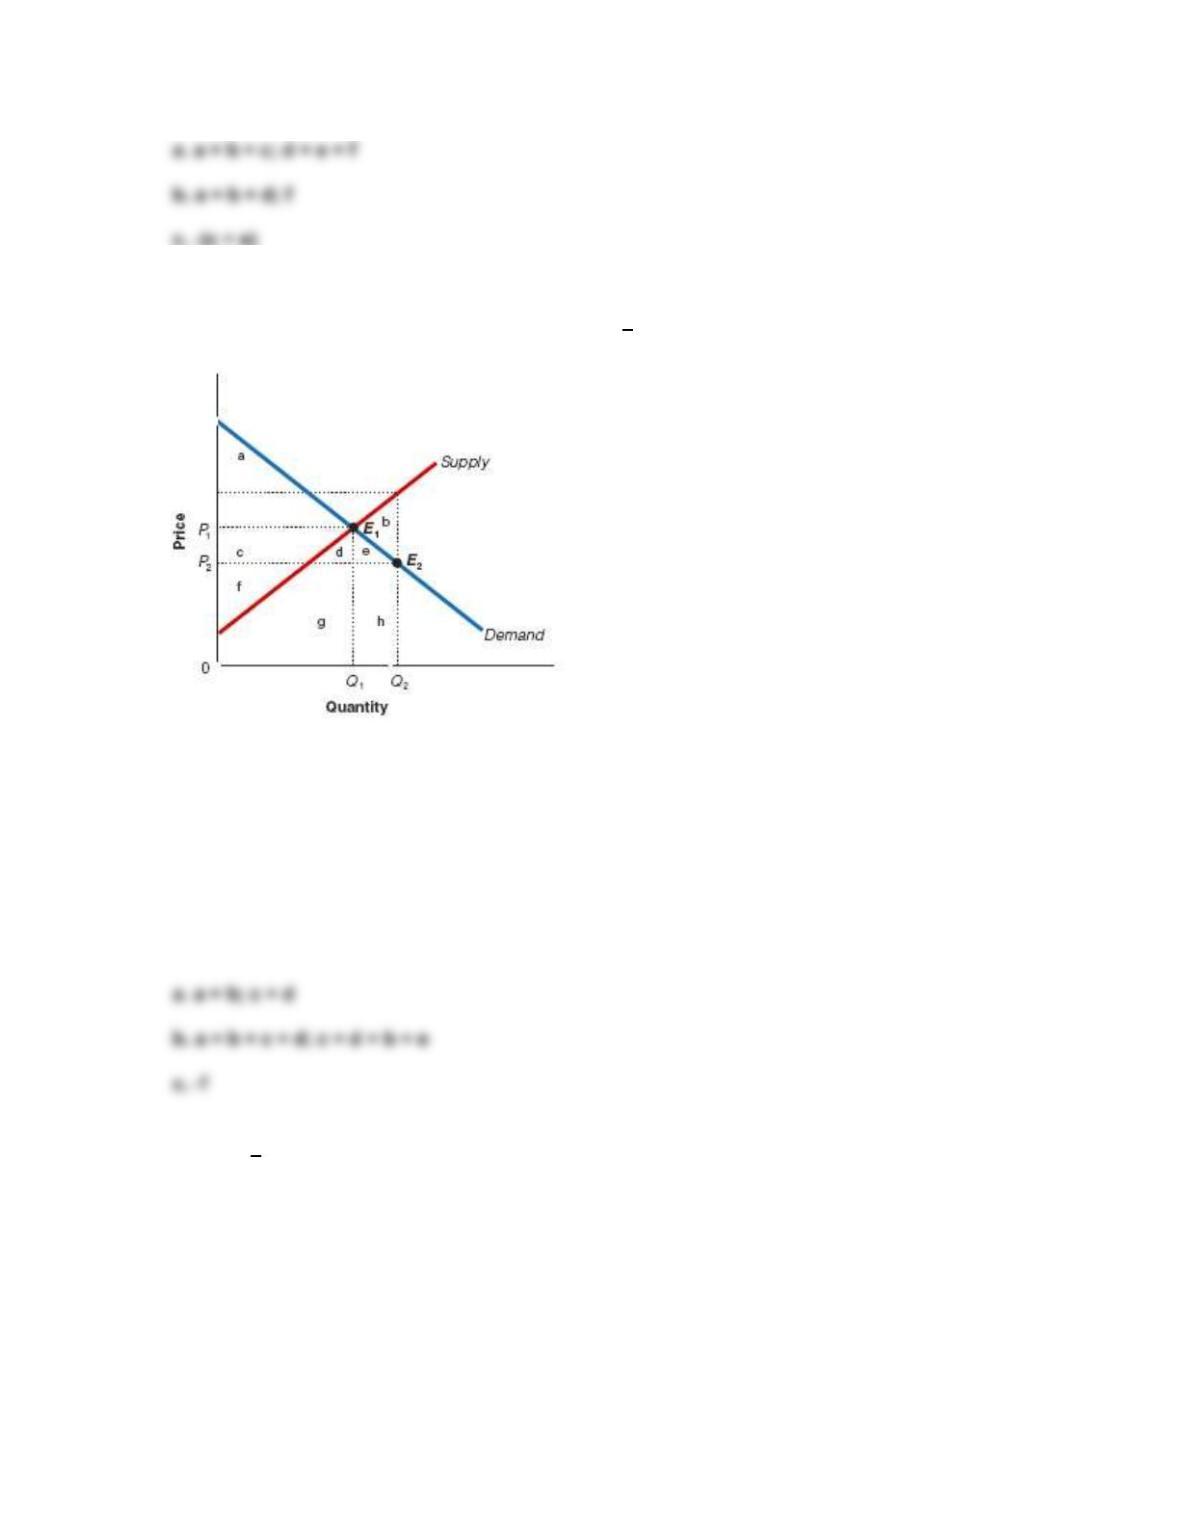
12. Use the diagram to answer the following questions (a c).
a. At the competitive output, Q1, what area represents the consumer surplus? What area represents the
producer surplus?
b. At the larger output, Q2, what area represents the consumer surplus? What area represents the
producer surplus?
c. What area represents the deadweight loss of producing too much output?
Answers:
13. The 2000 2001 California energy crisis produced brownouts, utility company bankruptcies, and
worries about high prices. The California electric power regulatory program imposed price ceilings on
electricity sold to consumers. The following exhibit describes the California situation with PS as the price
ceiling. Answer the following questions referring to this exhibit.
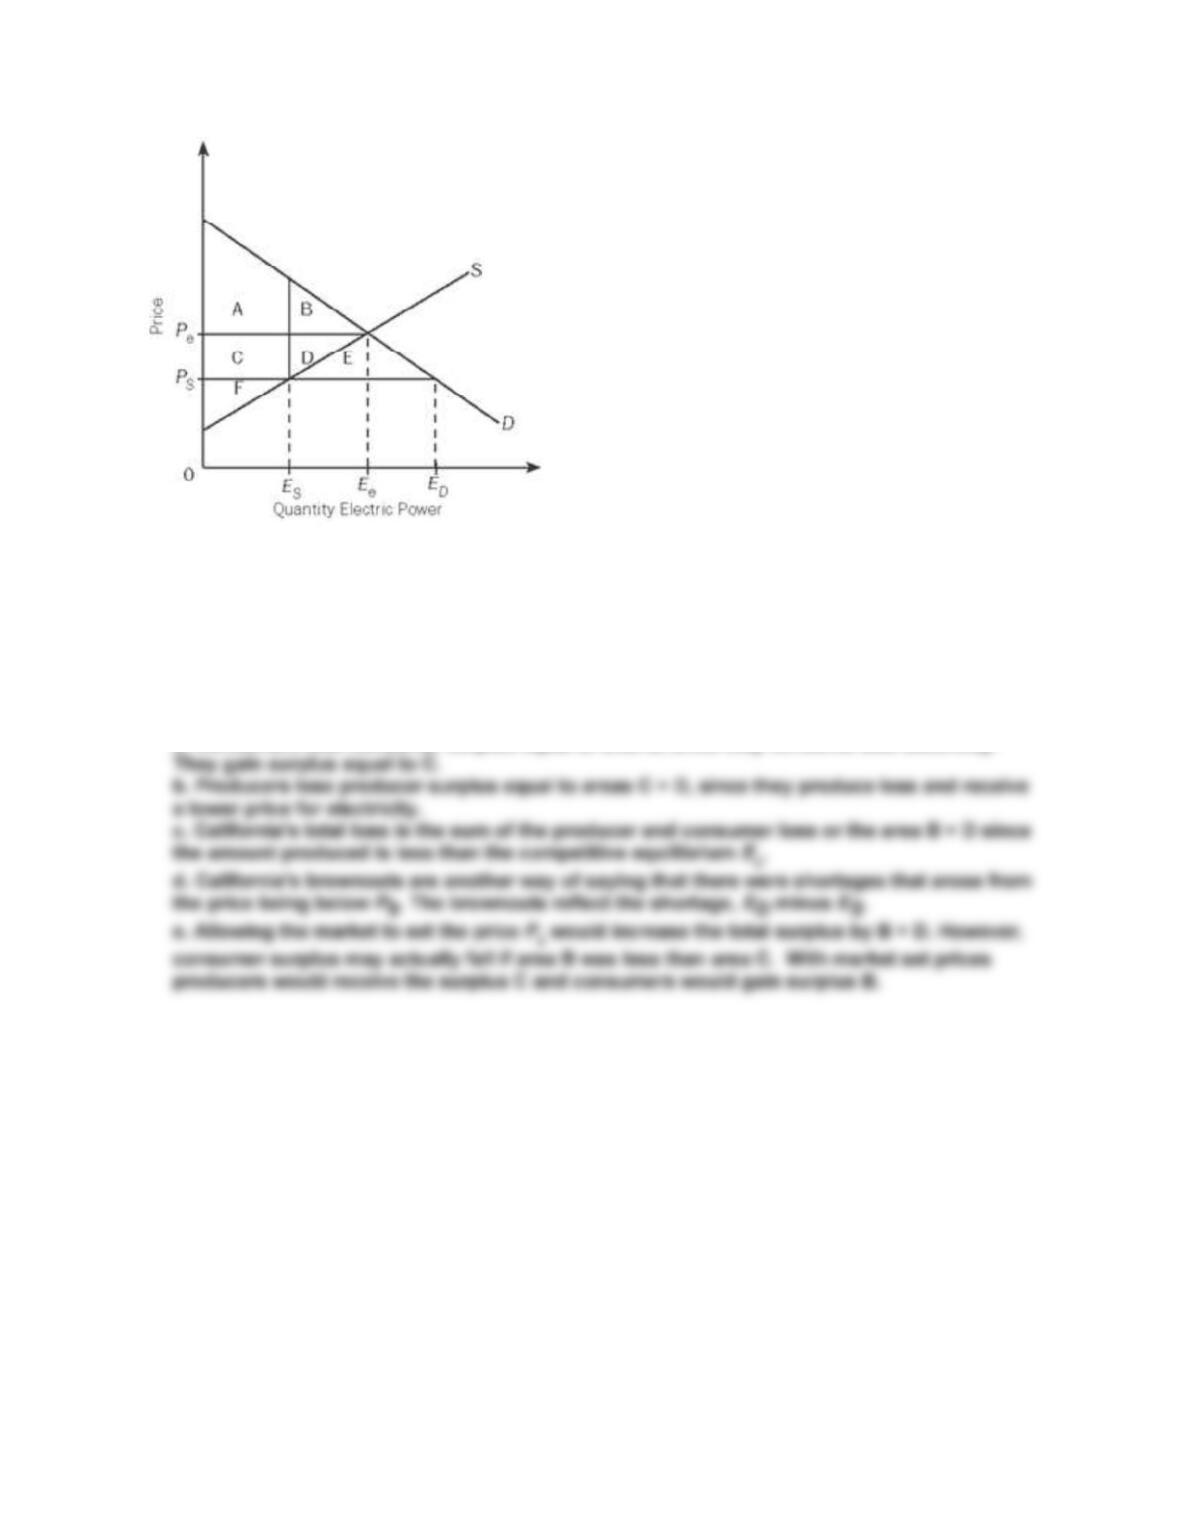
a. What was the loss imposed on consumers by this price ceiling?
b. What was the loss imposed on producers by this price ceiling?
c. What was the loss imposed on California by this price ceiling?
d. Use this exhibit to explain the brownouts in California.
e. What would have to be true for consumers to support market set prices? Use the exhibit to explain why
there might not be support among consumers for raising prices.
Answers:
a. Consumers lose consumer surplus equal to area B, since they consume less electricity.