Chapter 7
Drivers of Growth: Technology, Policy, and Institutions
◼ Chapter Outline, Overview, and Teaching Tips
Chapter Outline
Technology as a Production Input
Policies to Promote Productivity
Building Infrastructure
Policy and Practice: Government Measures to Increase Human Capital
Encouraging Research and Development
Institutions and Property Rights
The Legal System and Property Rights
Endogenous Growth Theory
Allocation of Labor
Factors That Affect Endogenous Growth
Effects of an Increase in the Fraction of the Population Engaged in R&D,
Chapter Overview and Teaching Tips
The previous chapter’s discussion of growth accounting and the Solow model indicates that understanding
what drives technology and productivity growth is crucial to understanding why some countries are rich
and others poor. In contrast to most macroeconomic textbooks, which give only a cursory treatment of
what drives technology and productivity growth, this chapter provides a deep discussion of this topic.
72 Mishkin • Macroeconomics: Policy and Practice, Second Edition
Because some instructors prefer to spend more time on business cycle analysis, they may not have time to
cover this chapter and can skip it without loss of continuity with subsequent chapters. However, this topic
is inherently fascinating and has generated an explosion of research in recent years.
The chapter is structured with the sections on policies to promote productivity and on institutions and
property rights coming before the development of endogenous growth theory. I have done this because
endogenous growth theory is harder for students to master than the policy issues, and teaching this theory
is not necessary for discussion of these policy issues. However, if an instructor wants to teach endogenous
growth theory, I would recommend that he or she teach it before the sections on policies to promote
productivity because understanding this theory leads to a deeper understanding of the policy issues.
Student understanding of the role of good institutions and property rights to promoting economic growth is
enhanced by practical policy examples discussed in the Policy and Practice cases in this section. The example
of the World Bank’s Doing Business publication illustrates how a focus on institutional development has
become important in development institutions like the World Bank. Getting students to debate whether
foreign aid helps or harms countries as is discussed in the Policy and Practice case, “Does Foreign Aid
Work?” is a good way to get them to recognize that obvious solutions to poverty of giving poor countries
money may not work because it can hinder the development of good institutions.
Chapter 7 Drivers of Growth: Technology, Policy, and Institutions 73
◼ Answers to End of Chapter Review Questions and Problems
Answers to Review Questions
Technology as a Production Input
1. As physical objects, labor and capital inputs are rival and excludable: They can only be used in one
productive activity at a time, so that using them to produce one thing precludes their use to produce
Policies to Promote Productivity
2. Government can promote productivity growth by designing policies that lead to more spending on
3. Because of the nonexcludable nature of technology, many of the benefits of new technology will be
4. A patent gives an inventor exclusive rights over the use of his or her invention for a specific period of
time. The inventor may use the new technology or sell or license it for others to use. When
Institutions and Property Rights
5. Property rights protect property owners from government and others who might want to extort their
6. Property rights are no better than the legal system that defines, interprets, and enforces them. To
provides access to lawyers, so aggrieved parties can have their day in court.
Endogenous Growth Theory
7. The Solow growth model treats changes in technology and productivity exogenously, which renders
8. In the Solow model, diminishing returns to capital move the economy to a steady state at which
capital and output per worker are constant. However, sustained per capita growth is possible in the
74 Mishkin • Macroeconomics: Policy and Practice, Second Edition
Factors That Affect Endogenous Growth
9. The three determinants of an economy’s growth rate in the Romer model are the productiveness of
10. The growth rate of per capita output at first falls, but ultimately it rises. This is so because an increase
in the fraction of the population engaged in R&D means a decrease in the fraction of workers available
11. The growth rate of per capita output increases and then drops but remains higher than before. Initially,
the increase in total population causes the capital–labor ratio for workers employed in the production
12. An increase in the saving rate causes per capita output temporarily to grow faster as it allows for
more investment per worker and a higher steady state capital–labor ratio, which raises per capita
Answers to Problems
Technology as a Production Input
1. a. A robot is a rival input, as it cannot be used in another activity when used to weld cars in a factory.
The idea of an assembly line is a nonrival good, as many people can use that idea at the same time.
A robot is an excludable input, as it is a piece of property and its owner can prevent others from
of excludability. The latter is probably protected by a patent.
Policies to Promote Productivity
2. The rationale for this policy is to increase technology and to make each U.S. worker more productive.
3. a. The One Laptop per Child program will most surely increase workers’ productivity when today’s
children join the labor force in the future. In the Romer model’s terminology, we can interpret
Chapter 7 Drivers of Growth: Technology, Policy, and Institutions 75
4. According to Romer’s model, government spending on infrastructure can increase productivity in
many ways. Government spending on education and health usually has high returns. Improving
5. According to Romer’s model, we should expect that countries that have better designed and enforced
property rights are the ones with better standards of living. Properly enforcing property rights increases
individuals’ and firms’ ability to recover their investment needed to advance technology. After the
Institutions and Property Rights
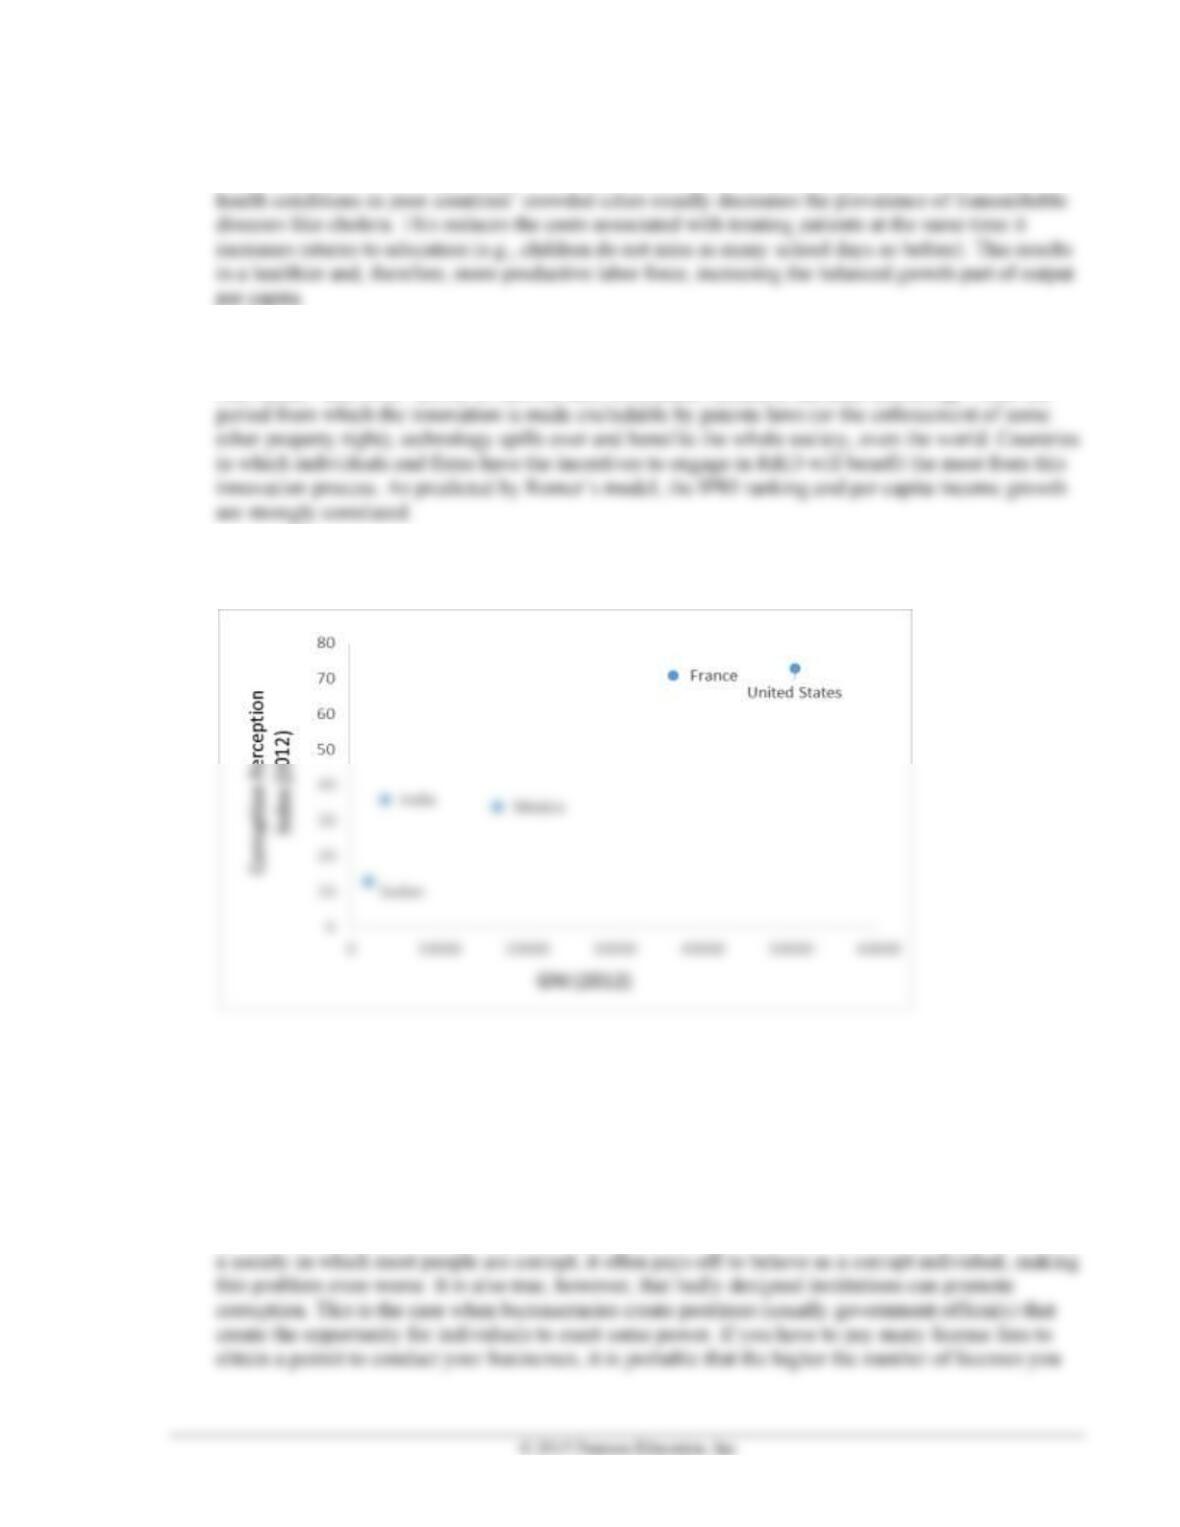
6.
According to the graph, there is a close association between corruption and per capita income. As the
CPI value increases, indicating that corruption is less prevalent, GNI per capita also increases. As
expected, relatively richer countries exhibit higher values of the CPI. This constitutes evidence in
favor of the hypothesis that corruption and economic growth are negatively related.
7. Unfortunately, there is no clear answer for this question. There are valid arguments for both positions.
The prevalence of corruption in a society makes the enforcement of property rights very difficult, as
government officials are often bribed in exchange for preferential treatments or concessions. Also, in
76 Mishkin • Macroeconomics: Policy and Practice, Second Edition
8. Although the answer to this question is based on personal opinion, both Sachs and Easterly make
good points. Sachs argues that increasing foreign aid can effectively break down the poverty cycle
and allow individuals to escape their poverty traps. This can happen by financing projects that
improve healthcare in poor countries, like mosquito nets designed to reduce the prevalence of
Endogenous Growth Theory
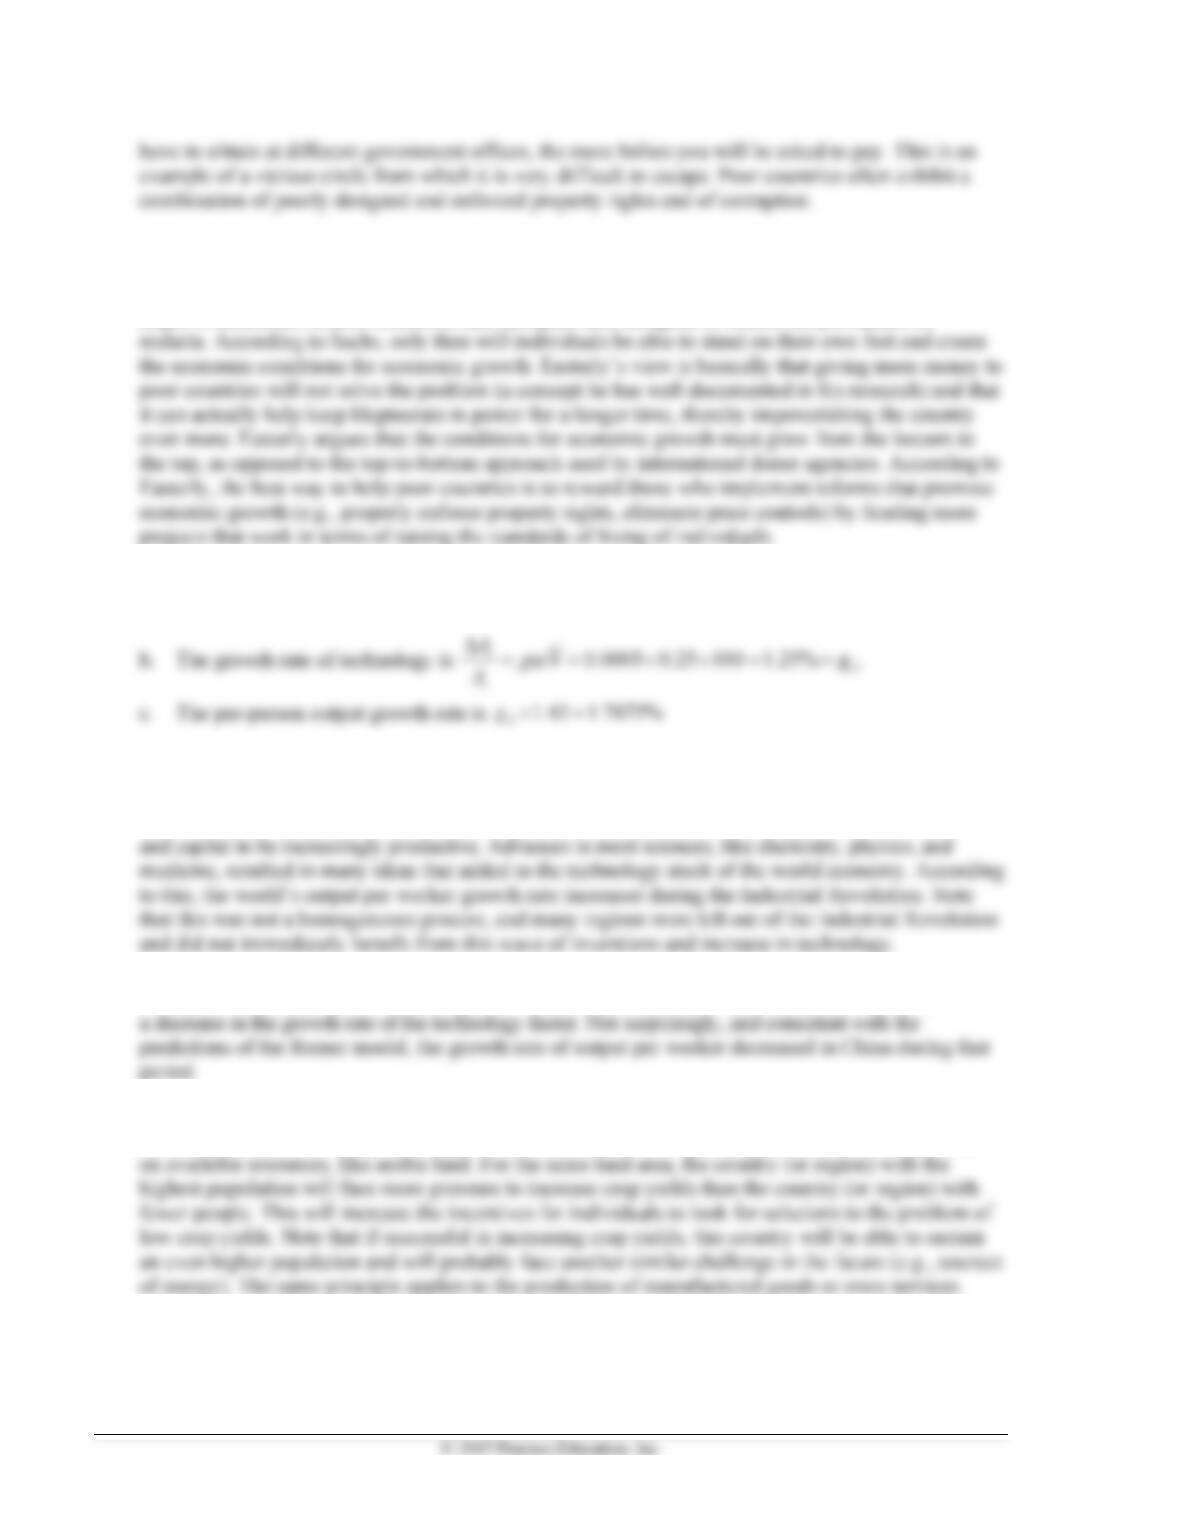
9. a. The change in technology is
= = =0.0005 20 25 0.25%.
t t A
A A L
Factors That Affect Endogenous Growth
10. The Industrial Revolution was a period in which technological growth increased at a fast rate. The
invention of the steam machine in the late eighteenth century and its many applications allowed labor
11. The Cultural Revolution years in China can be interpreted as a decline in the fraction of total population
devoted to the production of technology (i.e., research and development). The Romer model predicts
12. There are many potential “stories” that rationalize the idea that a higher population will increase
incentives to spur technological change. One of them is that a higher population puts more pressure
13. The statement is false. Both Solow’s and Romer’s models conclude that changes in the saving rate do
not affect the long run (i.e., sustained) growth rate of per capita output. In the case of Solow’s model,
Chapter 7 Drivers of Growth: Technology, Policy, and Institutions 77
◼ Answers to Data Analysis Problems
1. a.-c.No answer shown.
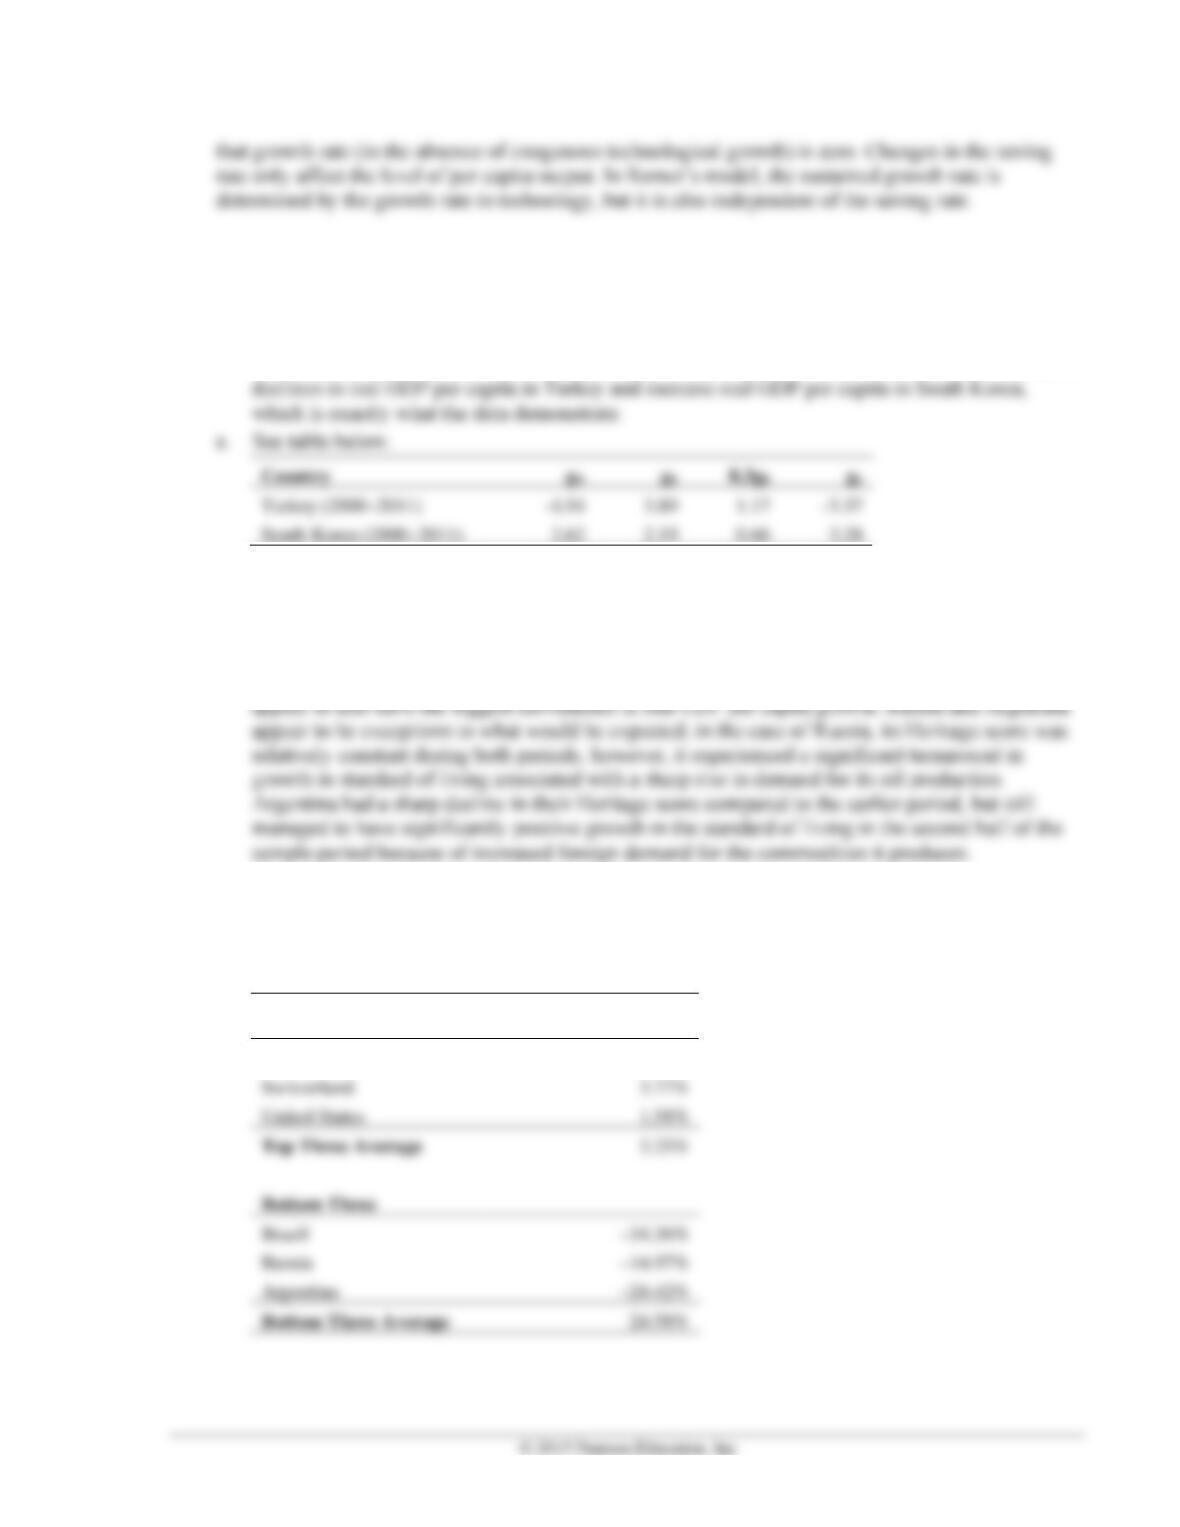
d. See table below. Total factor productivity in Turkey fell sharply over this period of time, while
total factor productivity increased in South Korea. The Solow model predicts that this will lead to
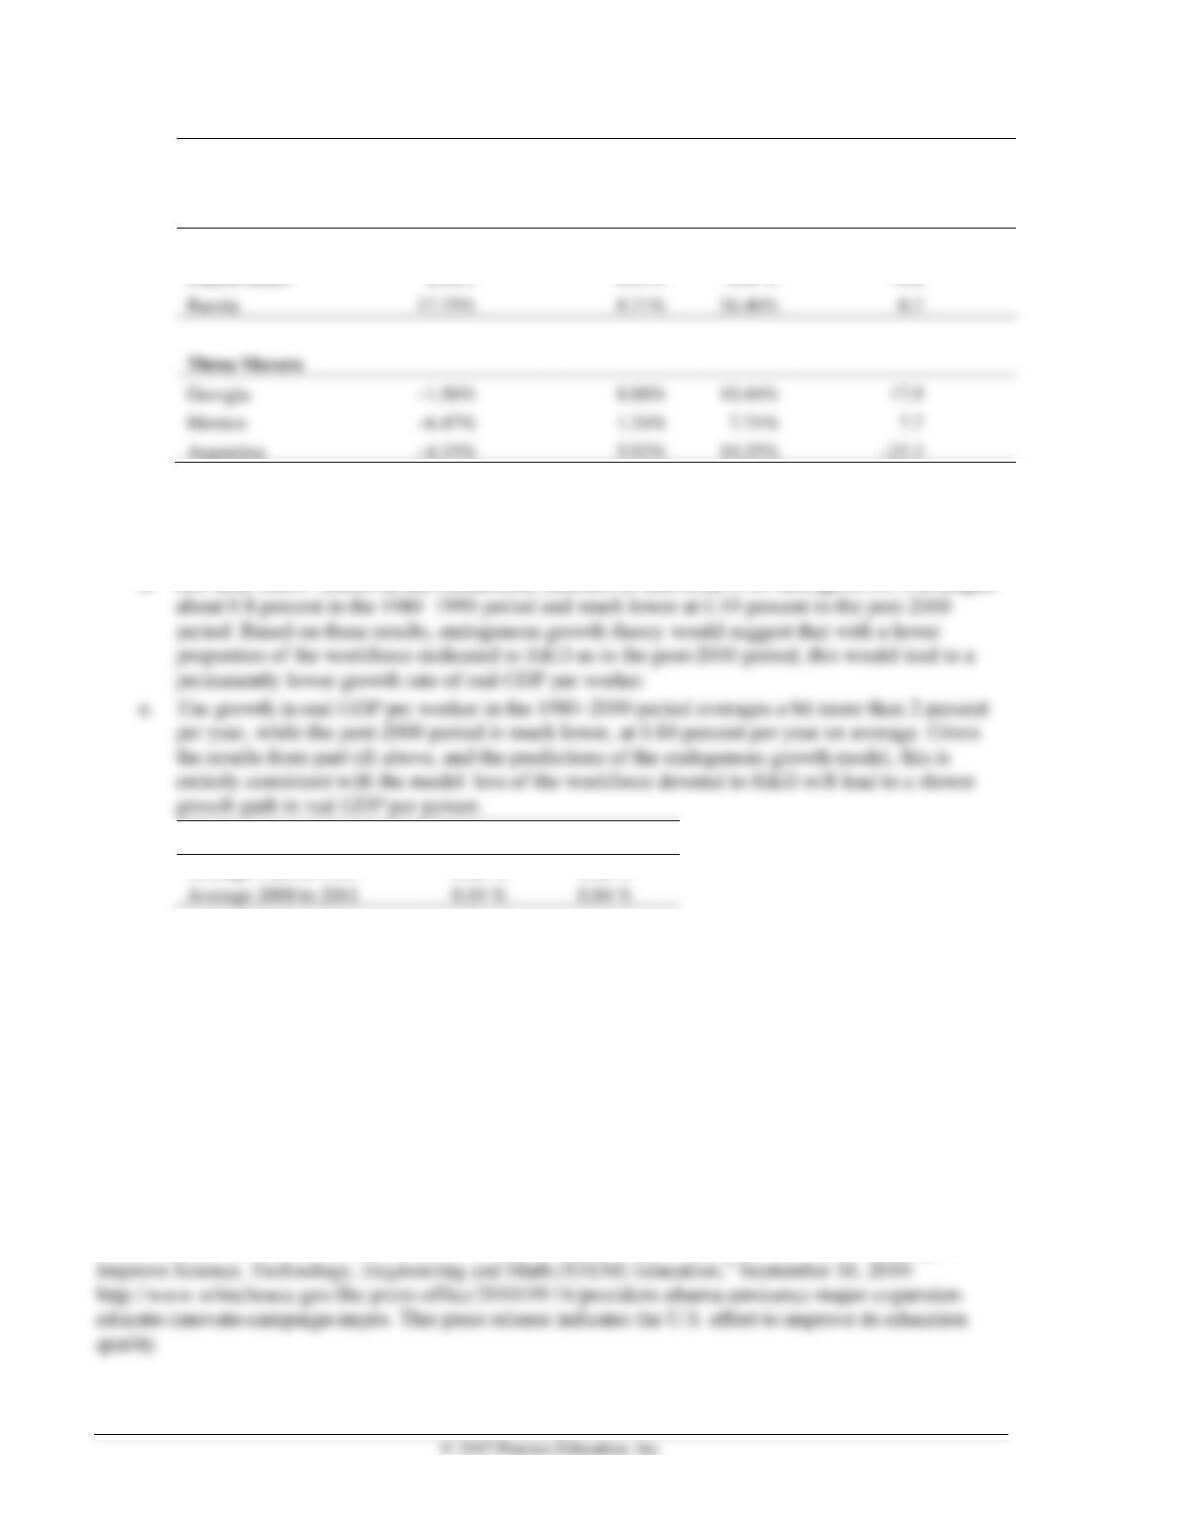
2. a. See table below. Clearly, the countries that have overall higher economic freedom scores have
much higher average growth rates of per capita real GDP than those with lower scores. Brazil,
Russia, and Argentina have very large negative real GDP per capita growth, suggesting that their
very poor institutions have a large impact on standard of living overall.
b. See table below. The countries that have the biggest movement in the Heritage index generally
c. The results from part (a) and (b) generally support the importance of institutions, transparency,
and rule of law in determining total factor productivity for a country and, hence, sustained growth
in the standard of living. Countries that have weak institutions, lack transparency, and have poor
rule of law suffer from low or negative TFP growth, which hurts real GDP per capita (and vice
versa).
Top Three
1980–2011 Average
Real GDP PC growth
Singapore
4.39%
Switzerland
3.77%
1.58%
Top Three Average
3.25%
Bottom Three
Brazil
Russia
Argentina
Bottom Three Average
78 Mishkin • Macroeconomics: Policy and Practice, Second Edition
Three Static
1995–2004 Average Real
GDP PC Growth
2005–2011
Average Real
GDP PC
Growth
Growth
Rate
Change
2000–2013 Heritage
Change
Singapore
3.28%
3.24%
–0.04%
0.3
United States
2.18%
Russia
8.71%
–0.7
Georgia
8.88%
Mexico
1.24%
7.7
Argentina
5.92%
0.31%
–1.87%
–0.4
3. a. αt = [ At + 1/At – 1]/LFt, where LFt is the (indexed) labor force. Yearly data calculations not shown.
b. Yearly data calculations not shown.
c. Yearly data calculations not shown.
d. See table below. Based on this constructed measure of data from 1980 through 2011, α averaged
α
gy, per year
Average 1980 to 1999
0.80 %
2.08 %
Average 2000 to 2011
0.19 %
0.84 %
◼ Data Sources, Related Articles, and Discussion Questions
A. For Information About Policy and Practice: Government Measures to
Increase Human Capital
Data Source
UNESCO database: http://stats.uis.unesco.org/unesco/ReportFolders/ReportFolders.aspx. Here you can
find extensive information about different education measurements, like enrollment rates for countries that
are members of the United Nations. You can also get a chart by selecting the table first and then the “see
as a chart” icon.
Related Article
White House, “President Obama to Announce Major Expansion of ‘Educate to Innovate’ Campaign to
Chapter 7 Drivers of Growth: Technology, Policy, and Institutions 79
Discussion Question
During the second half of the twentieth century, many poor countries invested heavily in education and
dramatically increasing their enrollment rates. Despite this effort, most of them remain poor. How is this
possible?
Answer: Investing in education does not guarantee an improvement in human capital or an increase in labor
productivity. Many poor countries learned this lesson the hard way. Huge investments in education during
B. For Information About Policy and Practice: The World Bank’s Doing
Business
Data Source
Related Article
Espinosa, Alberto, “Colombia: Private Help for a Public Problem”:
Discussion Questions
What would be the consequences for both a domestic entrepreneur and a foreign investor of a country
improving its Doing Business ranking? How would this benefit that country?
Answer: Improving the channels by which one can set a legal business (i.e., improving its Doing Business
C. For Information About Policy and Practice: Does Foreign Aid Work?
Data Source
80 Mishkin • Macroeconomics: Policy and Practice, Second Edition
Related Article
Discussion Question
Consider the above paper: “Who Gives Foreign Aid to Whom and Why?” What would be the result in
terms of economic growth of foreign aid flows destined to support a poor country’s government in
exchange for political favors?
Answer: Even if used properly, foreign aid flows do not guarantee an increase in economic growth.
D. For Information About Application: Does Population Growth Improve
Living Standards?
Data Source
Maddison, Angus, “Statistics on World Population, GDP and Per Capita GDP, 1–2008 AD”:
Related Article
World Bank, “World Development Indicators”: http://data.worldbank.org/data-catalog/world-
Discussion Question
According to Michael Kremer’s conclusions about the link between population growth and technological
change, what do you think would be the consequence of a stagnating world population on the rate of
technological change?
Answer: A stagnating world population would decrease the rate of technological advance, according to the